

Key Insights
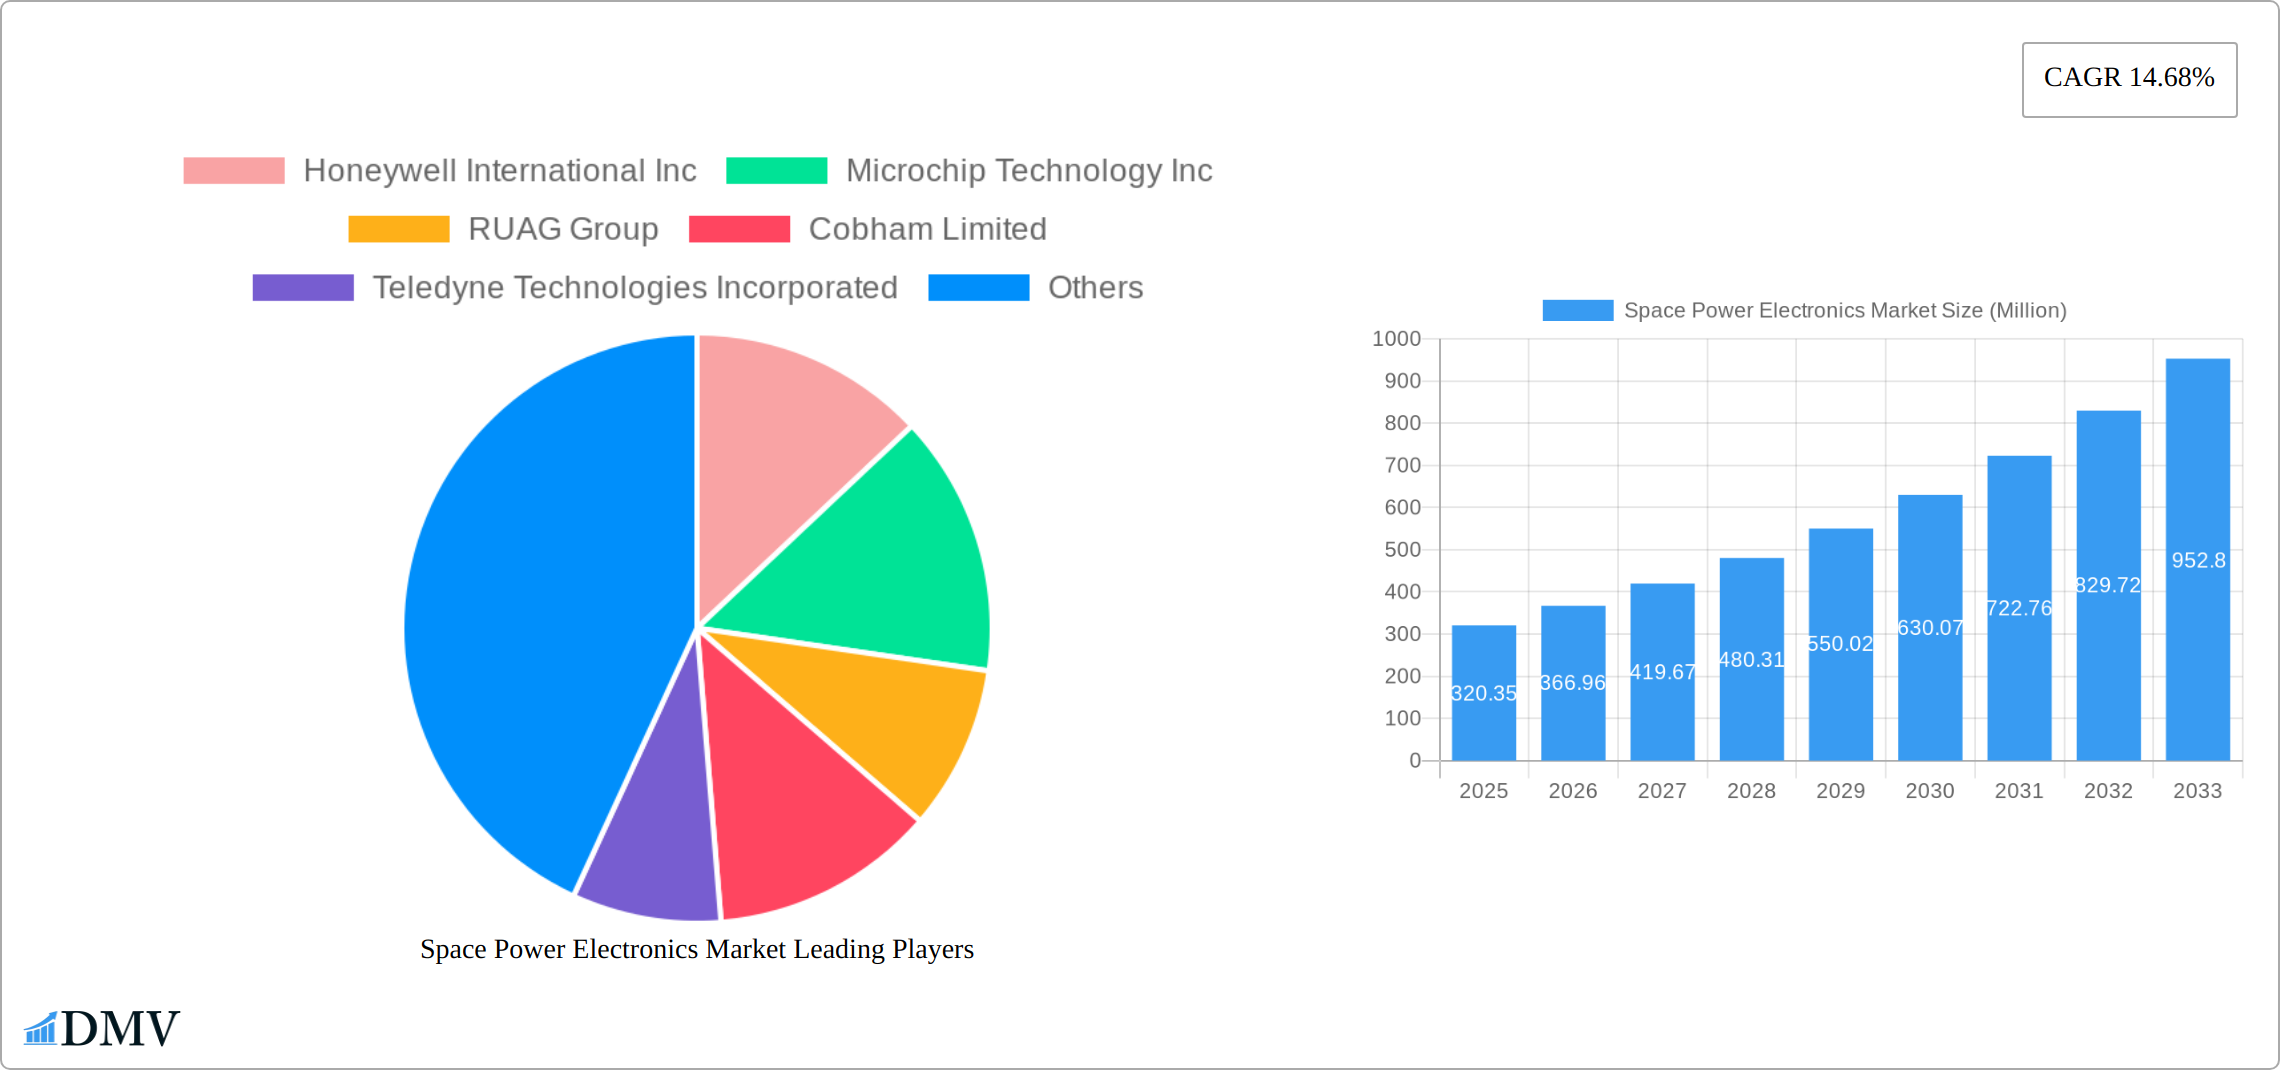
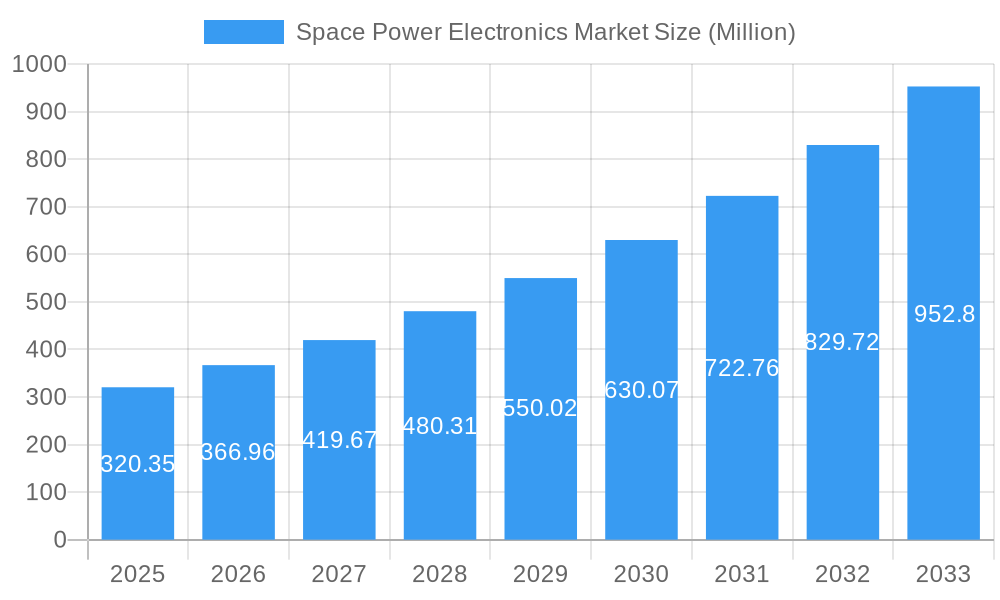
The Space Power Electronics market, valued at $320.35 million in 2025, is projected to experience robust growth, driven by increasing demand for reliable power systems in space exploration and communication. A Compound Annual Growth Rate (CAGR) of 14.68% from 2025 to 2033 indicates a significant expansion of the market, exceeding $1 billion by the end of the forecast period. Key drivers include the burgeoning satellite constellation market, growing investments in space-based infrastructure for global positioning systems (GPS), earth observation, and communication networks, along with advancements in miniaturization and efficiency of power electronics. The increasing adoption of radiation-hardened and radiation-tolerant components caters to the harsh conditions of the space environment, further fueling market growth. Segmentation reveals that satellites and spacecraft, along with associated launch vehicles, represent a substantial portion of the market due to the sophisticated power management systems required for these applications. Key players like Honeywell International Inc., Microchip Technology Inc., and Texas Instruments Incorporated are driving innovation through improved technologies and strategic partnerships. Geographic analysis shows North America currently holds a significant market share due to substantial investments in space exploration and technological advancements, but the Asia-Pacific region is expected to witness rapid growth due to increasing government initiatives and private sector investment.
Space Power Electronics Market Market Size (In Million)
The market's growth trajectory is influenced by several factors. Government initiatives promoting space exploration and commercialization play a critical role, alongside advancements in power electronics technology. However, high initial investment costs for developing and implementing these systems and the need for stringent quality control and reliability testing may act as restraints. Nevertheless, the increasing need for reliable and efficient power sources in space-based applications will overcome these challenges, leading to continued market expansion throughout the forecast period. The market is witnessing a shift towards more sustainable and energy-efficient solutions, with a focus on reducing weight and improving the lifespan of power systems. This trend will further propel market growth and drive innovation in the coming years. The integration of artificial intelligence and machine learning for predictive maintenance and autonomous control of power systems also represents a significant opportunity for market expansion.
Space Power Electronics Market Company Market Share
Space Power Electronics Market Market Composition & Trends
The Space Power Electronics Market is characterized by a dynamic composition, driven by a confluence of factors including market concentration, innovation catalysts, and regulatory landscapes. The market exhibits a moderate level of concentration, with key players like Honeywell International Inc and BAE Systems PLC holding significant market shares. In 2025, the top five companies are expected to account for approximately 50% of the market, highlighting the competitive nature of the industry. Innovation is spurred by the need for more efficient and reliable power solutions in space applications, with research and development investments reaching new heights. Regulatory landscapes are evolving, with agencies like NASA and ESA setting stringent standards for space-grade electronics, which influences market dynamics.
Substitute products such as traditional power systems face challenges in meeting the rigorous demands of space environments, thereby favoring the adoption of advanced power electronics. End-user profiles range from government agencies to commercial satellite operators, each with unique requirements and purchasing behaviors. Mergers and acquisitions (M&A) are pivotal in shaping the market, with deal values reaching into the hundreds of millions. For instance, in 2024, a notable acquisition valued at $300 Million by a leading player aimed to enhance its product portfolio in radiation-hardened electronics.
- Market Share Distribution: Top 5 companies hold 50% of the market in 2025.
- M&A Deal Values: Notable acquisitions in 2024 valued at $300 Million.
- R&D Investments: Increased focus on developing efficient power solutions.
Space Power Electronics Market Industry Evolution
The Space Power Electronics Market has undergone a profound transformation from 2019 to 2033, driven by an escalating demand for sophisticated power solutions across a spectrum of space applications. The market's growth trajectory has been remarkably strong, projecting a compound annual growth rate (CAGR) of 7.5% during the forecast period of 2025-2033. This impressive expansion is primarily attributed to breakthroughs in radiation-hardened and radiation-tolerant electronics, technologies that are absolutely critical for ensuring the unwavering reliability of components operating in the unforgiving conditions of space. The adoption of these advanced technologies has seen a dramatic surge, reaching an estimated penetration rate of 60% within satellite applications by 2025.
Evolving consumer demands, shaped by the accelerating pace of satellite launches and the overall expansion of the space industry, are increasingly leaning towards power systems that are both more efficient and remarkably compact. The rapid proliferation of small satellites and CubeSats has been a significant catalyst, necessitating the development of highly miniaturized power electronics, leading to a substantial 40% increase in demand for such solutions since 2019. Furthermore, the burgeoning landscape of commercial space ventures has injected considerable momentum into the market, with private enterprises making substantial investments in critical space infrastructure. The integration of power electronics within spacecraft and launch vehicles has also experienced a notable upswing, with a 30% rise in their application over the historical period spanning 2019-2024.
The market's evolution is further characterized by the emergence of exciting new application areas, including earth observation and advanced navigation systems, where the demand for high-performance power electronics is on a consistent upward trend. A growing emphasis on sustainability and energy efficiency in space missions is also fueling innovation, with leading companies such as Infineon Technologies AG and Texas Instruments Incorporated at the forefront of developing pioneering solutions that address these critical imperatives.
Leading Regions, Countries, or Segments in Space Power Electronics Market
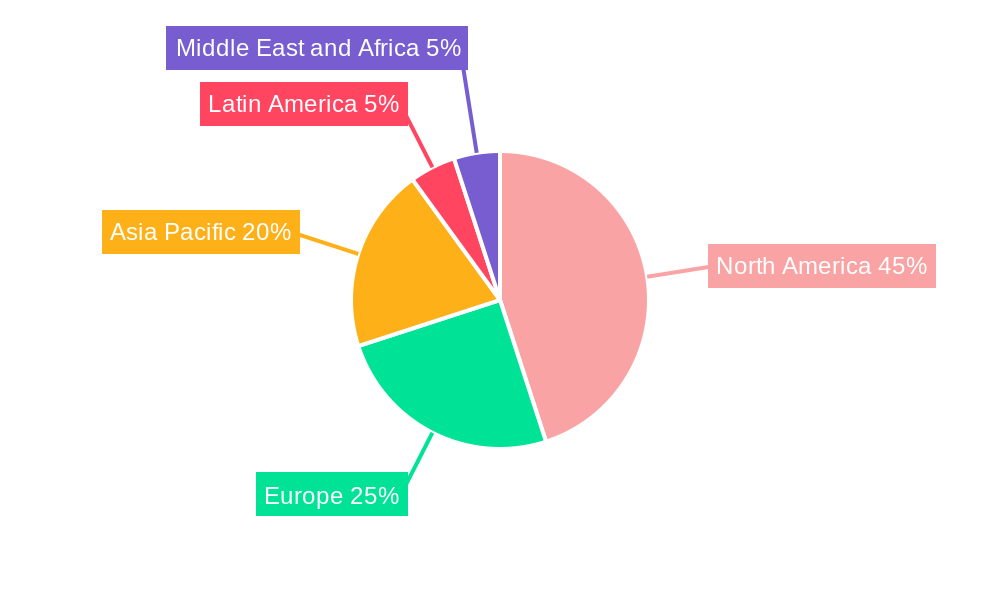
The Space Power Electronics Market exhibits distinct dominance in various regions, countries, and segments. North America stands out as the leading region, driven by significant investments in space technology and a robust regulatory environment that supports innovation. The United States, in particular, is at the forefront, with major players like NASA and SpaceX driving demand for advanced power electronics.
- Key Drivers in North America:
- High investment in space technology, reaching $10 Billion annually.
- Strong regulatory support from agencies like NASA and the FAA.
- Presence of leading companies such as Honeywell International Inc and BAE Systems PLC.
In terms of segments, the platform segment of Satellites is the most dominant, accounting for 45% of the market share in 2025. This dominance is fueled by the increasing number of satellite launches for various applications, including communication and earth observation. The type segment of Radiation-Hardened electronics is also significant, with a market share of 35% due to its critical role in ensuring the reliability of space missions.
- Key Drivers in the Satellites Segment:
- Rising demand for satellite-based communication and data services.
- Increased launches of small satellites and CubeSats, with a 50% increase since 2019.
- Technological advancements in satellite power systems.
The application segment of Communication is another area of dominance, driven by the global need for reliable and efficient communication networks. This segment is expected to grow at a CAGR of 8% during the forecast period, supported by the expansion of satellite constellations and the increasing use of space-based internet services.
- Key Drivers in the Communication Segment:
- Expansion of satellite constellations like Starlink and OneWeb.
- Growing demand for space-based internet services, with a projected 30% increase by 2033.
- Technological advancements in high-frequency power electronics.
Space Power Electronics Market Product Innovations
The Space Power Electronics Market is currently experiencing a wave of groundbreaking product innovations, meticulously designed to meet the stringent and unique requirements of space applications. Leading companies are intensely focused on developing advanced radiation-hardened and radiation-tolerant solutions that significantly enhance the reliability, longevity, and overall performance of space missions. As a prime example, Microchip Technology Inc. has unveiled a new generation of radiation-hardened power management ICs. These cutting-edge components boast superior efficiency and a remarkably reduced physical footprint, making them exceptionally well-suited for the demanding constraints of satellite applications. These innovations are distinguished by their exceptional power density, robust performance characteristics under extreme environmental conditions, and their ability to withstand the harsh radiation prevalent in space, solidifying their indispensable role in the success of modern space endeavors.
Propelling Factors for Space Power Electronics Market Growth
Several pivotal factors are acting as powerful engines driving the growth of the Space Power Electronics Market. From a technological standpoint, advancements in radiation-hardened and radiation-tolerant electronics are paramount, enabling the deployment of power systems in space that are not only more reliable but also significantly more efficient. Economically, a substantial increase in investments directed towards space technology, with North America alone contributing an impressive $10 billion annually, is a key driver of market expansion. Furthermore, regulatory influences, including the implementation of supportive policies and initiatives by esteemed agencies such as NASA and ESA, play a crucial role in fostering an environment that is highly conducive to innovation, research, and overall market growth.
Obstacles in the Space Power Electronics Market Market
The Space Power Electronics Market faces several obstacles that could hinder its growth. Regulatory challenges, such as stringent standards for space-grade electronics, pose significant barriers to entry for new players. Supply chain disruptions, particularly in the sourcing of rare materials needed for radiation-hardened components, can delay product development and increase costs. Additionally, competitive pressures from established players like Honeywell International Inc and BAE Systems PLC can limit market access for smaller companies, with an estimated impact of a 5% reduction in market share for new entrants.
Future Opportunities in Space Power Electronics Market
The landscape of the Space Power Electronics Market is brimming with exciting emerging opportunities, propelled by the advent of new markets, transformative technologies, and evolving consumer preferences. The burgeoning sector of commercial space ventures presents a particularly significant avenue for growth, as companies like SpaceX and Blue Origin aggressively expand their operations, thereby escalating the demand for sophisticated power electronics. Technological advancements focused on miniaturization and enhanced energy efficiency are also unlocking new frontiers for market expansion, especially within the rapidly growing small satellite and CubeSat segments. Concurrently, prevailing consumer trends emphasizing sustainable and reusable space missions are further underscoring the immense potential for the development and deployment of innovative power solutions.
Major Players in the Space Power Electronics Market Ecosystem
Key Developments in Space Power Electronics Market Industry
- January 2023: Honeywell International Inc launched a new line of radiation-hardened power management ICs, enhancing satellite performance and reliability.
- March 2024: BAE Systems PLC acquired a leading provider of radiation-tolerant electronics for $300 Million, expanding its market presence.
- June 2025: Microchip Technology Inc introduced advanced power solutions for small satellites, catering to the growing demand for miniaturized electronics.
Strategic Space Power Electronics Market Market Forecast
The strategic forecast for the Space Power Electronics Market projects a period of robust and sustained growth, fueled by a confluence of powerful catalysts. Future opportunities arising from new and expanding markets, most notably the dynamic commercial space ventures sector, are anticipated to be major propellers of market advancement. Ongoing technological innovations in miniaturization and energy efficiency will continue to bolster the market's potential, with a particularly strong impact expected in the small satellite and CubeSat arenas. The market is strategically positioned to achieve an impressive valuation of $5 billion by the year 2033, underpinned by a continuously increasing global demand for dependable and highly efficient power solutions tailored for the unique challenges of space applications.
Space Power Electronics Market Segmentation
-
1. Platform
- 1.1. Satellites
- 1.2. Spacecraft and Launch Vehicles
- 1.3. Others
-
2. Type
- 2.1. Radiation-Hardened
- 2.2. Radiation-Tolerant
-
3. Application
- 3.1. Communication
- 3.2. Earth Observation
- 3.3. Navigati
- 3.4. Technology Development and Education
- 3.5. Others
Space Power Electronics Market Segmentation By Geography
-
1. North America
- 1.1. United States
- 1.2. Canada
-
2. Europe
- 2.1. United Kingdom
- 2.2. France
- 2.3. Germany
- 2.4. Russia
- 2.5. Rest of Europe
-
3. Asia Pacific
- 3.1. China
- 3.2. India
- 3.3. Japan
- 3.4. South Korea
- 3.5. Rest of Asia Pacific
-
4. Latin America
- 4.1. Brazil
- 4.2. Rest of Latin America
-
5. Middle East and Africa
- 5.1. Saudi Arabia
- 5.2. United Arab Emirates
- 5.3. Rest of Middle East and Africa
Space Power Electronics Market Regional Market Share
Geographic Coverage of Space Power Electronics Market
Space Power Electronics Market REPORT HIGHLIGHTS
| Aspects | Details |
|---|---|
| Study Period | 2020-2034 |
| Base Year | 2025 |
| Estimated Year | 2026 |
| Forecast Period | 2026-2034 |
| Historical Period | 2020-2025 |
| Growth Rate | CAGR of 14.68% from 2020-2034 |
| Segmentation |
|
Table of Contents
- 1. Introduction
- 1.1. Research Scope
- 1.2. Market Segmentation
- 1.3. Research Methodology
- 1.4. Definitions and Assumptions
- 2. Executive Summary
- 2.1. Introduction
- 3. Market Dynamics
- 3.1. Introduction
- 3.2. Market Drivers
- 3.3. Market Restrains
- 3.4. Market Trends
- 3.4.1. Satellites are Expected to Dominate the Market During the Forecast Period
- 4. Market Factor Analysis
- 4.1. Porters Five Forces
- 4.2. Supply/Value Chain
- 4.3. PESTEL analysis
- 4.4. Market Entropy
- 4.5. Patent/Trademark Analysis
- 5. Global Space Power Electronics Market Analysis, Insights and Forecast, 2020-2032
- 5.1. Market Analysis, Insights and Forecast - by Platform
- 5.1.1. Satellites
- 5.1.2. Spacecraft and Launch Vehicles
- 5.1.3. Others
- 5.2. Market Analysis, Insights and Forecast - by Type
- 5.2.1. Radiation-Hardened
- 5.2.2. Radiation-Tolerant
- 5.3. Market Analysis, Insights and Forecast - by Application
- 5.3.1. Communication
- 5.3.2. Earth Observation
- 5.3.3. Navigati
- 5.3.4. Technology Development and Education
- 5.3.5. Others
- 5.4. Market Analysis, Insights and Forecast - by Region
- 5.4.1. North America
- 5.4.2. Europe
- 5.4.3. Asia Pacific
- 5.4.4. Latin America
- 5.4.5. Middle East and Africa
- 5.1. Market Analysis, Insights and Forecast - by Platform
- 6. North America Space Power Electronics Market Analysis, Insights and Forecast, 2020-2032
- 6.1. Market Analysis, Insights and Forecast - by Platform
- 6.1.1. Satellites
- 6.1.2. Spacecraft and Launch Vehicles
- 6.1.3. Others
- 6.2. Market Analysis, Insights and Forecast - by Type
- 6.2.1. Radiation-Hardened
- 6.2.2. Radiation-Tolerant
- 6.3. Market Analysis, Insights and Forecast - by Application
- 6.3.1. Communication
- 6.3.2. Earth Observation
- 6.3.3. Navigati
- 6.3.4. Technology Development and Education
- 6.3.5. Others
- 6.1. Market Analysis, Insights and Forecast - by Platform
- 7. Europe Space Power Electronics Market Analysis, Insights and Forecast, 2020-2032
- 7.1. Market Analysis, Insights and Forecast - by Platform
- 7.1.1. Satellites
- 7.1.2. Spacecraft and Launch Vehicles
- 7.1.3. Others
- 7.2. Market Analysis, Insights and Forecast - by Type
- 7.2.1. Radiation-Hardened
- 7.2.2. Radiation-Tolerant
- 7.3. Market Analysis, Insights and Forecast - by Application
- 7.3.1. Communication
- 7.3.2. Earth Observation
- 7.3.3. Navigati
- 7.3.4. Technology Development and Education
- 7.3.5. Others
- 7.1. Market Analysis, Insights and Forecast - by Platform
- 8. Asia Pacific Space Power Electronics Market Analysis, Insights and Forecast, 2020-2032
- 8.1. Market Analysis, Insights and Forecast - by Platform
- 8.1.1. Satellites
- 8.1.2. Spacecraft and Launch Vehicles
- 8.1.3. Others
- 8.2. Market Analysis, Insights and Forecast - by Type
- 8.2.1. Radiation-Hardened
- 8.2.2. Radiation-Tolerant
- 8.3. Market Analysis, Insights and Forecast - by Application
- 8.3.1. Communication
- 8.3.2. Earth Observation
- 8.3.3. Navigati
- 8.3.4. Technology Development and Education
- 8.3.5. Others
- 8.1. Market Analysis, Insights and Forecast - by Platform
- 9. Latin America Space Power Electronics Market Analysis, Insights and Forecast, 2020-2032
- 9.1. Market Analysis, Insights and Forecast - by Platform
- 9.1.1. Satellites
- 9.1.2. Spacecraft and Launch Vehicles
- 9.1.3. Others
- 9.2. Market Analysis, Insights and Forecast - by Type
- 9.2.1. Radiation-Hardened
- 9.2.2. Radiation-Tolerant
- 9.3. Market Analysis, Insights and Forecast - by Application
- 9.3.1. Communication
- 9.3.2. Earth Observation
- 9.3.3. Navigati
- 9.3.4. Technology Development and Education
- 9.3.5. Others
- 9.1. Market Analysis, Insights and Forecast - by Platform
- 10. Middle East and Africa Space Power Electronics Market Analysis, Insights and Forecast, 2020-2032
- 10.1. Market Analysis, Insights and Forecast - by Platform
- 10.1.1. Satellites
- 10.1.2. Spacecraft and Launch Vehicles
- 10.1.3. Others
- 10.2. Market Analysis, Insights and Forecast - by Type
- 10.2.1. Radiation-Hardened
- 10.2.2. Radiation-Tolerant
- 10.3. Market Analysis, Insights and Forecast - by Application
- 10.3.1. Communication
- 10.3.2. Earth Observation
- 10.3.3. Navigati
- 10.3.4. Technology Development and Education
- 10.3.5. Others
- 10.1. Market Analysis, Insights and Forecast - by Platform
- 11. Competitive Analysis
- 11.1. Global Market Share Analysis 2025
- 11.2. Company Profiles
- 11.2.1 Honeywell International Inc
- 11.2.1.1. Overview
- 11.2.1.2. Products
- 11.2.1.3. SWOT Analysis
- 11.2.1.4. Recent Developments
- 11.2.1.5. Financials (Based on Availability)
- 11.2.2 Microchip Technology Inc
- 11.2.2.1. Overview
- 11.2.2.2. Products
- 11.2.2.3. SWOT Analysis
- 11.2.2.4. Recent Developments
- 11.2.2.5. Financials (Based on Availability)
- 11.2.3 RUAG Group
- 11.2.3.1. Overview
- 11.2.3.2. Products
- 11.2.3.3. SWOT Analysis
- 11.2.3.4. Recent Developments
- 11.2.3.5. Financials (Based on Availability)
- 11.2.4 Cobham Limited
- 11.2.4.1. Overview
- 11.2.4.2. Products
- 11.2.4.3. SWOT Analysis
- 11.2.4.4. Recent Developments
- 11.2.4.5. Financials (Based on Availability)
- 11.2.5 Teledyne Technologies Incorporated
- 11.2.5.1. Overview
- 11.2.5.2. Products
- 11.2.5.3. SWOT Analysis
- 11.2.5.4. Recent Developments
- 11.2.5.5. Financials (Based on Availability)
- 11.2.6 BAE Systems PLC
- 11.2.6.1. Overview
- 11.2.6.2. Products
- 11.2.6.3. SWOT Analysis
- 11.2.6.4. Recent Developments
- 11.2.6.5. Financials (Based on Availability)
- 11.2.7 STMicroelectronics NV
- 11.2.7.1. Overview
- 11.2.7.2. Products
- 11.2.7.3. SWOT Analysis
- 11.2.7.4. Recent Developments
- 11.2.7.5. Financials (Based on Availability)
- 11.2.8 ON Semiconductor
- 11.2.8.1. Overview
- 11.2.8.2. Products
- 11.2.8.3. SWOT Analysis
- 11.2.8.4. Recent Developments
- 11.2.8.5. Financials (Based on Availability)
- 11.2.9 Renesas Electronics Corporation
- 11.2.9.1. Overview
- 11.2.9.2. Products
- 11.2.9.3. SWOT Analysis
- 11.2.9.4. Recent Developments
- 11.2.9.5. Financials (Based on Availability)
- 11.2.10 Infineon Technologies A
- 11.2.10.1. Overview
- 11.2.10.2. Products
- 11.2.10.3. SWOT Analysis
- 11.2.10.4. Recent Developments
- 11.2.10.5. Financials (Based on Availability)
- 11.2.11 Texas Instruments Incorporated
- 11.2.11.1. Overview
- 11.2.11.2. Products
- 11.2.11.3. SWOT Analysis
- 11.2.11.4. Recent Developments
- 11.2.11.5. Financials (Based on Availability)
- 11.2.12 Microsemi Conduction
- 11.2.12.1. Overview
- 11.2.12.2. Products
- 11.2.12.3. SWOT Analysis
- 11.2.12.4. Recent Developments
- 11.2.12.5. Financials (Based on Availability)
- 11.2.13 Analog Devices Inc
- 11.2.13.1. Overview
- 11.2.13.2. Products
- 11.2.13.3. SWOT Analysis
- 11.2.13.4. Recent Developments
- 11.2.13.5. Financials (Based on Availability)
- 11.2.1 Honeywell International Inc
List of Figures
- Figure 1: Global Space Power Electronics Market Revenue Breakdown (Million, %) by Region 2025 & 2033
- Figure 2: North America Space Power Electronics Market Revenue (Million), by Platform 2025 & 2033
- Figure 3: North America Space Power Electronics Market Revenue Share (%), by Platform 2025 & 2033
- Figure 4: North America Space Power Electronics Market Revenue (Million), by Type 2025 & 2033
- Figure 5: North America Space Power Electronics Market Revenue Share (%), by Type 2025 & 2033
- Figure 6: North America Space Power Electronics Market Revenue (Million), by Application 2025 & 2033
- Figure 7: North America Space Power Electronics Market Revenue Share (%), by Application 2025 & 2033
- Figure 8: North America Space Power Electronics Market Revenue (Million), by Country 2025 & 2033
- Figure 9: North America Space Power Electronics Market Revenue Share (%), by Country 2025 & 2033
- Figure 10: Europe Space Power Electronics Market Revenue (Million), by Platform 2025 & 2033
- Figure 11: Europe Space Power Electronics Market Revenue Share (%), by Platform 2025 & 2033
- Figure 12: Europe Space Power Electronics Market Revenue (Million), by Type 2025 & 2033
- Figure 13: Europe Space Power Electronics Market Revenue Share (%), by Type 2025 & 2033
- Figure 14: Europe Space Power Electronics Market Revenue (Million), by Application 2025 & 2033
- Figure 15: Europe Space Power Electronics Market Revenue Share (%), by Application 2025 & 2033
- Figure 16: Europe Space Power Electronics Market Revenue (Million), by Country 2025 & 2033
- Figure 17: Europe Space Power Electronics Market Revenue Share (%), by Country 2025 & 2033
- Figure 18: Asia Pacific Space Power Electronics Market Revenue (Million), by Platform 2025 & 2033
- Figure 19: Asia Pacific Space Power Electronics Market Revenue Share (%), by Platform 2025 & 2033
- Figure 20: Asia Pacific Space Power Electronics Market Revenue (Million), by Type 2025 & 2033
- Figure 21: Asia Pacific Space Power Electronics Market Revenue Share (%), by Type 2025 & 2033
- Figure 22: Asia Pacific Space Power Electronics Market Revenue (Million), by Application 2025 & 2033
- Figure 23: Asia Pacific Space Power Electronics Market Revenue Share (%), by Application 2025 & 2033
- Figure 24: Asia Pacific Space Power Electronics Market Revenue (Million), by Country 2025 & 2033
- Figure 25: Asia Pacific Space Power Electronics Market Revenue Share (%), by Country 2025 & 2033
- Figure 26: Latin America Space Power Electronics Market Revenue (Million), by Platform 2025 & 2033
- Figure 27: Latin America Space Power Electronics Market Revenue Share (%), by Platform 2025 & 2033
- Figure 28: Latin America Space Power Electronics Market Revenue (Million), by Type 2025 & 2033
- Figure 29: Latin America Space Power Electronics Market Revenue Share (%), by Type 2025 & 2033
- Figure 30: Latin America Space Power Electronics Market Revenue (Million), by Application 2025 & 2033
- Figure 31: Latin America Space Power Electronics Market Revenue Share (%), by Application 2025 & 2033
- Figure 32: Latin America Space Power Electronics Market Revenue (Million), by Country 2025 & 2033
- Figure 33: Latin America Space Power Electronics Market Revenue Share (%), by Country 2025 & 2033
- Figure 34: Middle East and Africa Space Power Electronics Market Revenue (Million), by Platform 2025 & 2033
- Figure 35: Middle East and Africa Space Power Electronics Market Revenue Share (%), by Platform 2025 & 2033
- Figure 36: Middle East and Africa Space Power Electronics Market Revenue (Million), by Type 2025 & 2033
- Figure 37: Middle East and Africa Space Power Electronics Market Revenue Share (%), by Type 2025 & 2033
- Figure 38: Middle East and Africa Space Power Electronics Market Revenue (Million), by Application 2025 & 2033
- Figure 39: Middle East and Africa Space Power Electronics Market Revenue Share (%), by Application 2025 & 2033
- Figure 40: Middle East and Africa Space Power Electronics Market Revenue (Million), by Country 2025 & 2033
- Figure 41: Middle East and Africa Space Power Electronics Market Revenue Share (%), by Country 2025 & 2033
List of Tables
- Table 1: Global Space Power Electronics Market Revenue Million Forecast, by Platform 2020 & 2033
- Table 2: Global Space Power Electronics Market Revenue Million Forecast, by Type 2020 & 2033
- Table 3: Global Space Power Electronics Market Revenue Million Forecast, by Application 2020 & 2033
- Table 4: Global Space Power Electronics Market Revenue Million Forecast, by Region 2020 & 2033
- Table 5: Global Space Power Electronics Market Revenue Million Forecast, by Platform 2020 & 2033
- Table 6: Global Space Power Electronics Market Revenue Million Forecast, by Type 2020 & 2033
- Table 7: Global Space Power Electronics Market Revenue Million Forecast, by Application 2020 & 2033
- Table 8: Global Space Power Electronics Market Revenue Million Forecast, by Country 2020 & 2033
- Table 9: United States Space Power Electronics Market Revenue (Million) Forecast, by Application 2020 & 2033
- Table 10: Canada Space Power Electronics Market Revenue (Million) Forecast, by Application 2020 & 2033
- Table 11: Global Space Power Electronics Market Revenue Million Forecast, by Platform 2020 & 2033
- Table 12: Global Space Power Electronics Market Revenue Million Forecast, by Type 2020 & 2033
- Table 13: Global Space Power Electronics Market Revenue Million Forecast, by Application 2020 & 2033
- Table 14: Global Space Power Electronics Market Revenue Million Forecast, by Country 2020 & 2033
- Table 15: United Kingdom Space Power Electronics Market Revenue (Million) Forecast, by Application 2020 & 2033
- Table 16: France Space Power Electronics Market Revenue (Million) Forecast, by Application 2020 & 2033
- Table 17: Germany Space Power Electronics Market Revenue (Million) Forecast, by Application 2020 & 2033
- Table 18: Russia Space Power Electronics Market Revenue (Million) Forecast, by Application 2020 & 2033
- Table 19: Rest of Europe Space Power Electronics Market Revenue (Million) Forecast, by Application 2020 & 2033
- Table 20: Global Space Power Electronics Market Revenue Million Forecast, by Platform 2020 & 2033
- Table 21: Global Space Power Electronics Market Revenue Million Forecast, by Type 2020 & 2033
- Table 22: Global Space Power Electronics Market Revenue Million Forecast, by Application 2020 & 2033
- Table 23: Global Space Power Electronics Market Revenue Million Forecast, by Country 2020 & 2033
- Table 24: China Space Power Electronics Market Revenue (Million) Forecast, by Application 2020 & 2033
- Table 25: India Space Power Electronics Market Revenue (Million) Forecast, by Application 2020 & 2033
- Table 26: Japan Space Power Electronics Market Revenue (Million) Forecast, by Application 2020 & 2033
- Table 27: South Korea Space Power Electronics Market Revenue (Million) Forecast, by Application 2020 & 2033
- Table 28: Rest of Asia Pacific Space Power Electronics Market Revenue (Million) Forecast, by Application 2020 & 2033
- Table 29: Global Space Power Electronics Market Revenue Million Forecast, by Platform 2020 & 2033
- Table 30: Global Space Power Electronics Market Revenue Million Forecast, by Type 2020 & 2033
- Table 31: Global Space Power Electronics Market Revenue Million Forecast, by Application 2020 & 2033
- Table 32: Global Space Power Electronics Market Revenue Million Forecast, by Country 2020 & 2033
- Table 33: Brazil Space Power Electronics Market Revenue (Million) Forecast, by Application 2020 & 2033
- Table 34: Rest of Latin America Space Power Electronics Market Revenue (Million) Forecast, by Application 2020 & 2033
- Table 35: Global Space Power Electronics Market Revenue Million Forecast, by Platform 2020 & 2033
- Table 36: Global Space Power Electronics Market Revenue Million Forecast, by Type 2020 & 2033
- Table 37: Global Space Power Electronics Market Revenue Million Forecast, by Application 2020 & 2033
- Table 38: Global Space Power Electronics Market Revenue Million Forecast, by Country 2020 & 2033
- Table 39: Saudi Arabia Space Power Electronics Market Revenue (Million) Forecast, by Application 2020 & 2033
- Table 40: United Arab Emirates Space Power Electronics Market Revenue (Million) Forecast, by Application 2020 & 2033
- Table 41: Rest of Middle East and Africa Space Power Electronics Market Revenue (Million) Forecast, by Application 2020 & 2033
Frequently Asked Questions
1. What is the projected Compound Annual Growth Rate (CAGR) of the Space Power Electronics Market?
The projected CAGR is approximately 14.68%.
2. Which companies are prominent players in the Space Power Electronics Market?
Key companies in the market include Honeywell International Inc, Microchip Technology Inc, RUAG Group, Cobham Limited, Teledyne Technologies Incorporated, BAE Systems PLC, STMicroelectronics NV, ON Semiconductor, Renesas Electronics Corporation, Infineon Technologies A, Texas Instruments Incorporated, Microsemi Conduction, Analog Devices Inc.
3. What are the main segments of the Space Power Electronics Market?
The market segments include Platform, Type, Application.
4. Can you provide details about the market size?
The market size is estimated to be USD 320.35 Million as of 2022.
5. What are some drivers contributing to market growth?
N/A
6. What are the notable trends driving market growth?
Satellites are Expected to Dominate the Market During the Forecast Period.
7. Are there any restraints impacting market growth?
N/A
8. Can you provide examples of recent developments in the market?
N/A
9. What pricing options are available for accessing the report?
Pricing options include single-user, multi-user, and enterprise licenses priced at USD 4750, USD 5250, and USD 8750 respectively.
10. Is the market size provided in terms of value or volume?
The market size is provided in terms of value, measured in Million.
11. Are there any specific market keywords associated with the report?
Yes, the market keyword associated with the report is "Space Power Electronics Market," which aids in identifying and referencing the specific market segment covered.
12. How do I determine which pricing option suits my needs best?
The pricing options vary based on user requirements and access needs. Individual users may opt for single-user licenses, while businesses requiring broader access may choose multi-user or enterprise licenses for cost-effective access to the report.
13. Are there any additional resources or data provided in the Space Power Electronics Market report?
While the report offers comprehensive insights, it's advisable to review the specific contents or supplementary materials provided to ascertain if additional resources or data are available.
14. How can I stay updated on further developments or reports in the Space Power Electronics Market?
To stay informed about further developments, trends, and reports in the Space Power Electronics Market, consider subscribing to industry newsletters, following relevant companies and organizations, or regularly checking reputable industry news sources and publications.
Methodology
Step 1 - Identification of Relevant Samples Size from Population Database


Step 2 - Approaches for Defining Global Market Size (Value, Volume* & Price*)

Note*: In applicable scenarios
Step 3 - Data Sources
Primary Research
- Web Analytics
- Survey Reports
- Research Institute
- Latest Research Reports
- Opinion Leaders
Secondary Research
- Annual Reports
- White Paper
- Latest Press Release
- Industry Association
- Paid Database
- Investor Presentations

Step 4 - Data Triangulation
Involves using different sources of information in order to increase the validity of a study
These sources are likely to be stakeholders in a program - participants, other researchers, program staff, other community members, and so on.
Then we put all data in single framework & apply various statistical tools to find out the dynamic on the market.
During the analysis stage, feedback from the stakeholder groups would be compared to determine areas of agreement as well as areas of divergence