

Key Insights
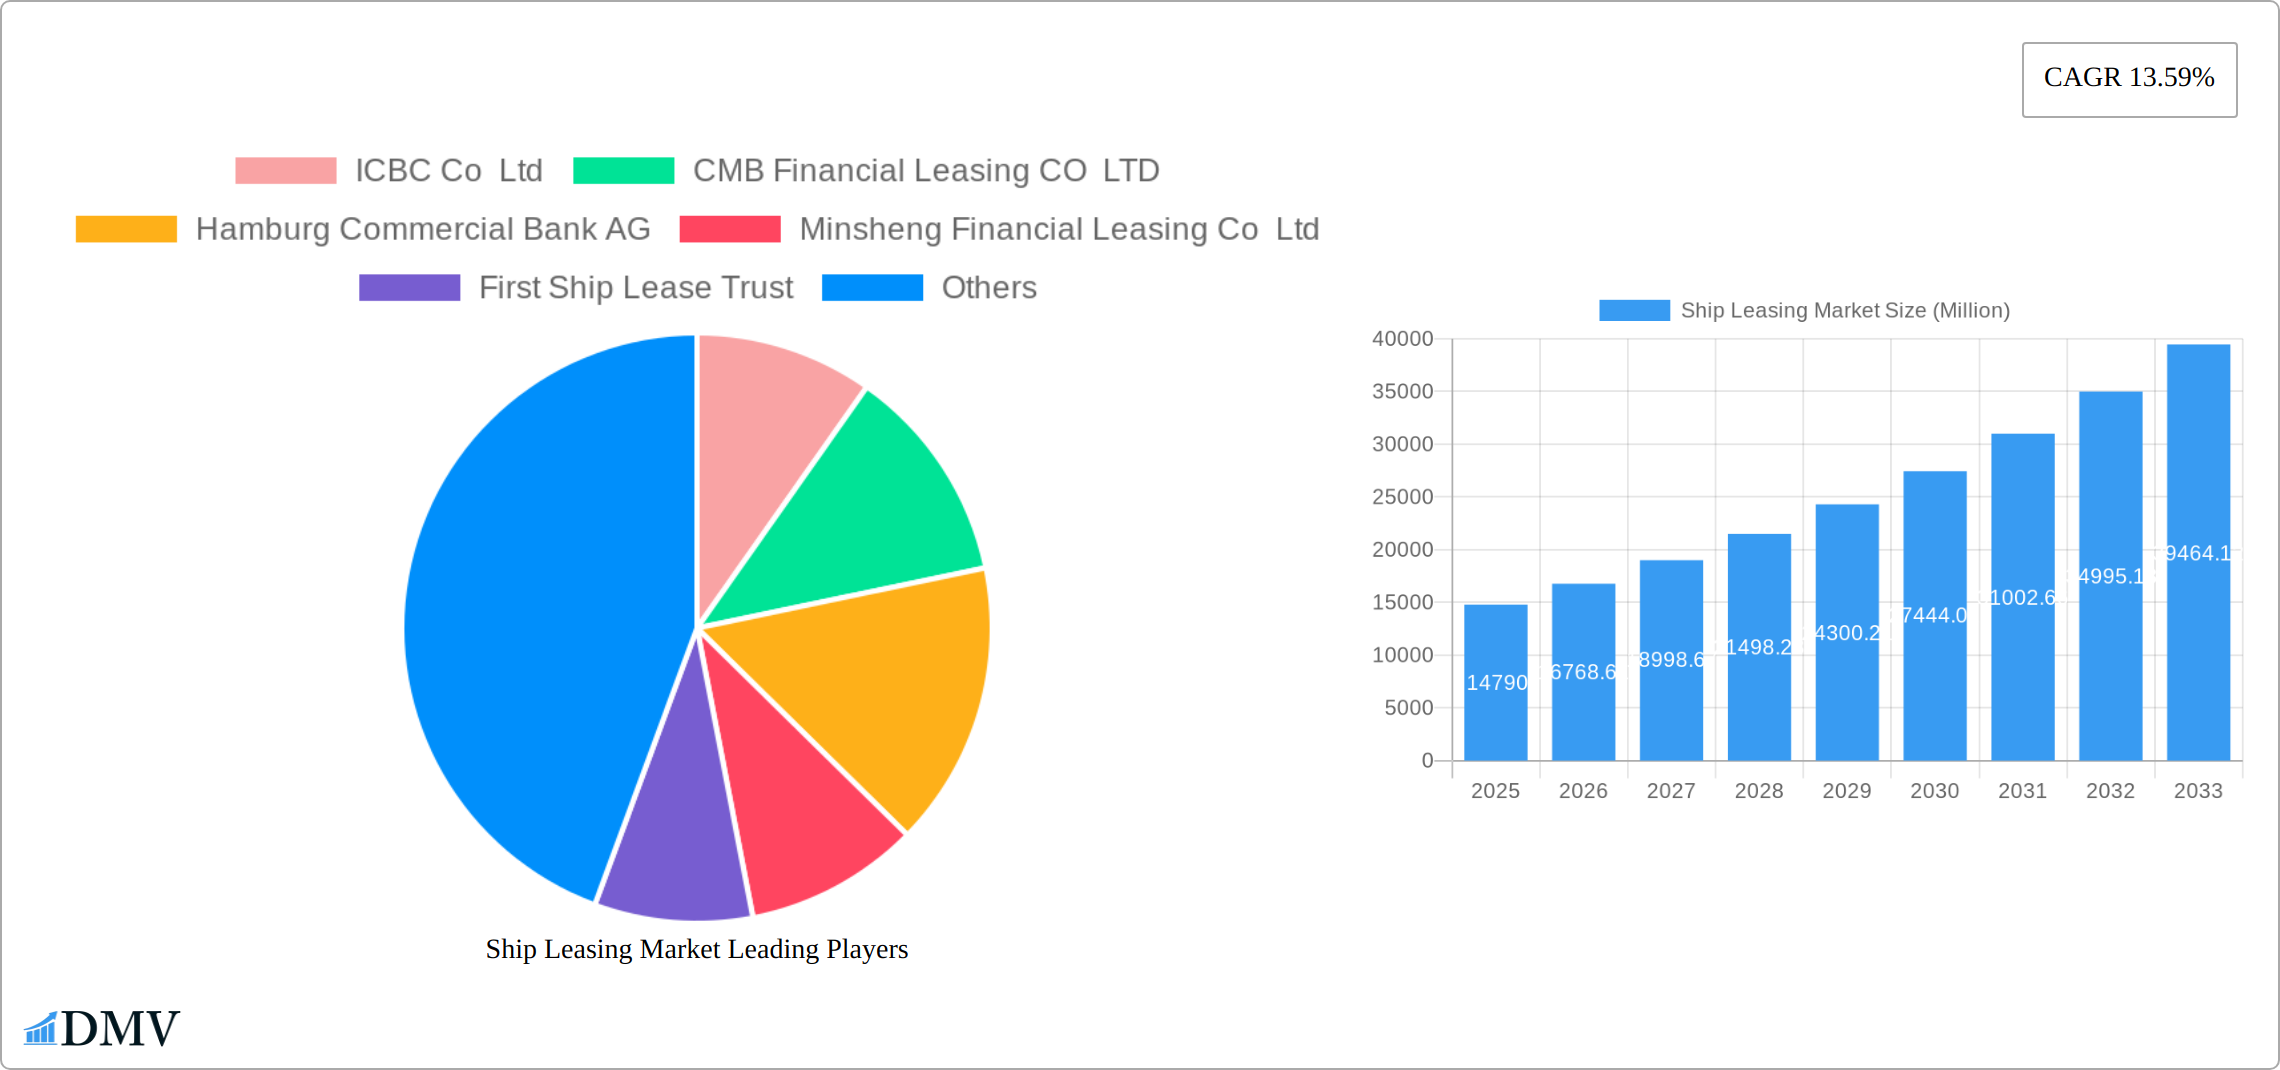
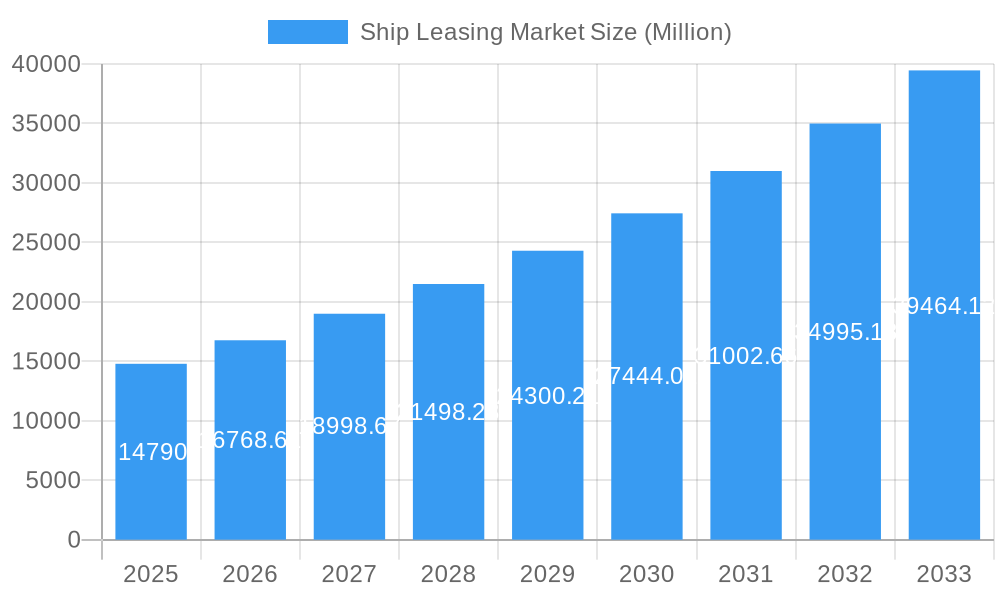
The global ship leasing market, valued at $14.79 billion in 2025, is projected to experience robust growth, exhibiting a Compound Annual Growth Rate (CAGR) of 13.59% from 2025 to 2033. This expansion is fueled by several key drivers. The increasing global trade volume necessitates a larger fleet of vessels, driving demand for leasing options. Furthermore, the high capital expenditure involved in ship acquisition makes leasing an attractive alternative for shipping companies, particularly smaller operators. Technological advancements, such as the adoption of real-time monitoring and data analytics in ship operations, are further enhancing efficiency and driving the market's growth. The market is segmented by lease type (financial lease, full-service lease), application (container ships, bulk carriers), and lease term (real-time lease, periodic tenancy, bareboat charter). Financial leases are currently dominant due to their tax advantages, while the container ship segment leads in terms of application, reflecting the ongoing surge in containerized cargo. North America and Asia-Pacific are expected to be major contributors to market growth, driven by expanding economies and maritime trade activities. However, potential restraints such as fluctuating fuel prices, geopolitical uncertainties impacting global trade routes, and stricter environmental regulations could influence the market's trajectory. Competition among established players like ICBC Co Ltd, CMB Financial Leasing Co LTD, and A P Møller - Mærsk A/S, alongside the emergence of new entrants, will shape the market landscape in the coming years.
Ship Leasing Market Market Size (In Billion)
The competitive landscape includes both large financial institutions and specialized ship leasing companies, leading to a mix of strategies and service offerings. Key players are focusing on expanding their fleet sizes, geographical reach, and technological capabilities to maintain a competitive edge. Strategic partnerships and mergers and acquisitions are likely to increase in frequency as companies seek to consolidate their market positions. The evolving regulatory environment necessitates compliance with international maritime regulations, influencing the types of ships being leased and the terms of lease agreements. The industry's focus on sustainable practices, such as reducing carbon emissions and improving fuel efficiency, is also driving innovation and influencing leasing strategies. The market forecast for 2033 suggests a substantial increase in market size, driven by the continued expansion of global trade and the ongoing preference for ship leasing as a cost-effective and flexible solution within the maritime industry.
Ship Leasing Market Company Market Share
Ship Leasing Market: A Comprehensive Report (2019-2033)
This insightful report provides a detailed analysis of the global Ship Leasing Market, offering a comprehensive overview of market dynamics, growth drivers, challenges, and future opportunities from 2019 to 2033. The study covers key segments including lease types (Financial Lease, Full-Service Lease), ship applications (Container Ships, Bulk Carriers), and lease structures (Real-Time Lease, Periodic Tenancy, Bareboat Charter, Other Types). With a base year of 2025 and a forecast period spanning 2025-2033, this report is an essential resource for stakeholders seeking to understand and capitalize on the evolving landscape of the ship leasing industry. The report values are in Millions.
Ship Leasing Market Composition & Trends
The global ship leasing market exhibits a moderately concentrated structure, with key players like ICBC Co Ltd, CMB Financial Leasing CO LTD, and A P Møller - Mærsk A/S holding significant market share. The market share distribution in 2025 is estimated as follows: ICBC Co Ltd (xx%), CMB Financial Leasing CO LTD (xx%), A P Møller - Mærsk A/S (xx%), and others (xx%). Innovation is driven by advancements in digital technologies enabling real-time monitoring and predictive maintenance, streamlining operational efficiency. Stringent regulatory compliance, particularly concerning environmental regulations (IMO 2020 and beyond), is a crucial factor impacting market dynamics. Substitute products, such as alternative transportation modes, pose a limited threat given the irreplaceable role of shipping in global trade. End-users predominantly consist of shipping lines, logistics companies, and charterers, with varying needs and contract preferences. M&A activity has been moderate in recent years, with estimated deal values totaling xx Million in 2024.
- Market Concentration: Moderately concentrated, with top players holding xx% market share.
- Innovation Catalysts: Digital technologies, predictive maintenance, and automation.
- Regulatory Landscape: Stringent environmental regulations and safety standards.
- Substitute Products: Limited substitutes due to shipping's irreplaceable role.
- End-User Profile: Shipping lines, logistics companies, and charterers.
- M&A Activity: Moderate activity, with xx Million in deal values in 2024.
Ship Leasing Market Industry Evolution
The ship leasing market has undergone a significant transformation. Following a period of consolidation between 2019 and 2024, the industry has witnessed a gradual but robust recovery post-2024. This evolution is largely driven by the pervasive integration of cutting-edge technological advancements. The adoption of IoT sensors for real-time, remote vessel monitoring and sophisticated AI-powered route optimization algorithms are fundamentally reshaping operational efficiency and driving down cost structures. Simultaneously, a pronounced shift in consumer demand towards sustainability is compelling the industry to prioritize the adoption of eco-friendly vessels, including those powered by alternative fuels, and to embed sustainable operational practices throughout the value chain. The market is projected to experience a dynamic Compound Annual Growth Rate (CAGR) of approximately 6-8% from 2025 to 2033, fueled by the sustained growth in global trade volumes and an escalating demand for highly specialized vessels tailored to specific cargo needs. Furthermore, the penetration of digital technologies within the leasing landscape is anticipated to reach around 75% by 2033, signifying a paradigm shift in operational methodologies. The industry has also seen substantial innovation in financing structures, with a notable rise in the utilization of securitization and the emergence of diverse alternative financing models, providing greater flexibility and accessibility for market participants.
Leading Regions, Countries, or Segments in Ship Leasing Market
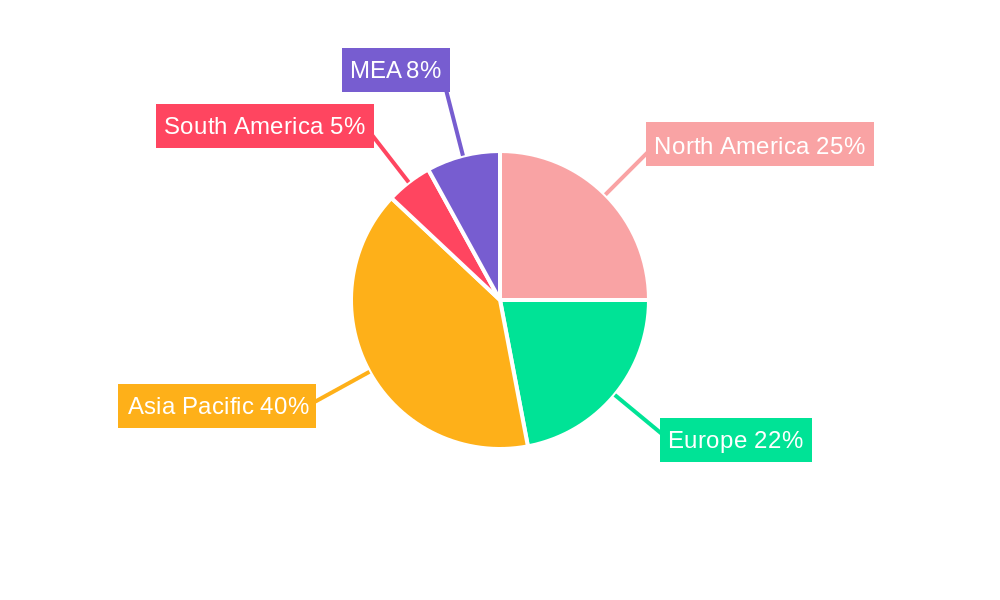
The Asia-Pacific region is projected to dominate the ship leasing market through 2033, driven by robust economic growth and a burgeoning maritime sector. Within this region, China and Singapore are key players.
Key Drivers for Asia-Pacific Dominance:
- High economic growth: fueling demand for shipping and logistics.
- Government support: for infrastructure development and maritime industries.
- Growing trade volumes: requiring increased shipping capacity.
Segment Analysis:
- Lease Type: Financial leases hold the largest market share, driven by their long-term nature and flexibility.
- Application: Container ships remain the dominant segment, due to the high volume of containerized goods.
- Type: Bareboat charters are preferred for long-term contracts due to operational flexibility.
Country-Specific Analysis:
- China: Strong government support for maritime industries and shipbuilding.
- Singapore: Established hub for shipping and logistics, offering efficient infrastructure and regulatory frameworks.
Ship Leasing Market Product Innovations
Recent innovations focus on smart ship technologies, enhancing operational efficiency through remote monitoring and predictive maintenance. These innovations allow for optimized fuel consumption, reduced downtime, and improved safety. The development of specialized leasing solutions tailored to specific vessel types and operational requirements is also gaining traction. These solutions offer greater flexibility and risk mitigation for both lessors and lessees, contributing to a more dynamic market.
Propelling Factors for Ship Leasing Market Growth
The sustained growth of the ship leasing market is underpinned by a confluence of powerful drivers. Foremost among these are the transformative technological advancements, particularly the widespread implementation of the Internet of Things (IoT) for enhanced data collection and analysis, and Artificial Intelligence (AI) for predictive maintenance, performance optimization, and intelligent decision-making. These technologies are instrumental in boosting overall efficiency and significantly reducing operational costs. Concurrently, the persistent expansion of global trade, coupled with a burgeoning demand for specialized vessels designed for diverse cargo types and logistical challenges, directly fuels the need for agile and adaptable leasing solutions. Moreover, increasingly favorable regulatory environments in key maritime regions are providing a supportive backdrop for market expansion, encouraging investment and innovation.
Obstacles in the Ship Leasing Market Market
Despite its growth trajectory, the ship leasing market is not without its hurdles. Significant challenges include the inherent volatility of fuel prices, which directly impacts operational expenditures and complicates long-term contract negotiations. Geopolitical instability and escalating trade tensions can create significant disruptions to established global shipping routes, leading to unpredictable shifts in demand and supply dynamics. The highly competitive landscape among numerous leasing companies, alongside the intrinsically cyclical nature of the broader shipping industry, introduces considerable volatility and necessitates strategic risk management for all stakeholders.
Future Opportunities in Ship Leasing Market
The horizon for the ship leasing market is illuminated by a spectrum of promising opportunities. A key area of growth lies in the burgeoning demand for environmentally friendly vessels. This includes a significant push towards vessels powered by LNG and other emerging alternative fuels, as well as those incorporating advanced energy-saving technologies. The accelerating adoption of digital technologies presents fertile ground for developing innovative leasing solutions, enabling dynamic contract structures, enhanced transparency, and more sophisticated risk management frameworks. Furthermore, strategic expansion into new and emerging markets, particularly in rapidly developing economies with growing trade infrastructures, offers substantial untapped potential for significant growth and market penetration.
Major Players in the Ship Leasing Market Ecosystem
- ICBC Co Ltd
- CMB Financial Leasing CO LTD
- Hamburg Commercial Bank AG
- Minsheng Financial Leasing Co Ltd
- First Ship Lease Trust
- MUFG Bank Ltd
- Bothra Group
- Bank of Communications Financial Leasing Co Ltd
- Galbraiths Ltd
- A P Møller - Mærsk A/S
- Global Ship Lease Inc
Key Developments in Ship Leasing Market Industry
- 2024 Q4: Intensified adoption of advanced digital fleet management solutions by leading industry players, enhancing operational visibility and control.
- 2023 Q3: A prominent leasing company launched an ambitious new green shipping initiative, emphasizing the industry's commitment to sustainability.
- 2022 Q2: A strategic merger between two mid-sized ship leasing companies created a larger entity with expanded capabilities and market reach.
- Ongoing: Increased focus on financing sustainable vessels and exploring partnerships for the development of next-generation maritime technologies.
- Anticipated: Greater integration of blockchain technology for enhanced transparency and security in leasing contracts and asset tracking.
Strategic Ship Leasing Market Market Forecast
The ship leasing market is poised for sustained growth in the forecast period (2025-2033), driven by technological advancements, increasing trade volumes, and the adoption of sustainable practices. Opportunities exist in emerging markets and specialized vessel segments. The market is projected to reach xx Million by 2033, demonstrating significant potential for investors and industry players.
Ship Leasing Market Segmentation
-
1. Lease Type
- 1.1. Financial Lease
- 1.2. Full-Service Lease
-
2. Application
- 2.1. Container Ships
- 2.2. Bulk Carriers
-
3. Type
- 3.1. Real-Time Lease
- 3.2. Periodic Tenancy
- 3.3. Bareboat Charter
- 3.4. Other Types
Ship Leasing Market Segmentation By Geography
-
1. North America
- 1.1. United States
- 1.2. Canada
-
2. Europe
- 2.1. United Kingdom
- 2.2. France
- 2.3. Germany
- 2.4. Rest of Europe
-
3. Asia Pacific
- 3.1. China
- 3.2. India
- 3.3. Japan
- 3.4. South Korea
- 3.5. Rest of Asia Pacific
-
4. Latin America
- 4.1. Brazil
- 4.2. Rest of Latin America
-
5. Middle East and Africa
- 5.1. United Arab Emirates
- 5.2. Saudi Arabia
- 5.3. South Africa
- 5.4. Rest of Middle East and Africa
Ship Leasing Market Regional Market Share
Geographic Coverage of Ship Leasing Market
Ship Leasing Market REPORT HIGHLIGHTS
| Aspects | Details |
|---|---|
| Study Period | 2020-2034 |
| Base Year | 2025 |
| Estimated Year | 2026 |
| Forecast Period | 2026-2034 |
| Historical Period | 2020-2025 |
| Growth Rate | CAGR of 12% from 2020-2034 |
| Segmentation |
|
Table of Contents
- 1. Introduction
- 1.1. Research Scope
- 1.2. Market Segmentation
- 1.3. Research Objective
- 1.4. Definitions and Assumptions
- 2. Executive Summary
- 2.1. Market Snapshot
- 3. Market Dynamics
- 3.1. Market Drivers
- 3.2. Market Restrains
- 3.3. Market Trends
- 3.4. Market Opportunities
- 4. Market Factor Analysis
- 4.1. Porters Five Forces
- 4.1.1. Bargaining Power of Suppliers
- 4.1.2. Bargaining Power of Buyers
- 4.1.3. Threat of New Entrants
- 4.1.4. Threat of Substitutes
- 4.1.5. Competitive Rivalry
- 4.2. PESTEL analysis
- 4.3. BCG Analysis
- 4.3.1. Stars (High Growth, High Market Share)
- 4.3.2. Cash Cows (Low Growth, High Market Share)
- 4.3.3. Question Mark (High Growth, Low Market Share)
- 4.3.4. Dogs (Low Growth, Low Market Share)
- 4.4. Ansoff Matrix Analysis
- 4.5. Supply Chain Analysis
- 4.6. Regulatory Landscape
- 4.7. Current Market Potential and Opportunity Assessment (TAM–SAM–SOM Framework)
- 4.8. DMV Analyst Note
- 4.1. Porters Five Forces
- 5. Market Analysis, Insights and Forecast 2021-2033
- 5.1. Market Analysis, Insights and Forecast - by Lease Type
- 5.1.1. Financial Lease
- 5.1.2. Full-Service Lease
- 5.2. Market Analysis, Insights and Forecast - by Application
- 5.2.1. Container Ships
- 5.2.2. Bulk Carriers
- 5.3. Market Analysis, Insights and Forecast - by Type
- 5.3.1. Real-Time Lease
- 5.3.2. Periodic Tenancy
- 5.3.3. Bareboat Charter
- 5.3.4. Other Types
- 5.4. Market Analysis, Insights and Forecast - by Region
- 5.4.1. North America
- 5.4.2. Europe
- 5.4.3. Asia Pacific
- 5.4.4. Latin America
- 5.4.5. Middle East and Africa
- 5.1. Market Analysis, Insights and Forecast - by Lease Type
- 6. Global Ship Leasing Market Analysis, Insights and Forecast, 2021-2033
- 6.1. Market Analysis, Insights and Forecast - by Lease Type
- 6.1.1. Financial Lease
- 6.1.2. Full-Service Lease
- 6.2. Market Analysis, Insights and Forecast - by Application
- 6.2.1. Container Ships
- 6.2.2. Bulk Carriers
- 6.3. Market Analysis, Insights and Forecast - by Type
- 6.3.1. Real-Time Lease
- 6.3.2. Periodic Tenancy
- 6.3.3. Bareboat Charter
- 6.3.4. Other Types
- 6.1. Market Analysis, Insights and Forecast - by Lease Type
- 7. North America Ship Leasing Market Analysis, Insights and Forecast, 2020-2032
- 7.1. Market Analysis, Insights and Forecast - by Lease Type
- 7.1.1. Financial Lease
- 7.1.2. Full-Service Lease
- 7.2. Market Analysis, Insights and Forecast - by Application
- 7.2.1. Container Ships
- 7.2.2. Bulk Carriers
- 7.3. Market Analysis, Insights and Forecast - by Type
- 7.3.1. Real-Time Lease
- 7.3.2. Periodic Tenancy
- 7.3.3. Bareboat Charter
- 7.3.4. Other Types
- 7.1. Market Analysis, Insights and Forecast - by Lease Type
- 8. Europe Ship Leasing Market Analysis, Insights and Forecast, 2020-2032
- 8.1. Market Analysis, Insights and Forecast - by Lease Type
- 8.1.1. Financial Lease
- 8.1.2. Full-Service Lease
- 8.2. Market Analysis, Insights and Forecast - by Application
- 8.2.1. Container Ships
- 8.2.2. Bulk Carriers
- 8.3. Market Analysis, Insights and Forecast - by Type
- 8.3.1. Real-Time Lease
- 8.3.2. Periodic Tenancy
- 8.3.3. Bareboat Charter
- 8.3.4. Other Types
- 8.1. Market Analysis, Insights and Forecast - by Lease Type
- 9. Asia Pacific Ship Leasing Market Analysis, Insights and Forecast, 2020-2032
- 9.1. Market Analysis, Insights and Forecast - by Lease Type
- 9.1.1. Financial Lease
- 9.1.2. Full-Service Lease
- 9.2. Market Analysis, Insights and Forecast - by Application
- 9.2.1. Container Ships
- 9.2.2. Bulk Carriers
- 9.3. Market Analysis, Insights and Forecast - by Type
- 9.3.1. Real-Time Lease
- 9.3.2. Periodic Tenancy
- 9.3.3. Bareboat Charter
- 9.3.4. Other Types
- 9.1. Market Analysis, Insights and Forecast - by Lease Type
- 10. Latin America Ship Leasing Market Analysis, Insights and Forecast, 2020-2032
- 10.1. Market Analysis, Insights and Forecast - by Lease Type
- 10.1.1. Financial Lease
- 10.1.2. Full-Service Lease
- 10.2. Market Analysis, Insights and Forecast - by Application
- 10.2.1. Container Ships
- 10.2.2. Bulk Carriers
- 10.3. Market Analysis, Insights and Forecast - by Type
- 10.3.1. Real-Time Lease
- 10.3.2. Periodic Tenancy
- 10.3.3. Bareboat Charter
- 10.3.4. Other Types
- 10.1. Market Analysis, Insights and Forecast - by Lease Type
- 11. Middle East and Africa Ship Leasing Market Analysis, Insights and Forecast, 2020-2032
- 11.1. Market Analysis, Insights and Forecast - by Lease Type
- 11.1.1. Financial Lease
- 11.1.2. Full-Service Lease
- 11.2. Market Analysis, Insights and Forecast - by Application
- 11.2.1. Container Ships
- 11.2.2. Bulk Carriers
- 11.3. Market Analysis, Insights and Forecast - by Type
- 11.3.1. Real-Time Lease
- 11.3.2. Periodic Tenancy
- 11.3.3. Bareboat Charter
- 11.3.4. Other Types
- 11.1. Market Analysis, Insights and Forecast - by Lease Type
- 12. Competitive Analysis
- 12.1. Company Profiles
- 12.1.1 ICBC Co Ltd
- 12.1.1.1. Company Overview
- 12.1.1.2. Products
- 12.1.1.3. Company Financials
- 12.1.1.4. SWOT Analysis
- 12.1.2 CMB Financial Leasing CO LTD
- 12.1.2.1. Company Overview
- 12.1.2.2. Products
- 12.1.2.3. Company Financials
- 12.1.2.4. SWOT Analysis
- 12.1.3 Hamburg Commercial Bank AG
- 12.1.3.1. Company Overview
- 12.1.3.2. Products
- 12.1.3.3. Company Financials
- 12.1.3.4. SWOT Analysis
- 12.1.4 Minsheng Financial Leasing Co Ltd
- 12.1.4.1. Company Overview
- 12.1.4.2. Products
- 12.1.4.3. Company Financials
- 12.1.4.4. SWOT Analysis
- 12.1.5 First Ship Lease Trust
- 12.1.5.1. Company Overview
- 12.1.5.2. Products
- 12.1.5.3. Company Financials
- 12.1.5.4. SWOT Analysis
- 12.1.6 MUFG Bank Ltd
- 12.1.6.1. Company Overview
- 12.1.6.2. Products
- 12.1.6.3. Company Financials
- 12.1.6.4. SWOT Analysis
- 12.1.7 Bothra Group
- 12.1.7.1. Company Overview
- 12.1.7.2. Products
- 12.1.7.3. Company Financials
- 12.1.7.4. SWOT Analysis
- 12.1.8 Bank of Communications Financial Leasing Co Ltd
- 12.1.8.1. Company Overview
- 12.1.8.2. Products
- 12.1.8.3. Company Financials
- 12.1.8.4. SWOT Analysis
- 12.1.9 Galbraiths Ltd
- 12.1.9.1. Company Overview
- 12.1.9.2. Products
- 12.1.9.3. Company Financials
- 12.1.9.4. SWOT Analysis
- 12.1.10 A P Møller - Mærsk A/S
- 12.1.10.1. Company Overview
- 12.1.10.2. Products
- 12.1.10.3. Company Financials
- 12.1.10.4. SWOT Analysis
- 12.1.11 Global Ship Lease Inc
- 12.1.11.1. Company Overview
- 12.1.11.2. Products
- 12.1.11.3. Company Financials
- 12.1.11.4. SWOT Analysis
- 12.1.1 ICBC Co Ltd
- 12.2. Market Entropy
- 12.2.1 Company's Key Areas Served
- 12.2.2 Recent Developments
- 12.3. Company Market Share Analysis 2025
- 12.3.1 Top 5 Companies Market Share Analysis
- 12.3.2 Top 3 Companies Market Share Analysis
- 12.4. List of Potential Customers
- 13. Research Methodology
List of Figures
- Figure 1: Global Ship Leasing Market Revenue Breakdown (billion, %) by Region 2025 & 2033
- Figure 2: North America Ship Leasing Market Revenue (billion), by Lease Type 2025 & 2033
- Figure 3: North America Ship Leasing Market Revenue Share (%), by Lease Type 2025 & 2033
- Figure 4: North America Ship Leasing Market Revenue (billion), by Application 2025 & 2033
- Figure 5: North America Ship Leasing Market Revenue Share (%), by Application 2025 & 2033
- Figure 6: North America Ship Leasing Market Revenue (billion), by Type 2025 & 2033
- Figure 7: North America Ship Leasing Market Revenue Share (%), by Type 2025 & 2033
- Figure 8: North America Ship Leasing Market Revenue (billion), by Country 2025 & 2033
- Figure 9: North America Ship Leasing Market Revenue Share (%), by Country 2025 & 2033
- Figure 10: Europe Ship Leasing Market Revenue (billion), by Lease Type 2025 & 2033
- Figure 11: Europe Ship Leasing Market Revenue Share (%), by Lease Type 2025 & 2033
- Figure 12: Europe Ship Leasing Market Revenue (billion), by Application 2025 & 2033
- Figure 13: Europe Ship Leasing Market Revenue Share (%), by Application 2025 & 2033
- Figure 14: Europe Ship Leasing Market Revenue (billion), by Type 2025 & 2033
- Figure 15: Europe Ship Leasing Market Revenue Share (%), by Type 2025 & 2033
- Figure 16: Europe Ship Leasing Market Revenue (billion), by Country 2025 & 2033
- Figure 17: Europe Ship Leasing Market Revenue Share (%), by Country 2025 & 2033
- Figure 18: Asia Pacific Ship Leasing Market Revenue (billion), by Lease Type 2025 & 2033
- Figure 19: Asia Pacific Ship Leasing Market Revenue Share (%), by Lease Type 2025 & 2033
- Figure 20: Asia Pacific Ship Leasing Market Revenue (billion), by Application 2025 & 2033
- Figure 21: Asia Pacific Ship Leasing Market Revenue Share (%), by Application 2025 & 2033
- Figure 22: Asia Pacific Ship Leasing Market Revenue (billion), by Type 2025 & 2033
- Figure 23: Asia Pacific Ship Leasing Market Revenue Share (%), by Type 2025 & 2033
- Figure 24: Asia Pacific Ship Leasing Market Revenue (billion), by Country 2025 & 2033
- Figure 25: Asia Pacific Ship Leasing Market Revenue Share (%), by Country 2025 & 2033
- Figure 26: Latin America Ship Leasing Market Revenue (billion), by Lease Type 2025 & 2033
- Figure 27: Latin America Ship Leasing Market Revenue Share (%), by Lease Type 2025 & 2033
- Figure 28: Latin America Ship Leasing Market Revenue (billion), by Application 2025 & 2033
- Figure 29: Latin America Ship Leasing Market Revenue Share (%), by Application 2025 & 2033
- Figure 30: Latin America Ship Leasing Market Revenue (billion), by Type 2025 & 2033
- Figure 31: Latin America Ship Leasing Market Revenue Share (%), by Type 2025 & 2033
- Figure 32: Latin America Ship Leasing Market Revenue (billion), by Country 2025 & 2033
- Figure 33: Latin America Ship Leasing Market Revenue Share (%), by Country 2025 & 2033
- Figure 34: Middle East and Africa Ship Leasing Market Revenue (billion), by Lease Type 2025 & 2033
- Figure 35: Middle East and Africa Ship Leasing Market Revenue Share (%), by Lease Type 2025 & 2033
- Figure 36: Middle East and Africa Ship Leasing Market Revenue (billion), by Application 2025 & 2033
- Figure 37: Middle East and Africa Ship Leasing Market Revenue Share (%), by Application 2025 & 2033
- Figure 38: Middle East and Africa Ship Leasing Market Revenue (billion), by Type 2025 & 2033
- Figure 39: Middle East and Africa Ship Leasing Market Revenue Share (%), by Type 2025 & 2033
- Figure 40: Middle East and Africa Ship Leasing Market Revenue (billion), by Country 2025 & 2033
- Figure 41: Middle East and Africa Ship Leasing Market Revenue Share (%), by Country 2025 & 2033
List of Tables
- Table 1: Global Ship Leasing Market Revenue billion Forecast, by Lease Type 2020 & 2033
- Table 2: Global Ship Leasing Market Revenue billion Forecast, by Application 2020 & 2033
- Table 3: Global Ship Leasing Market Revenue billion Forecast, by Type 2020 & 2033
- Table 4: Global Ship Leasing Market Revenue billion Forecast, by Region 2020 & 2033
- Table 5: Global Ship Leasing Market Revenue billion Forecast, by Lease Type 2020 & 2033
- Table 6: Global Ship Leasing Market Revenue billion Forecast, by Application 2020 & 2033
- Table 7: Global Ship Leasing Market Revenue billion Forecast, by Type 2020 & 2033
- Table 8: Global Ship Leasing Market Revenue billion Forecast, by Country 2020 & 2033
- Table 9: United States Ship Leasing Market Revenue (billion) Forecast, by Application 2020 & 2033
- Table 10: Canada Ship Leasing Market Revenue (billion) Forecast, by Application 2020 & 2033
- Table 11: Global Ship Leasing Market Revenue billion Forecast, by Lease Type 2020 & 2033
- Table 12: Global Ship Leasing Market Revenue billion Forecast, by Application 2020 & 2033
- Table 13: Global Ship Leasing Market Revenue billion Forecast, by Type 2020 & 2033
- Table 14: Global Ship Leasing Market Revenue billion Forecast, by Country 2020 & 2033
- Table 15: United Kingdom Ship Leasing Market Revenue (billion) Forecast, by Application 2020 & 2033
- Table 16: France Ship Leasing Market Revenue (billion) Forecast, by Application 2020 & 2033
- Table 17: Germany Ship Leasing Market Revenue (billion) Forecast, by Application 2020 & 2033
- Table 18: Rest of Europe Ship Leasing Market Revenue (billion) Forecast, by Application 2020 & 2033
- Table 19: Global Ship Leasing Market Revenue billion Forecast, by Lease Type 2020 & 2033
- Table 20: Global Ship Leasing Market Revenue billion Forecast, by Application 2020 & 2033
- Table 21: Global Ship Leasing Market Revenue billion Forecast, by Type 2020 & 2033
- Table 22: Global Ship Leasing Market Revenue billion Forecast, by Country 2020 & 2033
- Table 23: China Ship Leasing Market Revenue (billion) Forecast, by Application 2020 & 2033
- Table 24: India Ship Leasing Market Revenue (billion) Forecast, by Application 2020 & 2033
- Table 25: Japan Ship Leasing Market Revenue (billion) Forecast, by Application 2020 & 2033
- Table 26: South Korea Ship Leasing Market Revenue (billion) Forecast, by Application 2020 & 2033
- Table 27: Rest of Asia Pacific Ship Leasing Market Revenue (billion) Forecast, by Application 2020 & 2033
- Table 28: Global Ship Leasing Market Revenue billion Forecast, by Lease Type 2020 & 2033
- Table 29: Global Ship Leasing Market Revenue billion Forecast, by Application 2020 & 2033
- Table 30: Global Ship Leasing Market Revenue billion Forecast, by Type 2020 & 2033
- Table 31: Global Ship Leasing Market Revenue billion Forecast, by Country 2020 & 2033
- Table 32: Brazil Ship Leasing Market Revenue (billion) Forecast, by Application 2020 & 2033
- Table 33: Rest of Latin America Ship Leasing Market Revenue (billion) Forecast, by Application 2020 & 2033
- Table 34: Global Ship Leasing Market Revenue billion Forecast, by Lease Type 2020 & 2033
- Table 35: Global Ship Leasing Market Revenue billion Forecast, by Application 2020 & 2033
- Table 36: Global Ship Leasing Market Revenue billion Forecast, by Type 2020 & 2033
- Table 37: Global Ship Leasing Market Revenue billion Forecast, by Country 2020 & 2033
- Table 38: United Arab Emirates Ship Leasing Market Revenue (billion) Forecast, by Application 2020 & 2033
- Table 39: Saudi Arabia Ship Leasing Market Revenue (billion) Forecast, by Application 2020 & 2033
- Table 40: South Africa Ship Leasing Market Revenue (billion) Forecast, by Application 2020 & 2033
- Table 41: Rest of Middle East and Africa Ship Leasing Market Revenue (billion) Forecast, by Application 2020 & 2033
Frequently Asked Questions
1. What is the projected Compound Annual Growth Rate (CAGR) of the Ship Leasing Market?
The projected CAGR is approximately 12%.
2. Which companies are prominent players in the Ship Leasing Market?
Key companies in the market include ICBC Co Ltd, CMB Financial Leasing CO LTD, Hamburg Commercial Bank AG, Minsheng Financial Leasing Co Ltd, First Ship Lease Trust, MUFG Bank Ltd, Bothra Group, Bank of Communications Financial Leasing Co Ltd, Galbraiths Ltd, A P Møller - Mærsk A/S, Global Ship Lease Inc.
3. What are the main segments of the Ship Leasing Market?
The market segments include Lease Type, Application, Type.
4. Can you provide details about the market size?
The market size is estimated to be USD 15.78 billion as of 2022.
5. What are some drivers contributing to market growth?
N/A
6. What are the notable trends driving market growth?
Bareboat Charter Segment is Expected to Witness Significant Growth During the Forecast Period.
7. Are there any restraints impacting market growth?
N/A
8. Can you provide examples of recent developments in the market?
N/A
9. What pricing options are available for accessing the report?
Pricing options include single-user, multi-user, and enterprise licenses priced at USD 4750, USD 5250, and USD 8750 respectively.
10. Is the market size provided in terms of value or volume?
The market size is provided in terms of value, measured in billion.
11. Are there any specific market keywords associated with the report?
Yes, the market keyword associated with the report is "Ship Leasing Market," which aids in identifying and referencing the specific market segment covered.
12. How do I determine which pricing option suits my needs best?
The pricing options vary based on user requirements and access needs. Individual users may opt for single-user licenses, while businesses requiring broader access may choose multi-user or enterprise licenses for cost-effective access to the report.
13. Are there any additional resources or data provided in the Ship Leasing Market report?
While the report offers comprehensive insights, it's advisable to review the specific contents or supplementary materials provided to ascertain if additional resources or data are available.
14. How can I stay updated on further developments or reports in the Ship Leasing Market?
To stay informed about further developments, trends, and reports in the Ship Leasing Market, consider subscribing to industry newsletters, following relevant companies and organizations, or regularly checking reputable industry news sources and publications.
Methodology
Step 1 - Identification of Relevant Samples Size from Population Database


Step 2 - Approaches for Defining Global Market Size (Value, Volume* & Price*)

Note*: In applicable scenarios
Step 3 - Data Sources
Primary Research
- Web Analytics
- Survey Reports
- Research Institute
- Latest Research Reports
- Opinion Leaders
Secondary Research
- Annual Reports
- White Paper
- Latest Press Release
- Industry Association
- Paid Database
- Investor Presentations

Step 4 - Data Triangulation
Involves using different sources of information in order to increase the validity of a study
These sources are likely to be stakeholders in a program - participants, other researchers, program staff, other community members, and so on.
Then we put all data in single framework & apply various statistical tools to find out the dynamic on the market.
During the analysis stage, feedback from the stakeholder groups would be compared to determine areas of agreement as well as areas of divergence