

Key Insights
The Scandinavian commercial property market, including Denmark, Norway, and Sweden, offers a robust investment environment with projected growth. Key drivers include strong economies, increasing urbanization in cities such as Oslo, Stockholm, and Copenhagen, and a thriving tech sector boosting demand for office and logistics spaces. The market is expected to achieve a Compound Annual Growth Rate (CAGR) of 7.41%. Major segments comprise offices, retail, industrial, and logistics properties. While the hospitality sector has seen recent volatility, a recovery is anticipated. Multi-family housing remains a key area due to rising urban populations and rental demand. Leading stakeholders include Citycon, BPT Group, Jeudan A/S, Vasakronan AB, Cushman & Wakefield, and NREP (Logicenters), alongside numerous smaller developers and real estate firms. Intense competition in prime urban locations fuels market innovation.
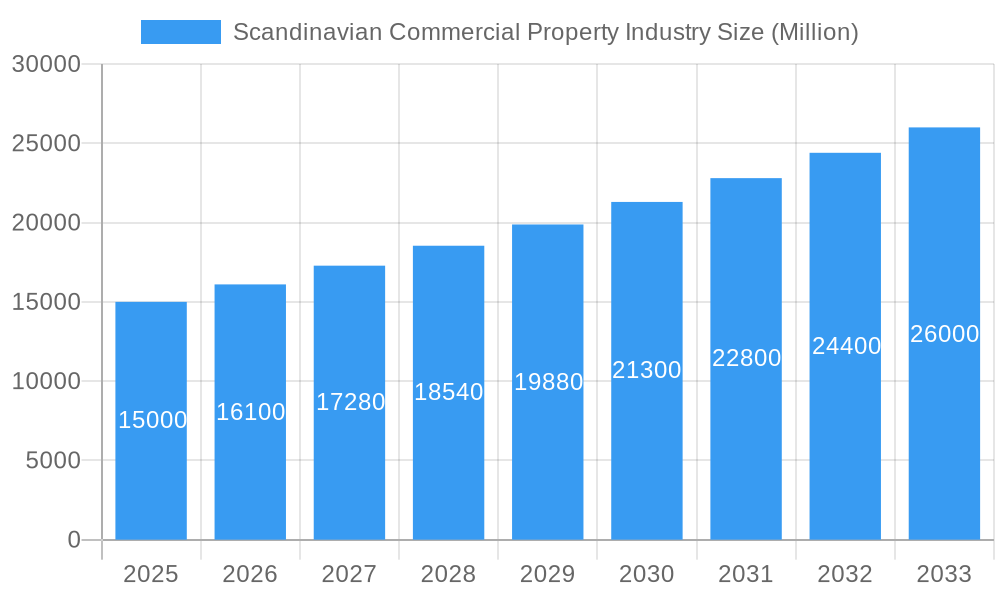
Scandinavian Commercial Property Industry Market Size (In Million)
The forecast period from 2025 to 2033 indicates continued expansion, potentially at a more measured rate. Market dynamics will be influenced by interest rate shifts, geopolitical events, and economic outlooks. Nevertheless, strong demographics, economic stability, and sustained demand for modern, sustainable commercial properties are expected to underpin growth. A significant trend is the increasing emphasis on ESG factors, driving the development of energy-efficient and environmentally conscious buildings. This focus will shape future market trends, necessitating a strategic approach to diversification and sustainability for enduring success in the Scandinavian commercial property market. The estimated market size is 234.9 million by the base year 2025.
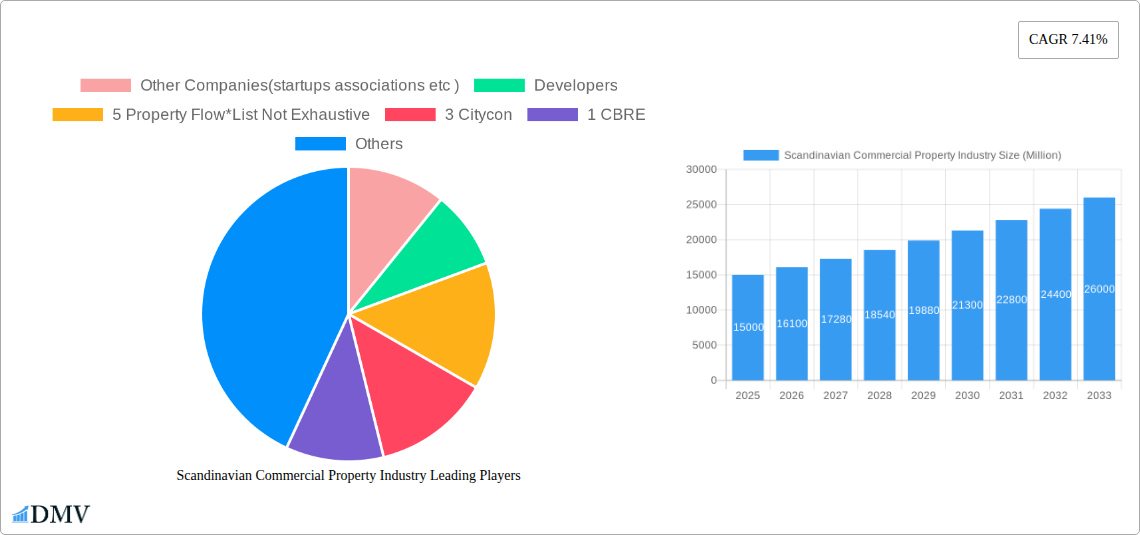
Scandinavian Commercial Property Industry Company Market Share
Scandinavian Commercial Property Industry: 2019-2033 Market Report
This comprehensive report provides an in-depth analysis of the Scandinavian commercial property market from 2019 to 2033, offering invaluable insights for investors, developers, and industry stakeholders. With a focus on Denmark, Norway, and Sweden, and key cities like Oslo, Stockholm, and Copenhagen, this report dissects market trends, leading players, and future opportunities across various segments, including offices, retail, industrial, logistics, multi-family, and hospitality. The report utilizes a base year of 2025, with estimations for 2025 and forecasts spanning 2025-2033, building upon historical data from 2019-2024. Expected market value estimations are presented in Millions.
Scandinavian Commercial Property Industry Market Composition & Trends
This section evaluates the Scandinavian commercial property market's competitive landscape, identifying key trends and drivers impacting market dynamics. We analyze market concentration, highlighting the dominance of major players and the presence of smaller, more agile companies. We delve into innovative technologies reshaping the sector, such as PropTech solutions impacting property management and tenant experiences. The regulatory landscape, including zoning regulations and environmental policies, is examined to understand their effect on market activity. Substitute products and their market penetration are also addressed, alongside the identification of end-user profiles (e.g., large corporations, SMEs, individuals). Finally, we analyze mergers and acquisitions (M&A) activities, including deal values and the rationale behind key transactions. The total market size in 2025 is estimated at xx Million.
- Market Share Distribution: CBRE and Cushman & Wakefield hold significant market share in agency services, while NREP (Logicenters) and BPT Group dominate in development. xx Million market share controlled by the top 5 developers.
- M&A Deal Values: Total M&A deal value for the period 2019-2024 was approximately xx Million, with an average deal size of xx Million. A notable increase is expected in the forecast period.
- Innovation Catalysts: PropTech investment and the adoption of sustainable building practices are key innovation drivers.
- Regulatory Landscape: Stringent environmental regulations are influencing the demand for green buildings.
Scandinavian Commercial Property Industry Industry Evolution
This section provides a detailed analysis of the evolutionary trajectory of the Scandinavian commercial property market, covering market growth trajectories, technological advancements, and evolving consumer demands throughout the study period (2019-2033). The impact of macroeconomic factors, including economic cycles and interest rate fluctuations, on investment decisions is examined. The adoption of new technologies (e.g., smart building technologies, data analytics) and their impact on efficiency and property value is meticulously assessed. Analysis includes shifts in consumer preferences (e.g., demand for flexible workspaces, green buildings) and their consequences for the market. Specific data points, such as compound annual growth rates (CAGR) for different segments and the adoption rates of key technologies, are provided. For the period 2019-2024, the market experienced a CAGR of xx%, with projected growth of xx% CAGR during 2025-2033.
Leading Regions, Countries, or Segments in Scandinavian Commercial Property Industry
This section identifies the leading regions, countries, and segments within the Scandinavian commercial property market. It provides a detailed analysis of the factors driving dominance within each category. The analysis includes investment trends, governmental support, and macroeconomic conditions.
- Leading Country: Sweden, driven by strong economic growth and a vibrant tech sector.
- Leading City: Stockholm, benefiting from a high concentration of multinational companies and a robust tech industry.
- Leading Segment: The office sector currently leads, although the industrial/logistics segment is experiencing rapid growth.
Key Drivers:
- Investment Trends: Significant foreign direct investment (FDI) is flowing into the Scandinavian commercial property market.
- Regulatory Support: Government initiatives promoting sustainable development are boosting the green building sector.
- Economic Growth: Strong economic performance in the region is driving demand for commercial properties.
Scandinavian Commercial Property Industry Product Innovations
Recent years have witnessed significant product innovations in the Scandinavian commercial property sector. These include smart building technologies that optimize energy consumption and enhance tenant experiences, sustainable design and construction materials minimizing environmental impact, and flexible workspace solutions catering to the evolving needs of businesses. These innovations offer enhanced functionality, improved efficiency, and increased sustainability, ultimately leading to higher property values and attracting a wider range of tenants.
Propelling Factors for Scandinavian Commercial Property Industry Growth
Several key factors are driving growth within the Scandinavian commercial property market. Technological advancements, such as PropTech solutions and smart building technology, are increasing efficiency and property value. Strong economic growth across Scandinavia fuels increased demand for commercial space. Supportive government policies, particularly those focused on sustainability and urban development, encourage investment and innovation.
Obstacles in the Scandinavian Commercial Property Industry Market
Despite significant opportunities, challenges exist within the Scandinavian commercial property market. Regulatory hurdles, such as complex permitting processes, can hinder development projects. Supply chain disruptions resulting from global events can impact construction costs and timelines. Increasing competition among developers and investors, often leading to price pressures, also presents a significant challenge.
Future Opportunities in Scandinavian Commercial Property Industry
The Scandinavian commercial property market presents exciting future opportunities. The increasing demand for sustainable and green buildings creates a significant growth area. The growing popularity of flexible workspace solutions presents further opportunities for developers and investors. Expanding into new markets, such as the life sciences sector, will yield promising returns.
Major Players in the Scandinavian Commercial Property Industry Ecosystem
The Scandinavian commercial property market is characterized by a mix of large international players and smaller, specialized firms. Key players include:
- Other Companies (startups, associations, etc.)
- Developers:
- Property Flow
- Citycon
- BPT Group
- Jeudan A/S
- Vasakronan AB
- Cushman and Wakefield
- NREP (Logicenters)
- Nordkap
- Spotscale
- WEC360
- Stronghold
- Real Estate Agencies:
- CBRE
- Colliers International
- Europages
Key Developments in Scandinavian Commercial Property Industry Industry
- 2022 Q3: Increased investment in sustainable building projects.
- 2023 Q1: Launch of a new PropTech platform streamlining property management.
- 2024 Q2: Merger between two major developers creating a significant market player.
Strategic Scandinavian Commercial Property Industry Market Forecast
The Scandinavian commercial property market is poised for continued growth driven by strong economic fundamentals and the adoption of innovative technologies. Significant opportunities exist in sustainable development, flexible workspaces, and emerging sectors like life sciences. The market is expected to maintain a healthy growth trajectory over the forecast period, presenting attractive prospects for investors and developers.
Scandinavian Commercial Property Industry Segmentation
-
1. Type
- 1.1. Offices
- 1.2. Retail
- 1.3. Industrial
- 1.4. Logistics
- 1.5. Multi-family
- 1.6. Hospitality
-
2. Countries
- 2.1. Denmark
- 2.2. Norway
- 2.3. Sweden
-
3. Key Cities
- 3.1. Oslo
- 3.2. Stockholm
- 3.3. Copenhagen
Scandinavian Commercial Property Industry Segmentation By Geography
-
1. North America
- 1.1. United States
- 1.2. Canada
- 1.3. Mexico
-
2. South America
- 2.1. Brazil
- 2.2. Argentina
- 2.3. Rest of South America
-
3. Europe
- 3.1. United Kingdom
- 3.2. Germany
- 3.3. France
- 3.4. Italy
- 3.5. Spain
- 3.6. Russia
- 3.7. Benelux
- 3.8. Nordics
- 3.9. Rest of Europe
-
4. Middle East & Africa
- 4.1. Turkey
- 4.2. Israel
- 4.3. GCC
- 4.4. North Africa
- 4.5. South Africa
- 4.6. Rest of Middle East & Africa
-
5. Asia Pacific
- 5.1. China
- 5.2. India
- 5.3. Japan
- 5.4. South Korea
- 5.5. ASEAN
- 5.6. Oceania
- 5.7. Rest of Asia Pacific
Scandinavian Commercial Property Industry Regional Market Share
Geographic Coverage of Scandinavian Commercial Property Industry
Scandinavian Commercial Property Industry REPORT HIGHLIGHTS
| Aspects | Details |
|---|---|
| Study Period | 2020-2034 |
| Base Year | 2025 |
| Estimated Year | 2026 |
| Forecast Period | 2026-2034 |
| Historical Period | 2020-2025 |
| Growth Rate | CAGR of 3.75% from 2020-2034 |
| Segmentation |
|
Table of Contents
- 1. Introduction
- 1.1. Research Scope
- 1.2. Market Segmentation
- 1.3. Research Methodology
- 1.4. Definitions and Assumptions
- 2. Executive Summary
- 2.1. Introduction
- 3. Market Dynamics
- 3.1. Introduction
- 3.2. Market Drivers
- 3.2.1. Overall economic growth driving the market; The growth of business and industries driving the market
- 3.3. Market Restrains
- 3.3.1. Fluctuating economic conditions hindering the growth of the market; Difficulty in landownership and leasing rights affecting the market
- 3.4. Market Trends
- 3.4.1. Increase in Transaction Volume in the Office Market of Scandinavian Countries
- 4. Market Factor Analysis
- 4.1. Porters Five Forces
- 4.2. Supply/Value Chain
- 4.3. PESTEL analysis
- 4.4. Market Entropy
- 4.5. Patent/Trademark Analysis
- 5. Global Scandinavian Commercial Property Industry Analysis, Insights and Forecast, 2020-2032
- 5.1. Market Analysis, Insights and Forecast - by Type
- 5.1.1. Offices
- 5.1.2. Retail
- 5.1.3. Industrial
- 5.1.4. Logistics
- 5.1.5. Multi-family
- 5.1.6. Hospitality
- 5.2. Market Analysis, Insights and Forecast - by Countries
- 5.2.1. Denmark
- 5.2.2. Norway
- 5.2.3. Sweden
- 5.3. Market Analysis, Insights and Forecast - by Key Cities
- 5.3.1. Oslo
- 5.3.2. Stockholm
- 5.3.3. Copenhagen
- 5.4. Market Analysis, Insights and Forecast - by Region
- 5.4.1. North America
- 5.4.2. South America
- 5.4.3. Europe
- 5.4.4. Middle East & Africa
- 5.4.5. Asia Pacific
- 5.1. Market Analysis, Insights and Forecast - by Type
- 6. North America Scandinavian Commercial Property Industry Analysis, Insights and Forecast, 2020-2032
- 6.1. Market Analysis, Insights and Forecast - by Type
- 6.1.1. Offices
- 6.1.2. Retail
- 6.1.3. Industrial
- 6.1.4. Logistics
- 6.1.5. Multi-family
- 6.1.6. Hospitality
- 6.2. Market Analysis, Insights and Forecast - by Countries
- 6.2.1. Denmark
- 6.2.2. Norway
- 6.2.3. Sweden
- 6.3. Market Analysis, Insights and Forecast - by Key Cities
- 6.3.1. Oslo
- 6.3.2. Stockholm
- 6.3.3. Copenhagen
- 6.1. Market Analysis, Insights and Forecast - by Type
- 7. South America Scandinavian Commercial Property Industry Analysis, Insights and Forecast, 2020-2032
- 7.1. Market Analysis, Insights and Forecast - by Type
- 7.1.1. Offices
- 7.1.2. Retail
- 7.1.3. Industrial
- 7.1.4. Logistics
- 7.1.5. Multi-family
- 7.1.6. Hospitality
- 7.2. Market Analysis, Insights and Forecast - by Countries
- 7.2.1. Denmark
- 7.2.2. Norway
- 7.2.3. Sweden
- 7.3. Market Analysis, Insights and Forecast - by Key Cities
- 7.3.1. Oslo
- 7.3.2. Stockholm
- 7.3.3. Copenhagen
- 7.1. Market Analysis, Insights and Forecast - by Type
- 8. Europe Scandinavian Commercial Property Industry Analysis, Insights and Forecast, 2020-2032
- 8.1. Market Analysis, Insights and Forecast - by Type
- 8.1.1. Offices
- 8.1.2. Retail
- 8.1.3. Industrial
- 8.1.4. Logistics
- 8.1.5. Multi-family
- 8.1.6. Hospitality
- 8.2. Market Analysis, Insights and Forecast - by Countries
- 8.2.1. Denmark
- 8.2.2. Norway
- 8.2.3. Sweden
- 8.3. Market Analysis, Insights and Forecast - by Key Cities
- 8.3.1. Oslo
- 8.3.2. Stockholm
- 8.3.3. Copenhagen
- 8.1. Market Analysis, Insights and Forecast - by Type
- 9. Middle East & Africa Scandinavian Commercial Property Industry Analysis, Insights and Forecast, 2020-2032
- 9.1. Market Analysis, Insights and Forecast - by Type
- 9.1.1. Offices
- 9.1.2. Retail
- 9.1.3. Industrial
- 9.1.4. Logistics
- 9.1.5. Multi-family
- 9.1.6. Hospitality
- 9.2. Market Analysis, Insights and Forecast - by Countries
- 9.2.1. Denmark
- 9.2.2. Norway
- 9.2.3. Sweden
- 9.3. Market Analysis, Insights and Forecast - by Key Cities
- 9.3.1. Oslo
- 9.3.2. Stockholm
- 9.3.3. Copenhagen
- 9.1. Market Analysis, Insights and Forecast - by Type
- 10. Asia Pacific Scandinavian Commercial Property Industry Analysis, Insights and Forecast, 2020-2032
- 10.1. Market Analysis, Insights and Forecast - by Type
- 10.1.1. Offices
- 10.1.2. Retail
- 10.1.3. Industrial
- 10.1.4. Logistics
- 10.1.5. Multi-family
- 10.1.6. Hospitality
- 10.2. Market Analysis, Insights and Forecast - by Countries
- 10.2.1. Denmark
- 10.2.2. Norway
- 10.2.3. Sweden
- 10.3. Market Analysis, Insights and Forecast - by Key Cities
- 10.3.1. Oslo
- 10.3.2. Stockholm
- 10.3.3. Copenhagen
- 10.1. Market Analysis, Insights and Forecast - by Type
- 11. Competitive Analysis
- 11.1. Global Market Share Analysis 2025
- 11.2. Company Profiles
- 11.2.1 Other Companies(startups associations etc )
- 11.2.1.1. Overview
- 11.2.1.2. Products
- 11.2.1.3. SWOT Analysis
- 11.2.1.4. Recent Developments
- 11.2.1.5. Financials (Based on Availability)
- 11.2.2 Developers
- 11.2.2.1. Overview
- 11.2.2.2. Products
- 11.2.2.3. SWOT Analysis
- 11.2.2.4. Recent Developments
- 11.2.2.5. Financials (Based on Availability)
- 11.2.3 5 Property Flow*List Not Exhaustive
- 11.2.3.1. Overview
- 11.2.3.2. Products
- 11.2.3.3. SWOT Analysis
- 11.2.3.4. Recent Developments
- 11.2.3.5. Financials (Based on Availability)
- 11.2.4 3 Citycon
- 11.2.4.1. Overview
- 11.2.4.2. Products
- 11.2.4.3. SWOT Analysis
- 11.2.4.4. Recent Developments
- 11.2.4.5. Financials (Based on Availability)
- 11.2.5 1 CBRE
- 11.2.5.1. Overview
- 11.2.5.2. Products
- 11.2.5.3. SWOT Analysis
- 11.2.5.4. Recent Developments
- 11.2.5.5. Financials (Based on Availability)
- 11.2.6 5 BPT Group
- 11.2.6.1. Overview
- 11.2.6.2. Products
- 11.2.6.3. SWOT Analysis
- 11.2.6.4. Recent Developments
- 11.2.6.5. Financials (Based on Availability)
- 11.2.7 2 Jeudan A/S
- 11.2.7.1. Overview
- 11.2.7.2. Products
- 11.2.7.3. SWOT Analysis
- 11.2.7.4. Recent Developments
- 11.2.7.5. Financials (Based on Availability)
- 11.2.8 1 Vasakronan AB
- 11.2.8.1. Overview
- 11.2.8.2. Products
- 11.2.8.3. SWOT Analysis
- 11.2.8.4. Recent Developments
- 11.2.8.5. Financials (Based on Availability)
- 11.2.9 4 Cushman and wakefield
- 11.2.9.1. Overview
- 11.2.9.2. Products
- 11.2.9.3. SWOT Analysis
- 11.2.9.4. Recent Developments
- 11.2.9.5. Financials (Based on Availability)
- 11.2.10 Real Estate Agencies
- 11.2.10.1. Overview
- 11.2.10.2. Products
- 11.2.10.3. SWOT Analysis
- 11.2.10.4. Recent Developments
- 11.2.10.5. Financials (Based on Availability)
- 11.2.11 3 Colliers international
- 11.2.11.1. Overview
- 11.2.11.2. Products
- 11.2.11.3. SWOT Analysis
- 11.2.11.4. Recent Developments
- 11.2.11.5. Financials (Based on Availability)
- 11.2.12 2 Europages
- 11.2.12.1. Overview
- 11.2.12.2. Products
- 11.2.12.3. SWOT Analysis
- 11.2.12.4. Recent Developments
- 11.2.12.5. Financials (Based on Availability)
- 11.2.13 4 NREP (Logicenters)
- 11.2.13.1. Overview
- 11.2.13.2. Products
- 11.2.13.3. SWOT Analysis
- 11.2.13.4. Recent Developments
- 11.2.13.5. Financials (Based on Availability)
- 11.2.14 2 Nordkap
- 11.2.14.1. Overview
- 11.2.14.2. Products
- 11.2.14.3. SWOT Analysis
- 11.2.14.4. Recent Developments
- 11.2.14.5. Financials (Based on Availability)
- 11.2.15 3 Spotscale
- 11.2.15.1. Overview
- 11.2.15.2. Products
- 11.2.15.3. SWOT Analysis
- 11.2.15.4. Recent Developments
- 11.2.15.5. Financials (Based on Availability)
- 11.2.16 4 WEC360
- 11.2.16.1. Overview
- 11.2.16.2. Products
- 11.2.16.3. SWOT Analysis
- 11.2.16.4. Recent Developments
- 11.2.16.5. Financials (Based on Availability)
- 11.2.17 1 Stronghold
- 11.2.17.1. Overview
- 11.2.17.2. Products
- 11.2.17.3. SWOT Analysis
- 11.2.17.4. Recent Developments
- 11.2.17.5. Financials (Based on Availability)
- 11.2.1 Other Companies(startups associations etc )
List of Figures
- Figure 1: Global Scandinavian Commercial Property Industry Revenue Breakdown (million, %) by Region 2025 & 2033
- Figure 2: North America Scandinavian Commercial Property Industry Revenue (million), by Type 2025 & 2033
- Figure 3: North America Scandinavian Commercial Property Industry Revenue Share (%), by Type 2025 & 2033
- Figure 4: North America Scandinavian Commercial Property Industry Revenue (million), by Countries 2025 & 2033
- Figure 5: North America Scandinavian Commercial Property Industry Revenue Share (%), by Countries 2025 & 2033
- Figure 6: North America Scandinavian Commercial Property Industry Revenue (million), by Key Cities 2025 & 2033
- Figure 7: North America Scandinavian Commercial Property Industry Revenue Share (%), by Key Cities 2025 & 2033
- Figure 8: North America Scandinavian Commercial Property Industry Revenue (million), by Country 2025 & 2033
- Figure 9: North America Scandinavian Commercial Property Industry Revenue Share (%), by Country 2025 & 2033
- Figure 10: South America Scandinavian Commercial Property Industry Revenue (million), by Type 2025 & 2033
- Figure 11: South America Scandinavian Commercial Property Industry Revenue Share (%), by Type 2025 & 2033
- Figure 12: South America Scandinavian Commercial Property Industry Revenue (million), by Countries 2025 & 2033
- Figure 13: South America Scandinavian Commercial Property Industry Revenue Share (%), by Countries 2025 & 2033
- Figure 14: South America Scandinavian Commercial Property Industry Revenue (million), by Key Cities 2025 & 2033
- Figure 15: South America Scandinavian Commercial Property Industry Revenue Share (%), by Key Cities 2025 & 2033
- Figure 16: South America Scandinavian Commercial Property Industry Revenue (million), by Country 2025 & 2033
- Figure 17: South America Scandinavian Commercial Property Industry Revenue Share (%), by Country 2025 & 2033
- Figure 18: Europe Scandinavian Commercial Property Industry Revenue (million), by Type 2025 & 2033
- Figure 19: Europe Scandinavian Commercial Property Industry Revenue Share (%), by Type 2025 & 2033
- Figure 20: Europe Scandinavian Commercial Property Industry Revenue (million), by Countries 2025 & 2033
- Figure 21: Europe Scandinavian Commercial Property Industry Revenue Share (%), by Countries 2025 & 2033
- Figure 22: Europe Scandinavian Commercial Property Industry Revenue (million), by Key Cities 2025 & 2033
- Figure 23: Europe Scandinavian Commercial Property Industry Revenue Share (%), by Key Cities 2025 & 2033
- Figure 24: Europe Scandinavian Commercial Property Industry Revenue (million), by Country 2025 & 2033
- Figure 25: Europe Scandinavian Commercial Property Industry Revenue Share (%), by Country 2025 & 2033
- Figure 26: Middle East & Africa Scandinavian Commercial Property Industry Revenue (million), by Type 2025 & 2033
- Figure 27: Middle East & Africa Scandinavian Commercial Property Industry Revenue Share (%), by Type 2025 & 2033
- Figure 28: Middle East & Africa Scandinavian Commercial Property Industry Revenue (million), by Countries 2025 & 2033
- Figure 29: Middle East & Africa Scandinavian Commercial Property Industry Revenue Share (%), by Countries 2025 & 2033
- Figure 30: Middle East & Africa Scandinavian Commercial Property Industry Revenue (million), by Key Cities 2025 & 2033
- Figure 31: Middle East & Africa Scandinavian Commercial Property Industry Revenue Share (%), by Key Cities 2025 & 2033
- Figure 32: Middle East & Africa Scandinavian Commercial Property Industry Revenue (million), by Country 2025 & 2033
- Figure 33: Middle East & Africa Scandinavian Commercial Property Industry Revenue Share (%), by Country 2025 & 2033
- Figure 34: Asia Pacific Scandinavian Commercial Property Industry Revenue (million), by Type 2025 & 2033
- Figure 35: Asia Pacific Scandinavian Commercial Property Industry Revenue Share (%), by Type 2025 & 2033
- Figure 36: Asia Pacific Scandinavian Commercial Property Industry Revenue (million), by Countries 2025 & 2033
- Figure 37: Asia Pacific Scandinavian Commercial Property Industry Revenue Share (%), by Countries 2025 & 2033
- Figure 38: Asia Pacific Scandinavian Commercial Property Industry Revenue (million), by Key Cities 2025 & 2033
- Figure 39: Asia Pacific Scandinavian Commercial Property Industry Revenue Share (%), by Key Cities 2025 & 2033
- Figure 40: Asia Pacific Scandinavian Commercial Property Industry Revenue (million), by Country 2025 & 2033
- Figure 41: Asia Pacific Scandinavian Commercial Property Industry Revenue Share (%), by Country 2025 & 2033
List of Tables
- Table 1: Global Scandinavian Commercial Property Industry Revenue million Forecast, by Type 2020 & 2033
- Table 2: Global Scandinavian Commercial Property Industry Revenue million Forecast, by Countries 2020 & 2033
- Table 3: Global Scandinavian Commercial Property Industry Revenue million Forecast, by Key Cities 2020 & 2033
- Table 4: Global Scandinavian Commercial Property Industry Revenue million Forecast, by Region 2020 & 2033
- Table 5: Global Scandinavian Commercial Property Industry Revenue million Forecast, by Type 2020 & 2033
- Table 6: Global Scandinavian Commercial Property Industry Revenue million Forecast, by Countries 2020 & 2033
- Table 7: Global Scandinavian Commercial Property Industry Revenue million Forecast, by Key Cities 2020 & 2033
- Table 8: Global Scandinavian Commercial Property Industry Revenue million Forecast, by Country 2020 & 2033
- Table 9: United States Scandinavian Commercial Property Industry Revenue (million) Forecast, by Application 2020 & 2033
- Table 10: Canada Scandinavian Commercial Property Industry Revenue (million) Forecast, by Application 2020 & 2033
- Table 11: Mexico Scandinavian Commercial Property Industry Revenue (million) Forecast, by Application 2020 & 2033
- Table 12: Global Scandinavian Commercial Property Industry Revenue million Forecast, by Type 2020 & 2033
- Table 13: Global Scandinavian Commercial Property Industry Revenue million Forecast, by Countries 2020 & 2033
- Table 14: Global Scandinavian Commercial Property Industry Revenue million Forecast, by Key Cities 2020 & 2033
- Table 15: Global Scandinavian Commercial Property Industry Revenue million Forecast, by Country 2020 & 2033
- Table 16: Brazil Scandinavian Commercial Property Industry Revenue (million) Forecast, by Application 2020 & 2033
- Table 17: Argentina Scandinavian Commercial Property Industry Revenue (million) Forecast, by Application 2020 & 2033
- Table 18: Rest of South America Scandinavian Commercial Property Industry Revenue (million) Forecast, by Application 2020 & 2033
- Table 19: Global Scandinavian Commercial Property Industry Revenue million Forecast, by Type 2020 & 2033
- Table 20: Global Scandinavian Commercial Property Industry Revenue million Forecast, by Countries 2020 & 2033
- Table 21: Global Scandinavian Commercial Property Industry Revenue million Forecast, by Key Cities 2020 & 2033
- Table 22: Global Scandinavian Commercial Property Industry Revenue million Forecast, by Country 2020 & 2033
- Table 23: United Kingdom Scandinavian Commercial Property Industry Revenue (million) Forecast, by Application 2020 & 2033
- Table 24: Germany Scandinavian Commercial Property Industry Revenue (million) Forecast, by Application 2020 & 2033
- Table 25: France Scandinavian Commercial Property Industry Revenue (million) Forecast, by Application 2020 & 2033
- Table 26: Italy Scandinavian Commercial Property Industry Revenue (million) Forecast, by Application 2020 & 2033
- Table 27: Spain Scandinavian Commercial Property Industry Revenue (million) Forecast, by Application 2020 & 2033
- Table 28: Russia Scandinavian Commercial Property Industry Revenue (million) Forecast, by Application 2020 & 2033
- Table 29: Benelux Scandinavian Commercial Property Industry Revenue (million) Forecast, by Application 2020 & 2033
- Table 30: Nordics Scandinavian Commercial Property Industry Revenue (million) Forecast, by Application 2020 & 2033
- Table 31: Rest of Europe Scandinavian Commercial Property Industry Revenue (million) Forecast, by Application 2020 & 2033
- Table 32: Global Scandinavian Commercial Property Industry Revenue million Forecast, by Type 2020 & 2033
- Table 33: Global Scandinavian Commercial Property Industry Revenue million Forecast, by Countries 2020 & 2033
- Table 34: Global Scandinavian Commercial Property Industry Revenue million Forecast, by Key Cities 2020 & 2033
- Table 35: Global Scandinavian Commercial Property Industry Revenue million Forecast, by Country 2020 & 2033
- Table 36: Turkey Scandinavian Commercial Property Industry Revenue (million) Forecast, by Application 2020 & 2033
- Table 37: Israel Scandinavian Commercial Property Industry Revenue (million) Forecast, by Application 2020 & 2033
- Table 38: GCC Scandinavian Commercial Property Industry Revenue (million) Forecast, by Application 2020 & 2033
- Table 39: North Africa Scandinavian Commercial Property Industry Revenue (million) Forecast, by Application 2020 & 2033
- Table 40: South Africa Scandinavian Commercial Property Industry Revenue (million) Forecast, by Application 2020 & 2033
- Table 41: Rest of Middle East & Africa Scandinavian Commercial Property Industry Revenue (million) Forecast, by Application 2020 & 2033
- Table 42: Global Scandinavian Commercial Property Industry Revenue million Forecast, by Type 2020 & 2033
- Table 43: Global Scandinavian Commercial Property Industry Revenue million Forecast, by Countries 2020 & 2033
- Table 44: Global Scandinavian Commercial Property Industry Revenue million Forecast, by Key Cities 2020 & 2033
- Table 45: Global Scandinavian Commercial Property Industry Revenue million Forecast, by Country 2020 & 2033
- Table 46: China Scandinavian Commercial Property Industry Revenue (million) Forecast, by Application 2020 & 2033
- Table 47: India Scandinavian Commercial Property Industry Revenue (million) Forecast, by Application 2020 & 2033
- Table 48: Japan Scandinavian Commercial Property Industry Revenue (million) Forecast, by Application 2020 & 2033
- Table 49: South Korea Scandinavian Commercial Property Industry Revenue (million) Forecast, by Application 2020 & 2033
- Table 50: ASEAN Scandinavian Commercial Property Industry Revenue (million) Forecast, by Application 2020 & 2033
- Table 51: Oceania Scandinavian Commercial Property Industry Revenue (million) Forecast, by Application 2020 & 2033
- Table 52: Rest of Asia Pacific Scandinavian Commercial Property Industry Revenue (million) Forecast, by Application 2020 & 2033
Frequently Asked Questions
1. What is the projected Compound Annual Growth Rate (CAGR) of the Scandinavian Commercial Property Industry?
The projected CAGR is approximately 3.75%.
2. Which companies are prominent players in the Scandinavian Commercial Property Industry?
Key companies in the market include Other Companies(startups associations etc ), Developers, 5 Property Flow*List Not Exhaustive, 3 Citycon, 1 CBRE, 5 BPT Group, 2 Jeudan A/S, 1 Vasakronan AB, 4 Cushman and wakefield, Real Estate Agencies, 3 Colliers international, 2 Europages, 4 NREP (Logicenters), 2 Nordkap, 3 Spotscale, 4 WEC360, 1 Stronghold.
3. What are the main segments of the Scandinavian Commercial Property Industry?
The market segments include Type, Countries, Key Cities.
4. Can you provide details about the market size?
The market size is estimated to be USD 234.9 million as of 2022.
5. What are some drivers contributing to market growth?
Overall economic growth driving the market; The growth of business and industries driving the market.
6. What are the notable trends driving market growth?
Increase in Transaction Volume in the Office Market of Scandinavian Countries.
7. Are there any restraints impacting market growth?
Fluctuating economic conditions hindering the growth of the market; Difficulty in landownership and leasing rights affecting the market.
8. Can you provide examples of recent developments in the market?
N/A
9. What pricing options are available for accessing the report?
Pricing options include single-user, multi-user, and enterprise licenses priced at USD 3800, USD 4500, and USD 5800 respectively.
10. Is the market size provided in terms of value or volume?
The market size is provided in terms of value, measured in million.
11. Are there any specific market keywords associated with the report?
Yes, the market keyword associated with the report is "Scandinavian Commercial Property Industry," which aids in identifying and referencing the specific market segment covered.
12. How do I determine which pricing option suits my needs best?
The pricing options vary based on user requirements and access needs. Individual users may opt for single-user licenses, while businesses requiring broader access may choose multi-user or enterprise licenses for cost-effective access to the report.
13. Are there any additional resources or data provided in the Scandinavian Commercial Property Industry report?
While the report offers comprehensive insights, it's advisable to review the specific contents or supplementary materials provided to ascertain if additional resources or data are available.
14. How can I stay updated on further developments or reports in the Scandinavian Commercial Property Industry?
To stay informed about further developments, trends, and reports in the Scandinavian Commercial Property Industry, consider subscribing to industry newsletters, following relevant companies and organizations, or regularly checking reputable industry news sources and publications.
Methodology
Step 1 - Identification of Relevant Samples Size from Population Database


Step 2 - Approaches for Defining Global Market Size (Value, Volume* & Price*)

Note*: In applicable scenarios
Step 3 - Data Sources
Primary Research
- Web Analytics
- Survey Reports
- Research Institute
- Latest Research Reports
- Opinion Leaders
Secondary Research
- Annual Reports
- White Paper
- Latest Press Release
- Industry Association
- Paid Database
- Investor Presentations

Step 4 - Data Triangulation
Involves using different sources of information in order to increase the validity of a study
These sources are likely to be stakeholders in a program - participants, other researchers, program staff, other community members, and so on.
Then we put all data in single framework & apply various statistical tools to find out the dynamic on the market.
During the analysis stage, feedback from the stakeholder groups would be compared to determine areas of agreement as well as areas of divergence