

Key Insights
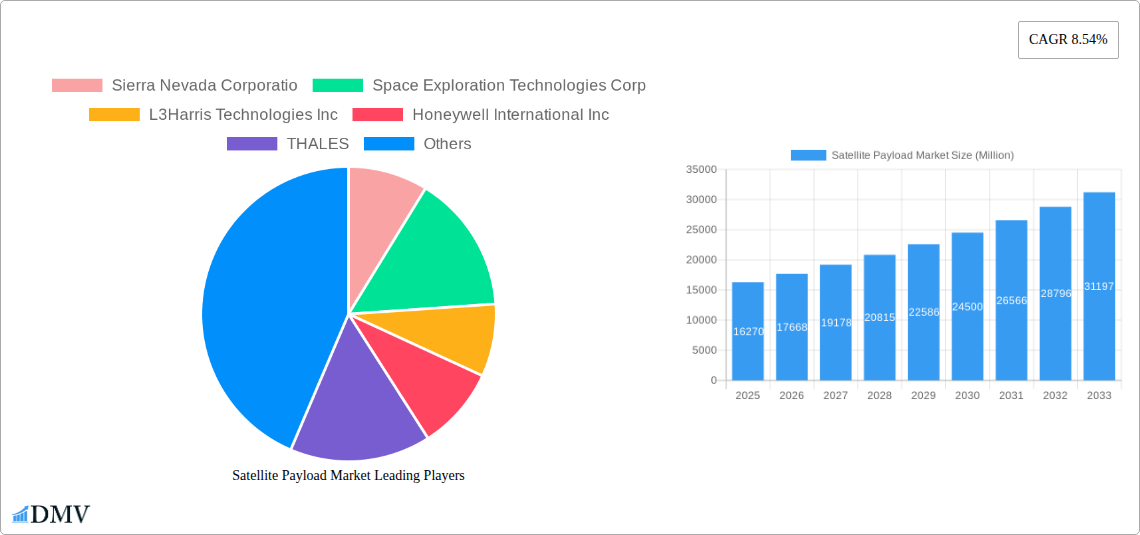
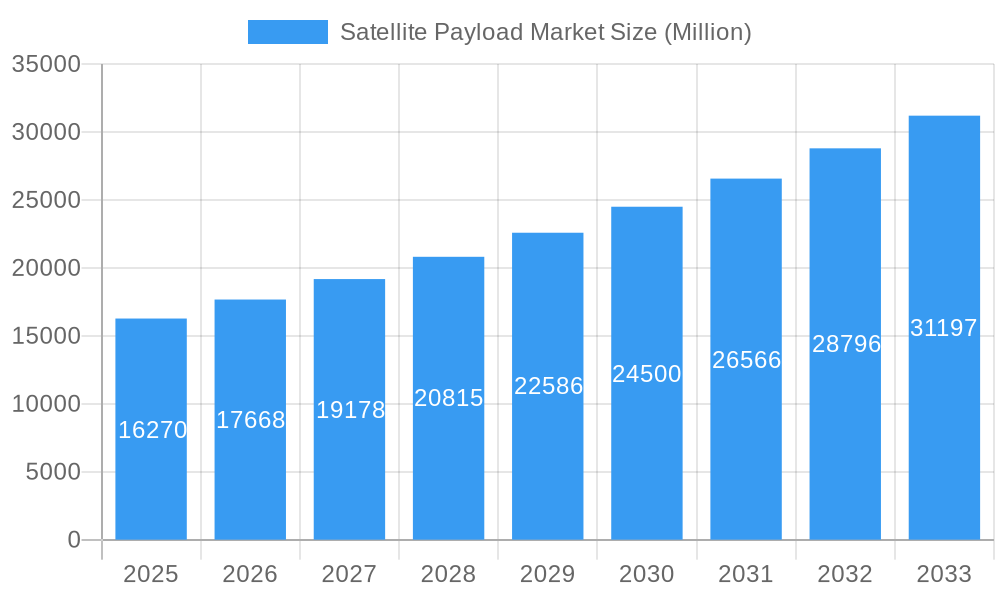
The global satellite payload market, valued at $16.27 billion in 2025, is projected to experience robust growth, driven by escalating demand for advanced communication and Earth observation technologies. The compound annual growth rate (CAGR) of 8.54% from 2025 to 2033 indicates a significant expansion in market size, reaching an estimated $32 billion by 2033. Key drivers include the increasing adoption of satellite-based services across various sectors – from telecommunications and navigation to weather monitoring and scientific research – alongside government investments in national security and space exploration initiatives. The market is segmented by orbit type (GEO, MEO, LEO), end-use (commercial, military), application (weather monitoring, telecommunication, surveillance, scientific research, other), and payload type (communication, navigation, imaging, others). The commercial sector, driven by burgeoning private space companies and increasing demand for high-bandwidth internet connectivity, is anticipated to dominate the market share. Technological advancements, particularly in miniaturization and cost reduction of satellite payloads, are further fueling market expansion. However, challenges remain, including the high initial investment costs associated with satellite development and launch, regulatory hurdles, and the potential for space debris accumulation. The Asia-Pacific region, fueled by significant government investment in space programs and a growing telecommunications industry, shows remarkable potential, alongside sustained growth in North America due to established space infrastructure and technology leadership.
Satellite Payload Market Market Size (In Billion)
The competitive landscape is characterized by a mix of established aerospace giants and emerging space technology companies. Companies like SpaceX, Lockheed Martin, Boeing, and Airbus are leading players, competing based on technological innovation, launch capabilities, and payload offerings. The intense competition fosters innovation and pushes down costs, making satellite technology more accessible. Government agencies, particularly in countries with ambitious space programs, also play a significant role, driving demand for specialized payloads for military and scientific applications. The market is poised for further consolidation as companies seek to expand their capabilities and market reach through partnerships, mergers, and acquisitions. The increasing integration of artificial intelligence and machine learning in satellite payloads enhances data processing and analytical capabilities, opening further growth opportunities. Future growth will hinge on successful advancements in miniaturization, improved launch technologies and sustained government and private investment in space exploration and satellite infrastructure.
Satellite Payload Market Company Market Share
Satellite Payload Market: A Comprehensive Market Report (2019-2033)
This insightful report provides a detailed analysis of the global Satellite Payload Market, offering a comprehensive overview of market dynamics, key players, technological advancements, and future growth prospects. Covering the period from 2019 to 2033, with a base year of 2025 and a forecast period of 2025-2033, this report is an indispensable resource for stakeholders seeking to understand and capitalize on opportunities within this rapidly evolving sector. The market is projected to reach xx Million by 2033, exhibiting a robust Compound Annual Growth Rate (CAGR) of xx% during the forecast period.
Satellite Payload Market Composition & Trends
The Satellite Payload market is characterized by a moderately concentrated landscape, with key players like Lockheed Martin Corporation, The Boeing Company, and Northrop Grumman Corporation holding significant market share. However, the emergence of innovative startups and the increasing adoption of advanced technologies are fostering a more competitive environment. Market share distribution in 2025 is estimated as follows: Lockheed Martin (xx%), Boeing (xx%), Northrop Grumman (xx%), with the remaining share distributed among other prominent players like Airbus SE, RTX Corporation, THALES, Honeywell International Inc, L3Harris Technologies Inc, General Dynamics Corporation, and Sierra Nevada Corporation and ISRO.
- Market Concentration: Moderately concentrated, with top 5 players holding approximately xx% of the market share in 2025.
- Innovation Catalysts: Miniaturization of payloads, advancements in AI and machine learning for data processing, and the rise of NewSpace companies.
- Regulatory Landscape: Stringent regulations related to space debris mitigation and spectrum allocation impact market growth.
- Substitute Products: Limited substitutes exist, but advancements in terrestrial communication technologies pose a potential threat.
- End-User Profiles: Primarily governments (military and civilian) and commercial entities involved in telecommunications, Earth observation, and navigation.
- M&A Activities: Significant M&A activity observed in recent years, with deal values exceeding xx Million in the last five years, driving consolidation within the industry. These activities are driven by the pursuit of technological advancements and expanded market reach.
Satellite Payload Market Industry Evolution
The Satellite Payload market has witnessed significant growth driven by increasing demand for satellite-based services across various sectors. The historical period (2019-2024) saw a CAGR of xx%, primarily fueled by the proliferation of commercial applications such as broadband internet access and Earth observation. Technological advancements, including the development of high-throughput satellites and miniaturized payloads, have further accelerated market growth. The rising adoption of Software Defined Radios (SDRs) and the integration of Artificial Intelligence (AI) and Machine Learning (ML) for improved data analysis and autonomous operations are also contributing significantly. The shift towards constellations of smaller, more agile satellites, rather than relying on a few large satellites, is dramatically reshaping the landscape. This trend is fueled by decreasing launch costs and the ability to rapidly deploy customized solutions for niche applications. Consumer demand is largely influenced by the need for faster, more reliable, and more affordable satellite-based services, particularly in remote areas with limited terrestrial infrastructure. The increasing accessibility of space technology is also making it easier for smaller players to enter the market, thereby fostering greater innovation.
Leading Regions, Countries, or Segments in Satellite Payload Market
The North American region currently holds the largest market share, driven by significant investments in space exploration and robust commercial space activities. However, the Asia-Pacific region is expected to witness the highest growth rate during the forecast period, fueled by substantial government investment in satellite technology and the expansion of telecommunication infrastructure.
- Dominant Region: North America (2025).
- Fastest-Growing Region: Asia-Pacific (2025-2033).
- Dominant Orbit: GEO (Geostationary Orbit) due to its established infrastructure and widespread usage for telecommunications.
- Dominant End-Use: Commercial, driven by high demand for broadband internet and Earth observation services.
- Dominant Application: Telecommunication, driven by the increasing need for global connectivity.
- Dominant Payload Type: Communication payloads, owing to the substantial market share held by telecommunication applications.
Key Drivers for Regional Dominance:
- North America: Strong government support for space programs, robust private sector involvement, and established technological expertise.
- Asia-Pacific: High government spending on space infrastructure development and the expanding telecommunications market.
Satellite Payload Market Product Innovations
Recent innovations focus on increasing payload efficiency, miniaturization, and improved data processing capabilities. Advancements in materials science have led to lighter and more durable payloads, reducing launch costs and extending operational lifespan. The integration of AI and ML algorithms for enhanced image processing, autonomous target acquisition, and sophisticated data analysis represents a significant leap forward in payload capabilities. These innovations enhance performance metrics such as data throughput, resolution, and overall operational efficiency, making satellite payloads more valuable and cost-effective for a wider range of applications. Unique selling propositions include improved signal-to-noise ratios, increased bandwidth capacity, and reduced power consumption.
Propelling Factors for Satellite Payload Market Growth
Several factors drive growth in the Satellite Payload market. Technological advancements, such as miniaturization, improved sensors, and AI-powered data analytics, enhance payload capabilities and reduce costs. The increasing demand for high-speed internet access, particularly in underserved regions, fuels the demand for communication payloads. Government initiatives promoting space exploration and national security applications, along with supportive regulatory frameworks, encourage market expansion. Furthermore, the declining cost of satellite launches makes deploying payloads more economical, further accelerating market growth.
Obstacles in the Satellite Payload Market
Challenges facing the market include stringent regulatory compliance, supply chain disruptions, and intense competition from established players and new entrants. Regulatory hurdles related to spectrum allocation and space debris management can hinder deployment and increase costs. Supply chain vulnerabilities, particularly regarding specialized components and materials, can lead to production delays and cost overruns. Intense competition for contracts, coupled with the high development and deployment costs, creates considerable pressure on profit margins. These challenges, if not mitigated effectively, could impact market growth significantly.
Future Opportunities in Satellite Payload Market
Emerging opportunities lie in the development of next-generation payloads with improved capabilities and reduced costs. The integration of quantum technologies into satellite communication systems holds the promise of enhanced security and speed. Increased demand for Earth observation data for climate change monitoring and precision agriculture will drive growth in imaging payloads. The expansion into new markets, such as the Internet of Things (IoT) and space-based services for disaster management, creates potential for significant market expansion.
Major Players in the Satellite Payload Market Ecosystem
- Sierra Nevada Corporation
- Space Exploration Technologies Corp
- L3Harris Technologies Inc
- Honeywell International Inc
- THALES
- General Dynamics Corporation
- Lockheed Martin Corporation
- Airbus SE
- RTX Corporation
- ISRO
- Northrop Grumman Corporation
- The Boeing Company
Key Developments in Satellite Payload Market Industry
- 2023-Q3: Lockheed Martin announced a new generation of high-throughput communication payloads.
- 2022-Q4: SpaceX successfully launched a constellation of small satellites carrying advanced imaging payloads.
- 2021-Q2: Airbus SE acquired a smaller payload manufacturer, expanding its product portfolio.
- [Add further key developments with year/month and description of their impact]
Strategic Satellite Payload Market Forecast
The Satellite Payload market is poised for continued growth, driven by technological advancements, increasing demand for satellite-based services, and government initiatives. Future opportunities lie in miniaturization, advanced data analytics, and the integration of new technologies like quantum computing. The market is expected to witness significant expansion across various segments, with the commercial sector playing a dominant role. The overall market potential is substantial, indicating promising prospects for investors and stakeholders alike.
Satellite Payload Market Segmentation
- 1. Production Analysis
- 2. Consumption Analysis
- 3. Import Market Analysis (Value & Volume)
- 4. Export Market Analysis (Value & Volume)
- 5. Price Trend Analysis
Satellite Payload Market Segmentation By Geography
-
1. North America
- 1.1. United States
- 1.2. Canada
- 1.3. Mexico
-
2. South America
- 2.1. Brazil
- 2.2. Argentina
- 2.3. Rest of South America
-
3. Europe
- 3.1. United Kingdom
- 3.2. Germany
- 3.3. France
- 3.4. Italy
- 3.5. Spain
- 3.6. Russia
- 3.7. Benelux
- 3.8. Nordics
- 3.9. Rest of Europe
-
4. Middle East & Africa
- 4.1. Turkey
- 4.2. Israel
- 4.3. GCC
- 4.4. North Africa
- 4.5. South Africa
- 4.6. Rest of Middle East & Africa
-
5. Asia Pacific
- 5.1. China
- 5.2. India
- 5.3. Japan
- 5.4. South Korea
- 5.5. ASEAN
- 5.6. Oceania
- 5.7. Rest of Asia Pacific
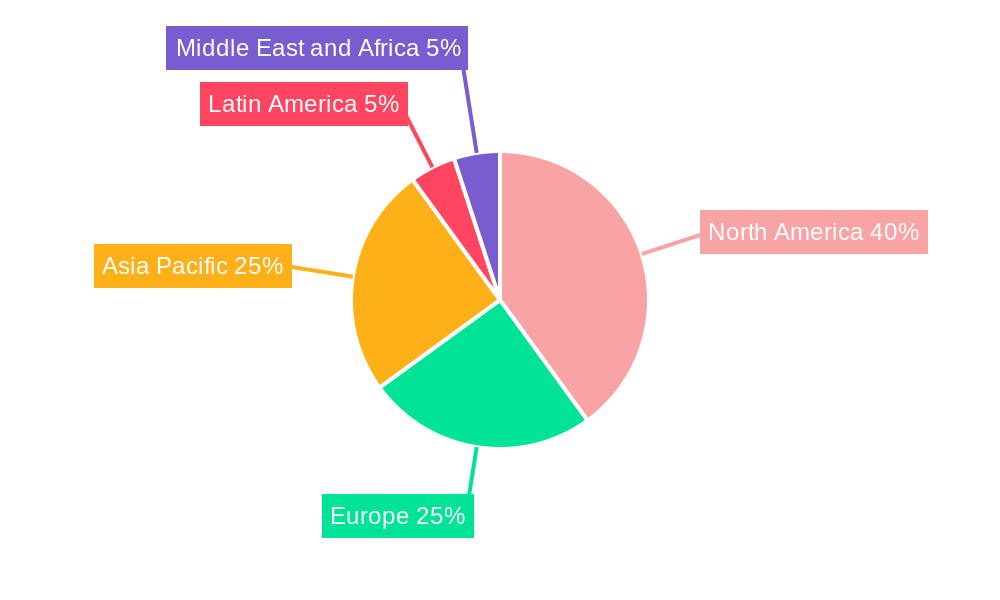
Satellite Payload Market Regional Market Share
Geographic Coverage of Satellite Payload Market
Satellite Payload Market REPORT HIGHLIGHTS
| Aspects | Details |
|---|---|
| Study Period | 2020-2034 |
| Base Year | 2025 |
| Estimated Year | 2026 |
| Forecast Period | 2026-2034 |
| Historical Period | 2020-2025 |
| Growth Rate | CAGR of 8.54% from 2020-2034 |
| Segmentation |
|
Table of Contents
- 1. Introduction
- 1.1. Research Scope
- 1.2. Market Segmentation
- 1.3. Research Objective
- 1.4. Definitions and Assumptions
- 2. Executive Summary
- 2.1. Market Snapshot
- 3. Market Dynamics
- 3.1. Market Drivers
- 3.2. Market Restrains
- 3.3. Market Trends
- 3.4. Market Opportunities
- 4. Market Factor Analysis
- 4.1. Porters Five Forces
- 4.1.1. Bargaining Power of Suppliers
- 4.1.2. Bargaining Power of Buyers
- 4.1.3. Threat of New Entrants
- 4.1.4. Threat of Substitutes
- 4.1.5. Competitive Rivalry
- 4.2. PESTEL analysis
- 4.3. BCG Analysis
- 4.3.1. Stars (High Growth, High Market Share)
- 4.3.2. Cash Cows (Low Growth, High Market Share)
- 4.3.3. Question Mark (High Growth, Low Market Share)
- 4.3.4. Dogs (Low Growth, Low Market Share)
- 4.4. Ansoff Matrix Analysis
- 4.5. Supply Chain Analysis
- 4.6. Regulatory Landscape
- 4.7. Current Market Potential and Opportunity Assessment (TAM–SAM–SOM Framework)
- 4.8. DMV Analyst Note
- 4.1. Porters Five Forces
- 5. Market Analysis, Insights and Forecast 2021-2033
- 5.1. Market Analysis, Insights and Forecast - by Production Analysis
- 5.2. Market Analysis, Insights and Forecast - by Consumption Analysis
- 5.3. Market Analysis, Insights and Forecast - by Import Market Analysis (Value & Volume)
- 5.4. Market Analysis, Insights and Forecast - by Export Market Analysis (Value & Volume)
- 5.5. Market Analysis, Insights and Forecast - by Price Trend Analysis
- 5.6. Market Analysis, Insights and Forecast - by Region
- 5.6.1. North America
- 5.6.2. South America
- 5.6.3. Europe
- 5.6.4. Middle East & Africa
- 5.6.5. Asia Pacific
- 6. Global Satellite Payload Market Analysis, Insights and Forecast, 2021-2033
- 6.1. Market Analysis, Insights and Forecast - by Production Analysis
- 6.2. Market Analysis, Insights and Forecast - by Consumption Analysis
- 6.3. Market Analysis, Insights and Forecast - by Import Market Analysis (Value & Volume)
- 6.4. Market Analysis, Insights and Forecast - by Export Market Analysis (Value & Volume)
- 6.5. Market Analysis, Insights and Forecast - by Price Trend Analysis
- 7. North America Satellite Payload Market Analysis, Insights and Forecast, 2020-2032
- 7.1. Market Analysis, Insights and Forecast - by Production Analysis
- 7.2. Market Analysis, Insights and Forecast - by Consumption Analysis
- 7.3. Market Analysis, Insights and Forecast - by Import Market Analysis (Value & Volume)
- 7.4. Market Analysis, Insights and Forecast - by Export Market Analysis (Value & Volume)
- 7.5. Market Analysis, Insights and Forecast - by Price Trend Analysis
- 8. South America Satellite Payload Market Analysis, Insights and Forecast, 2020-2032
- 8.1. Market Analysis, Insights and Forecast - by Production Analysis
- 8.2. Market Analysis, Insights and Forecast - by Consumption Analysis
- 8.3. Market Analysis, Insights and Forecast - by Import Market Analysis (Value & Volume)
- 8.4. Market Analysis, Insights and Forecast - by Export Market Analysis (Value & Volume)
- 8.5. Market Analysis, Insights and Forecast - by Price Trend Analysis
- 9. Europe Satellite Payload Market Analysis, Insights and Forecast, 2020-2032
- 9.1. Market Analysis, Insights and Forecast - by Production Analysis
- 9.2. Market Analysis, Insights and Forecast - by Consumption Analysis
- 9.3. Market Analysis, Insights and Forecast - by Import Market Analysis (Value & Volume)
- 9.4. Market Analysis, Insights and Forecast - by Export Market Analysis (Value & Volume)
- 9.5. Market Analysis, Insights and Forecast - by Price Trend Analysis
- 10. Middle East & Africa Satellite Payload Market Analysis, Insights and Forecast, 2020-2032
- 10.1. Market Analysis, Insights and Forecast - by Production Analysis
- 10.2. Market Analysis, Insights and Forecast - by Consumption Analysis
- 10.3. Market Analysis, Insights and Forecast - by Import Market Analysis (Value & Volume)
- 10.4. Market Analysis, Insights and Forecast - by Export Market Analysis (Value & Volume)
- 10.5. Market Analysis, Insights and Forecast - by Price Trend Analysis
- 11. Asia Pacific Satellite Payload Market Analysis, Insights and Forecast, 2020-2032
- 11.1. Market Analysis, Insights and Forecast - by Production Analysis
- 11.2. Market Analysis, Insights and Forecast - by Consumption Analysis
- 11.3. Market Analysis, Insights and Forecast - by Import Market Analysis (Value & Volume)
- 11.4. Market Analysis, Insights and Forecast - by Export Market Analysis (Value & Volume)
- 11.5. Market Analysis, Insights and Forecast - by Price Trend Analysis
- 12. Competitive Analysis
- 12.1. Company Profiles
- 12.1.1 Sierra Nevada Corporatio
- 12.1.1.1. Company Overview
- 12.1.1.2. Products
- 12.1.1.3. Company Financials
- 12.1.1.4. SWOT Analysis
- 12.1.2 Space Exploration Technologies Corp
- 12.1.2.1. Company Overview
- 12.1.2.2. Products
- 12.1.2.3. Company Financials
- 12.1.2.4. SWOT Analysis
- 12.1.3 L3Harris Technologies Inc
- 12.1.3.1. Company Overview
- 12.1.3.2. Products
- 12.1.3.3. Company Financials
- 12.1.3.4. SWOT Analysis
- 12.1.4 Honeywell International Inc
- 12.1.4.1. Company Overview
- 12.1.4.2. Products
- 12.1.4.3. Company Financials
- 12.1.4.4. SWOT Analysis
- 12.1.5 THALES
- 12.1.5.1. Company Overview
- 12.1.5.2. Products
- 12.1.5.3. Company Financials
- 12.1.5.4. SWOT Analysis
- 12.1.6 General Dynamics Corporation
- 12.1.6.1. Company Overview
- 12.1.6.2. Products
- 12.1.6.3. Company Financials
- 12.1.6.4. SWOT Analysis
- 12.1.7 Lockheed Martin Corporation
- 12.1.7.1. Company Overview
- 12.1.7.2. Products
- 12.1.7.3. Company Financials
- 12.1.7.4. SWOT Analysis
- 12.1.8 Airbus SE
- 12.1.8.1. Company Overview
- 12.1.8.2. Products
- 12.1.8.3. Company Financials
- 12.1.8.4. SWOT Analysis
- 12.1.9 RTX Corporation
- 12.1.9.1. Company Overview
- 12.1.9.2. Products
- 12.1.9.3. Company Financials
- 12.1.9.4. SWOT Analysis
- 12.1.10 ISRO
- 12.1.10.1. Company Overview
- 12.1.10.2. Products
- 12.1.10.3. Company Financials
- 12.1.10.4. SWOT Analysis
- 12.1.11 Northrop Grumman Corporation
- 12.1.11.1. Company Overview
- 12.1.11.2. Products
- 12.1.11.3. Company Financials
- 12.1.11.4. SWOT Analysis
- 12.1.12 The Boeing Company
- 12.1.12.1. Company Overview
- 12.1.12.2. Products
- 12.1.12.3. Company Financials
- 12.1.12.4. SWOT Analysis
- 12.1.1 Sierra Nevada Corporatio
- 12.2. Market Entropy
- 12.2.1 Company's Key Areas Served
- 12.2.2 Recent Developments
- 12.3. Company Market Share Analysis 2025
- 12.3.1 Top 5 Companies Market Share Analysis
- 12.3.2 Top 3 Companies Market Share Analysis
- 12.4. List of Potential Customers
- 13. Research Methodology
List of Figures
- Figure 1: Global Satellite Payload Market Revenue Breakdown (Million, %) by Region 2025 & 2033
- Figure 2: North America Satellite Payload Market Revenue (Million), by Production Analysis 2025 & 2033
- Figure 3: North America Satellite Payload Market Revenue Share (%), by Production Analysis 2025 & 2033
- Figure 4: North America Satellite Payload Market Revenue (Million), by Consumption Analysis 2025 & 2033
- Figure 5: North America Satellite Payload Market Revenue Share (%), by Consumption Analysis 2025 & 2033
- Figure 6: North America Satellite Payload Market Revenue (Million), by Import Market Analysis (Value & Volume) 2025 & 2033
- Figure 7: North America Satellite Payload Market Revenue Share (%), by Import Market Analysis (Value & Volume) 2025 & 2033
- Figure 8: North America Satellite Payload Market Revenue (Million), by Export Market Analysis (Value & Volume) 2025 & 2033
- Figure 9: North America Satellite Payload Market Revenue Share (%), by Export Market Analysis (Value & Volume) 2025 & 2033
- Figure 10: North America Satellite Payload Market Revenue (Million), by Price Trend Analysis 2025 & 2033
- Figure 11: North America Satellite Payload Market Revenue Share (%), by Price Trend Analysis 2025 & 2033
- Figure 12: North America Satellite Payload Market Revenue (Million), by Country 2025 & 2033
- Figure 13: North America Satellite Payload Market Revenue Share (%), by Country 2025 & 2033
- Figure 14: South America Satellite Payload Market Revenue (Million), by Production Analysis 2025 & 2033
- Figure 15: South America Satellite Payload Market Revenue Share (%), by Production Analysis 2025 & 2033
- Figure 16: South America Satellite Payload Market Revenue (Million), by Consumption Analysis 2025 & 2033
- Figure 17: South America Satellite Payload Market Revenue Share (%), by Consumption Analysis 2025 & 2033
- Figure 18: South America Satellite Payload Market Revenue (Million), by Import Market Analysis (Value & Volume) 2025 & 2033
- Figure 19: South America Satellite Payload Market Revenue Share (%), by Import Market Analysis (Value & Volume) 2025 & 2033
- Figure 20: South America Satellite Payload Market Revenue (Million), by Export Market Analysis (Value & Volume) 2025 & 2033
- Figure 21: South America Satellite Payload Market Revenue Share (%), by Export Market Analysis (Value & Volume) 2025 & 2033
- Figure 22: South America Satellite Payload Market Revenue (Million), by Price Trend Analysis 2025 & 2033
- Figure 23: South America Satellite Payload Market Revenue Share (%), by Price Trend Analysis 2025 & 2033
- Figure 24: South America Satellite Payload Market Revenue (Million), by Country 2025 & 2033
- Figure 25: South America Satellite Payload Market Revenue Share (%), by Country 2025 & 2033
- Figure 26: Europe Satellite Payload Market Revenue (Million), by Production Analysis 2025 & 2033
- Figure 27: Europe Satellite Payload Market Revenue Share (%), by Production Analysis 2025 & 2033
- Figure 28: Europe Satellite Payload Market Revenue (Million), by Consumption Analysis 2025 & 2033
- Figure 29: Europe Satellite Payload Market Revenue Share (%), by Consumption Analysis 2025 & 2033
- Figure 30: Europe Satellite Payload Market Revenue (Million), by Import Market Analysis (Value & Volume) 2025 & 2033
- Figure 31: Europe Satellite Payload Market Revenue Share (%), by Import Market Analysis (Value & Volume) 2025 & 2033
- Figure 32: Europe Satellite Payload Market Revenue (Million), by Export Market Analysis (Value & Volume) 2025 & 2033
- Figure 33: Europe Satellite Payload Market Revenue Share (%), by Export Market Analysis (Value & Volume) 2025 & 2033
- Figure 34: Europe Satellite Payload Market Revenue (Million), by Price Trend Analysis 2025 & 2033
- Figure 35: Europe Satellite Payload Market Revenue Share (%), by Price Trend Analysis 2025 & 2033
- Figure 36: Europe Satellite Payload Market Revenue (Million), by Country 2025 & 2033
- Figure 37: Europe Satellite Payload Market Revenue Share (%), by Country 2025 & 2033
- Figure 38: Middle East & Africa Satellite Payload Market Revenue (Million), by Production Analysis 2025 & 2033
- Figure 39: Middle East & Africa Satellite Payload Market Revenue Share (%), by Production Analysis 2025 & 2033
- Figure 40: Middle East & Africa Satellite Payload Market Revenue (Million), by Consumption Analysis 2025 & 2033
- Figure 41: Middle East & Africa Satellite Payload Market Revenue Share (%), by Consumption Analysis 2025 & 2033
- Figure 42: Middle East & Africa Satellite Payload Market Revenue (Million), by Import Market Analysis (Value & Volume) 2025 & 2033
- Figure 43: Middle East & Africa Satellite Payload Market Revenue Share (%), by Import Market Analysis (Value & Volume) 2025 & 2033
- Figure 44: Middle East & Africa Satellite Payload Market Revenue (Million), by Export Market Analysis (Value & Volume) 2025 & 2033
- Figure 45: Middle East & Africa Satellite Payload Market Revenue Share (%), by Export Market Analysis (Value & Volume) 2025 & 2033
- Figure 46: Middle East & Africa Satellite Payload Market Revenue (Million), by Price Trend Analysis 2025 & 2033
- Figure 47: Middle East & Africa Satellite Payload Market Revenue Share (%), by Price Trend Analysis 2025 & 2033
- Figure 48: Middle East & Africa Satellite Payload Market Revenue (Million), by Country 2025 & 2033
- Figure 49: Middle East & Africa Satellite Payload Market Revenue Share (%), by Country 2025 & 2033
- Figure 50: Asia Pacific Satellite Payload Market Revenue (Million), by Production Analysis 2025 & 2033
- Figure 51: Asia Pacific Satellite Payload Market Revenue Share (%), by Production Analysis 2025 & 2033
- Figure 52: Asia Pacific Satellite Payload Market Revenue (Million), by Consumption Analysis 2025 & 2033
- Figure 53: Asia Pacific Satellite Payload Market Revenue Share (%), by Consumption Analysis 2025 & 2033
- Figure 54: Asia Pacific Satellite Payload Market Revenue (Million), by Import Market Analysis (Value & Volume) 2025 & 2033
- Figure 55: Asia Pacific Satellite Payload Market Revenue Share (%), by Import Market Analysis (Value & Volume) 2025 & 2033
- Figure 56: Asia Pacific Satellite Payload Market Revenue (Million), by Export Market Analysis (Value & Volume) 2025 & 2033
- Figure 57: Asia Pacific Satellite Payload Market Revenue Share (%), by Export Market Analysis (Value & Volume) 2025 & 2033
- Figure 58: Asia Pacific Satellite Payload Market Revenue (Million), by Price Trend Analysis 2025 & 2033
- Figure 59: Asia Pacific Satellite Payload Market Revenue Share (%), by Price Trend Analysis 2025 & 2033
- Figure 60: Asia Pacific Satellite Payload Market Revenue (Million), by Country 2025 & 2033
- Figure 61: Asia Pacific Satellite Payload Market Revenue Share (%), by Country 2025 & 2033
List of Tables
- Table 1: Global Satellite Payload Market Revenue Million Forecast, by Production Analysis 2020 & 2033
- Table 2: Global Satellite Payload Market Revenue Million Forecast, by Consumption Analysis 2020 & 2033
- Table 3: Global Satellite Payload Market Revenue Million Forecast, by Import Market Analysis (Value & Volume) 2020 & 2033
- Table 4: Global Satellite Payload Market Revenue Million Forecast, by Export Market Analysis (Value & Volume) 2020 & 2033
- Table 5: Global Satellite Payload Market Revenue Million Forecast, by Price Trend Analysis 2020 & 2033
- Table 6: Global Satellite Payload Market Revenue Million Forecast, by Region 2020 & 2033
- Table 7: Global Satellite Payload Market Revenue Million Forecast, by Production Analysis 2020 & 2033
- Table 8: Global Satellite Payload Market Revenue Million Forecast, by Consumption Analysis 2020 & 2033
- Table 9: Global Satellite Payload Market Revenue Million Forecast, by Import Market Analysis (Value & Volume) 2020 & 2033
- Table 10: Global Satellite Payload Market Revenue Million Forecast, by Export Market Analysis (Value & Volume) 2020 & 2033
- Table 11: Global Satellite Payload Market Revenue Million Forecast, by Price Trend Analysis 2020 & 2033
- Table 12: Global Satellite Payload Market Revenue Million Forecast, by Country 2020 & 2033
- Table 13: United States Satellite Payload Market Revenue (Million) Forecast, by Application 2020 & 2033
- Table 14: Canada Satellite Payload Market Revenue (Million) Forecast, by Application 2020 & 2033
- Table 15: Mexico Satellite Payload Market Revenue (Million) Forecast, by Application 2020 & 2033
- Table 16: Global Satellite Payload Market Revenue Million Forecast, by Production Analysis 2020 & 2033
- Table 17: Global Satellite Payload Market Revenue Million Forecast, by Consumption Analysis 2020 & 2033
- Table 18: Global Satellite Payload Market Revenue Million Forecast, by Import Market Analysis (Value & Volume) 2020 & 2033
- Table 19: Global Satellite Payload Market Revenue Million Forecast, by Export Market Analysis (Value & Volume) 2020 & 2033
- Table 20: Global Satellite Payload Market Revenue Million Forecast, by Price Trend Analysis 2020 & 2033
- Table 21: Global Satellite Payload Market Revenue Million Forecast, by Country 2020 & 2033
- Table 22: Brazil Satellite Payload Market Revenue (Million) Forecast, by Application 2020 & 2033
- Table 23: Argentina Satellite Payload Market Revenue (Million) Forecast, by Application 2020 & 2033
- Table 24: Rest of South America Satellite Payload Market Revenue (Million) Forecast, by Application 2020 & 2033
- Table 25: Global Satellite Payload Market Revenue Million Forecast, by Production Analysis 2020 & 2033
- Table 26: Global Satellite Payload Market Revenue Million Forecast, by Consumption Analysis 2020 & 2033
- Table 27: Global Satellite Payload Market Revenue Million Forecast, by Import Market Analysis (Value & Volume) 2020 & 2033
- Table 28: Global Satellite Payload Market Revenue Million Forecast, by Export Market Analysis (Value & Volume) 2020 & 2033
- Table 29: Global Satellite Payload Market Revenue Million Forecast, by Price Trend Analysis 2020 & 2033
- Table 30: Global Satellite Payload Market Revenue Million Forecast, by Country 2020 & 2033
- Table 31: United Kingdom Satellite Payload Market Revenue (Million) Forecast, by Application 2020 & 2033
- Table 32: Germany Satellite Payload Market Revenue (Million) Forecast, by Application 2020 & 2033
- Table 33: France Satellite Payload Market Revenue (Million) Forecast, by Application 2020 & 2033
- Table 34: Italy Satellite Payload Market Revenue (Million) Forecast, by Application 2020 & 2033
- Table 35: Spain Satellite Payload Market Revenue (Million) Forecast, by Application 2020 & 2033
- Table 36: Russia Satellite Payload Market Revenue (Million) Forecast, by Application 2020 & 2033
- Table 37: Benelux Satellite Payload Market Revenue (Million) Forecast, by Application 2020 & 2033
- Table 38: Nordics Satellite Payload Market Revenue (Million) Forecast, by Application 2020 & 2033
- Table 39: Rest of Europe Satellite Payload Market Revenue (Million) Forecast, by Application 2020 & 2033
- Table 40: Global Satellite Payload Market Revenue Million Forecast, by Production Analysis 2020 & 2033
- Table 41: Global Satellite Payload Market Revenue Million Forecast, by Consumption Analysis 2020 & 2033
- Table 42: Global Satellite Payload Market Revenue Million Forecast, by Import Market Analysis (Value & Volume) 2020 & 2033
- Table 43: Global Satellite Payload Market Revenue Million Forecast, by Export Market Analysis (Value & Volume) 2020 & 2033
- Table 44: Global Satellite Payload Market Revenue Million Forecast, by Price Trend Analysis 2020 & 2033
- Table 45: Global Satellite Payload Market Revenue Million Forecast, by Country 2020 & 2033
- Table 46: Turkey Satellite Payload Market Revenue (Million) Forecast, by Application 2020 & 2033
- Table 47: Israel Satellite Payload Market Revenue (Million) Forecast, by Application 2020 & 2033
- Table 48: GCC Satellite Payload Market Revenue (Million) Forecast, by Application 2020 & 2033
- Table 49: North Africa Satellite Payload Market Revenue (Million) Forecast, by Application 2020 & 2033
- Table 50: South Africa Satellite Payload Market Revenue (Million) Forecast, by Application 2020 & 2033
- Table 51: Rest of Middle East & Africa Satellite Payload Market Revenue (Million) Forecast, by Application 2020 & 2033
- Table 52: Global Satellite Payload Market Revenue Million Forecast, by Production Analysis 2020 & 2033
- Table 53: Global Satellite Payload Market Revenue Million Forecast, by Consumption Analysis 2020 & 2033
- Table 54: Global Satellite Payload Market Revenue Million Forecast, by Import Market Analysis (Value & Volume) 2020 & 2033
- Table 55: Global Satellite Payload Market Revenue Million Forecast, by Export Market Analysis (Value & Volume) 2020 & 2033
- Table 56: Global Satellite Payload Market Revenue Million Forecast, by Price Trend Analysis 2020 & 2033
- Table 57: Global Satellite Payload Market Revenue Million Forecast, by Country 2020 & 2033
- Table 58: China Satellite Payload Market Revenue (Million) Forecast, by Application 2020 & 2033
- Table 59: India Satellite Payload Market Revenue (Million) Forecast, by Application 2020 & 2033
- Table 60: Japan Satellite Payload Market Revenue (Million) Forecast, by Application 2020 & 2033
- Table 61: South Korea Satellite Payload Market Revenue (Million) Forecast, by Application 2020 & 2033
- Table 62: ASEAN Satellite Payload Market Revenue (Million) Forecast, by Application 2020 & 2033
- Table 63: Oceania Satellite Payload Market Revenue (Million) Forecast, by Application 2020 & 2033
- Table 64: Rest of Asia Pacific Satellite Payload Market Revenue (Million) Forecast, by Application 2020 & 2033
Frequently Asked Questions
1. What is the projected Compound Annual Growth Rate (CAGR) of the Satellite Payload Market?
The projected CAGR is approximately 8.54%.
2. Which companies are prominent players in the Satellite Payload Market?
Key companies in the market include Sierra Nevada Corporatio, Space Exploration Technologies Corp, L3Harris Technologies Inc, Honeywell International Inc, THALES, General Dynamics Corporation, Lockheed Martin Corporation, Airbus SE, RTX Corporation, ISRO, Northrop Grumman Corporation, The Boeing Company.
3. What are the main segments of the Satellite Payload Market?
The market segments include Production Analysis, Consumption Analysis, Import Market Analysis (Value & Volume), Export Market Analysis (Value & Volume), Price Trend Analysis.
4. Can you provide details about the market size?
The market size is estimated to be USD 16.27 Million as of 2022.
5. What are some drivers contributing to market growth?
; Increasing Number Of Air Passengers; Use Of Portable Electronic Devices.
6. What are the notable trends driving market growth?
Commercial Segment is Expected to Show Significant Growth During the Forecast Period.
7. Are there any restraints impacting market growth?
; High Cost Of Connectivity Equipments.
8. Can you provide examples of recent developments in the market?
N/A
9. What pricing options are available for accessing the report?
Pricing options include single-user, multi-user, and enterprise licenses priced at USD 4750, USD 5250, and USD 8750 respectively.
10. Is the market size provided in terms of value or volume?
The market size is provided in terms of value, measured in Million.
11. Are there any specific market keywords associated with the report?
Yes, the market keyword associated with the report is "Satellite Payload Market," which aids in identifying and referencing the specific market segment covered.
12. How do I determine which pricing option suits my needs best?
The pricing options vary based on user requirements and access needs. Individual users may opt for single-user licenses, while businesses requiring broader access may choose multi-user or enterprise licenses for cost-effective access to the report.
13. Are there any additional resources or data provided in the Satellite Payload Market report?
While the report offers comprehensive insights, it's advisable to review the specific contents or supplementary materials provided to ascertain if additional resources or data are available.
14. How can I stay updated on further developments or reports in the Satellite Payload Market?
To stay informed about further developments, trends, and reports in the Satellite Payload Market, consider subscribing to industry newsletters, following relevant companies and organizations, or regularly checking reputable industry news sources and publications.
Methodology
Step 1 - Identification of Relevant Samples Size from Population Database


Step 2 - Approaches for Defining Global Market Size (Value, Volume* & Price*)

Note*: In applicable scenarios
Step 3 - Data Sources
Primary Research
- Web Analytics
- Survey Reports
- Research Institute
- Latest Research Reports
- Opinion Leaders
Secondary Research
- Annual Reports
- White Paper
- Latest Press Release
- Industry Association
- Paid Database
- Investor Presentations

Step 4 - Data Triangulation
Involves using different sources of information in order to increase the validity of a study
These sources are likely to be stakeholders in a program - participants, other researchers, program staff, other community members, and so on.
Then we put all data in single framework & apply various statistical tools to find out the dynamic on the market.
During the analysis stage, feedback from the stakeholder groups would be compared to determine areas of agreement as well as areas of divergence