

Key Insights
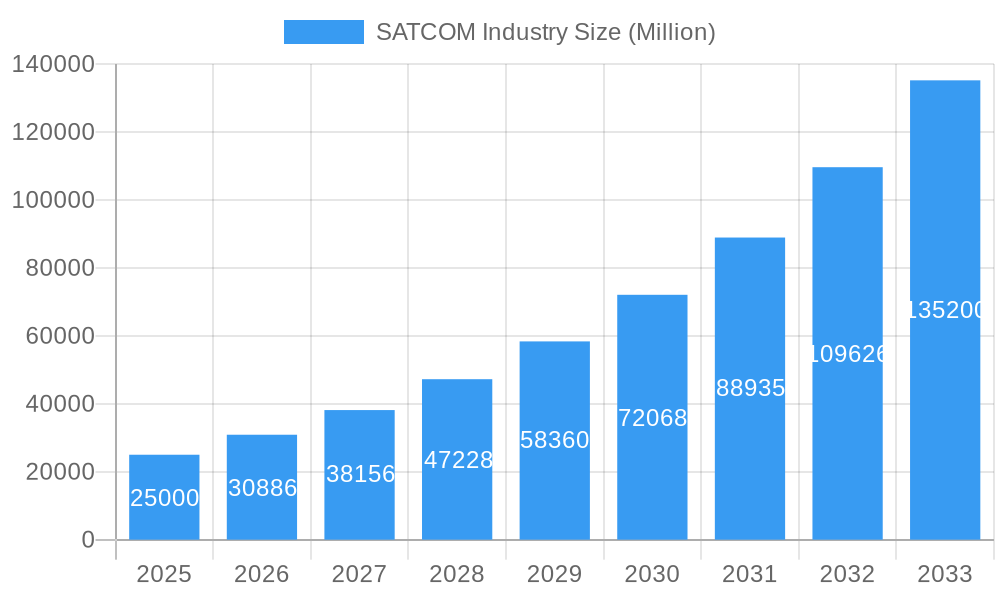
The global Satellite Communication (SATCOM) market is poised for significant expansion, driven by escalating demand for high-bandwidth connectivity across diverse industries. The market, valued at $98.28 billion in the base year 2025, is projected to grow at a compound annual growth rate (CAGR) of 11% through 2033. Key growth drivers include the proliferation of Internet of Things (IoT) devices, increased adoption of cloud services, and the critical need for resilient communication in remote locations. Technological advancements, such as the development of High Throughput Satellites (HTS) and the deployment of Low Earth Orbit (LEO) constellations, are enhancing capacity and reducing latency, thereby attracting new applications and users. The commercial sector, including broadcasting, mobile communications, and data services, represents the largest end-user segment, followed by military and government applications. Growth within these segments is further segmented by satellite mass, with the 100-500kg category showing particular strength, and by orbit class, with LEO constellations driving substantial expansion. Broadcasting and mobile communication are leading growth in communication types.
SATCOM Industry Market Size (In Billion)
The SATCOM industry features a competitive landscape with established companies such as Intelsat, Airbus SE, and Viasat Inc., alongside emerging players like SpaceX and Swarm Technologies. Success in this dynamic market depends on continuous innovation in satellite technology, network infrastructure, and service delivery. Regulatory frameworks and spectrum allocation are critical factors influencing market trajectory. Despite these challenges, the long-term outlook for the SATCOM industry is highly positive, propelled by ongoing technological progress and the persistent global demand for reliable, high-speed connectivity. The market is expected to exceed $100 billion by 2033, presenting substantial opportunities for investment and continued growth.
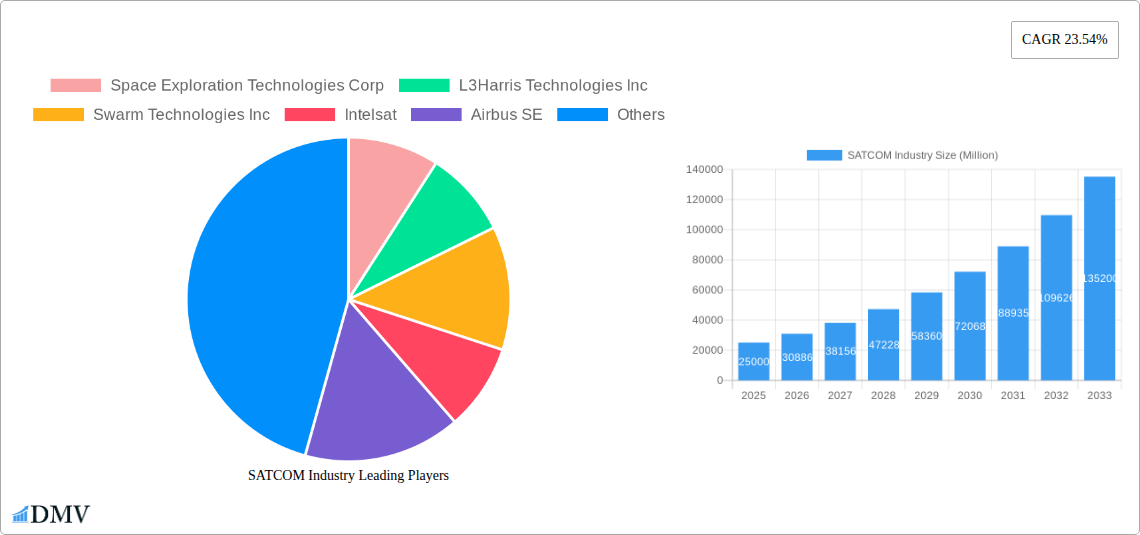
SATCOM Industry Company Market Share
SATCOM Industry Market Report: 2019-2033
This comprehensive report provides a detailed analysis of the global Satellite Communication (SATCOM) industry, offering invaluable insights for stakeholders seeking to navigate this dynamic market. The study period covers 2019-2033, with a base year of 2025 and a forecast period of 2025-2033. The report values are expressed in Millions of dollars. This in-depth analysis encompasses market sizing, segmentation, competitive landscape, technological advancements, and future growth projections, providing a complete overview of this rapidly evolving sector.
SATCOM Industry Market Composition & Trends
The SATCOM industry, valued at $xx Million in 2024, exhibits a complex interplay of market concentration, technological innovation, regulatory shifts, and competitive dynamics. Key players like Space Exploration Technologies Corp, L3Harris Technologies Inc, and Intelsat hold significant market share, while numerous smaller companies contribute to a diverse landscape. The market is witnessing significant M&A activity, with deal values exceeding $xx Million in the past five years. Innovation is driven by advancements in satellite technology, miniaturization, and the rise of new constellations. Regulatory frameworks, varying by region, significantly impact market access and investment. Substitute technologies, such as terrestrial fiber networks, pose a competitive challenge, though the need for global connectivity continues to fuel SATCOM growth. End-user segments, including commercial, military & government, and others, exhibit varying demands and growth trajectories.
- Market Share Distribution (2024): Intelsat: xx%, L3Harris Technologies Inc: xx%, Space Exploration Technologies Corp: xx%, Others: xx%
- M&A Deal Value (2019-2024): $xx Million
- Key Innovation Catalysts: Miniaturization, High-Throughput Satellites, Software-Defined Networks
- Regulatory Landscape: Varied by region, impacting licensing and spectrum allocation.
- Substitute Products: Terrestrial fiber networks, cellular networks.
SATCOM Industry Industry Evolution
The SATCOM market has experienced robust growth throughout the historical period (2019-2024), with a Compound Annual Growth Rate (CAGR) of xx%. This growth is fueled by increasing demand for high-bandwidth connectivity across various sectors, particularly in remote areas and developing nations. Technological advancements, including the development of smaller, more efficient satellites, have significantly reduced launch costs and improved service capabilities. The shift toward Software-Defined Networks (SDNs) and Network Function Virtualization (NFV) is enhancing network flexibility and scalability. Consumer demand for higher data rates, low latency, and reliable connectivity, especially for mobile communication and internet of things (IoT) applications, continues to drive innovation and investment. The market is further evolving with the increased adoption of Low Earth Orbit (LEO) constellations, offering improved coverage and reduced latency compared to traditional Geostationary Orbit (GEO) satellites.
- CAGR (2019-2024): xx%
- Projected CAGR (2025-2033): xx%
- LEO Constellation Adoption Rate (2024): xx%
Leading Regions, Countries, or Segments in SATCOM Industry
The North American region dominates the SATCOM market, driven by substantial investments in space infrastructure, strong government support, and a thriving commercial sector. Within the market segmentation, the 100-500kg satellite mass segment demonstrates significant growth potential due to its cost-effectiveness and versatility. The LEO orbit class is experiencing rapid expansion, facilitated by technological breakthroughs and reduced launch costs. The Mobile Communication segment maintains the largest market share due to the increasing penetration of mobile devices and demand for seamless connectivity. The Commercial end-user segment is the primary growth driver, with significant investments from telecommunication companies and internet service providers.
- Key Drivers for North American Dominance: High investment in space technology, supportive government policies, strong commercial sector.
- 100-500kg Satellite Mass Segment: Cost-effective, versatile, driving market growth.
- LEO Orbit Class: Technological advancements, reduced launch costs.
- Mobile Communication Segment: Driven by widespread mobile device usage and demand for connectivity.
- Commercial End-User Segment: Large investments from telecom and ISPs.
SATCOM Industry Product Innovations
Recent innovations include the development of high-throughput satellites (HTS) offering significantly increased bandwidth capacity, and the integration of advanced antenna technologies for improved signal quality and coverage. Software-defined satellites enable flexible and adaptable network configurations, catering to diverse user needs. Miniaturization efforts are resulting in smaller, lighter satellites, reducing launch costs and deployment complexity. These advancements are driving the expansion of mobile satellite services, enhancing global broadband coverage, and empowering Internet of Things (IoT) applications.
Propelling Factors for SATCOM Industry Growth
Technological advancements, such as the development of HTS and miniaturization, are key drivers. Government initiatives and increased investment in space infrastructure are also fostering market growth. The rising demand for reliable and high-bandwidth connectivity across various sectors, particularly in remote areas and developing countries, is fueling expansion. The increasing integration of satellite communication technology with IoT devices presents a significant growth opportunity.
Obstacles in the SATCOM Industry Market
High capital expenditure for satellite development and launch poses a significant barrier to entry. Regulatory hurdles related to spectrum allocation and licensing can complicate market access. Supply chain disruptions and geopolitical instability can impact the availability of critical components and resources. Competitive pressures from terrestrial communication technologies, such as fiber optic cables, also present a challenge.
Future Opportunities in SATCOM Industry
The expanding IoT market presents a significant opportunity for SATCOM providers. Growth in the adoption of 5G and beyond will likely further stimulate the need for satellite-based solutions for enhanced capacity and coverage. The expansion of satellite-based broadband services in underserved regions will drive growth. Advancements in satellite constellation technologies will open up new avenues for more reliable and efficient service delivery.
Major Players in the SATCOM Industry Ecosystem
- Space Exploration Technologies Corp
- L3Harris Technologies Inc
- Swarm Technologies Inc
- Intelsat
- Airbus SE
- Viasat Inc
- Cobham Limited
- China Aerospace Science and Technology Corporation (CASC)
- Thales
- SKY Perfect JSAT Corporation
- SES S A
- Maxar Technologies Inc
- Thuraya Telecommunications Company
- EchoStar Corporation
Key Developments in SATCOM Industry Industry
- February 2023: Anuvu and Telesat agreement for new antennas and ground station infrastructure to support the Anuvu Constellation. This expands high-speed connectivity capabilities.
- February 2023: SES, ThinKom, and Hughes launch a multi-orbit service for government aerial missions, showcasing technological advancement in satellite communication.
- January 2023: Viasat secures a US Marine Corps contract for satellite communications support, highlighting the importance of SATCOM in military applications.
Strategic SATCOM Industry Market Forecast
The SATCOM market is poised for significant growth driven by technological advancements, increasing demand for connectivity, and strategic investments. The proliferation of LEO constellations, combined with the expansion of 5G and IoT technologies, will significantly impact market dynamics. New opportunities exist in expanding services to underserved markets and providing solutions for emerging applications. The market is expected to exhibit a robust CAGR, exceeding expectations of previous years, reflecting the industry's dynamic evolution and considerable growth potential.
SATCOM Industry Segmentation
-
1. Satellite Mass
- 1.1. 10-100kg
- 1.2. 100-500kg
- 1.3. 500-1000kg
- 1.4. Below 10 Kg
- 1.5. above 1000kg
-
2. Orbit Class
- 2.1. GEO
- 2.2. LEO
- 2.3. MEO
-
3. Communication Type
- 3.1. Broadcasting
- 3.2. Mobile Communication
- 3.3. Satellite Phone
- 3.4. Others
-
4. End User
- 4.1. Commercial
- 4.2. Military & Government
- 4.3. Other
SATCOM Industry Segmentation By Geography
-
1. North America
- 1.1. United States
- 1.2. Canada
- 1.3. Mexico
-
2. South America
- 2.1. Brazil
- 2.2. Argentina
- 2.3. Rest of South America
-
3. Europe
- 3.1. United Kingdom
- 3.2. Germany
- 3.3. France
- 3.4. Italy
- 3.5. Spain
- 3.6. Russia
- 3.7. Benelux
- 3.8. Nordics
- 3.9. Rest of Europe
-
4. Middle East & Africa
- 4.1. Turkey
- 4.2. Israel
- 4.3. GCC
- 4.4. North Africa
- 4.5. South Africa
- 4.6. Rest of Middle East & Africa
-
5. Asia Pacific
- 5.1. China
- 5.2. India
- 5.3. Japan
- 5.4. South Korea
- 5.5. ASEAN
- 5.6. Oceania
- 5.7. Rest of Asia Pacific
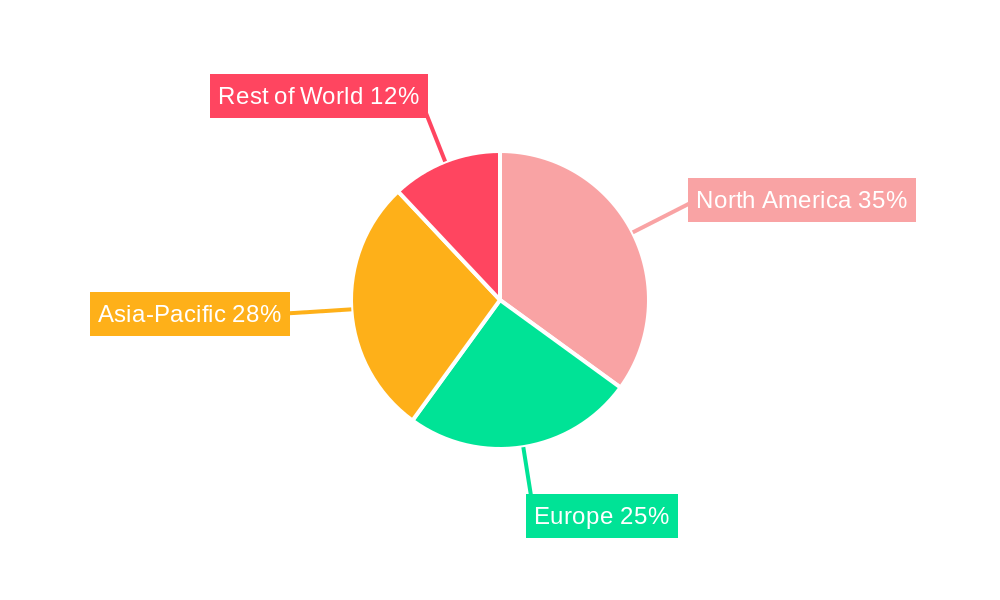
SATCOM Industry Regional Market Share
Geographic Coverage of SATCOM Industry
SATCOM Industry REPORT HIGHLIGHTS
| Aspects | Details |
|---|---|
| Study Period | 2020-2034 |
| Base Year | 2025 |
| Estimated Year | 2026 |
| Forecast Period | 2026-2034 |
| Historical Period | 2020-2025 |
| Growth Rate | CAGR of 11% from 2020-2034 |
| Segmentation |
|
Table of Contents
- 1. Introduction
- 1.1. Research Scope
- 1.2. Market Segmentation
- 1.3. Research Objective
- 1.4. Definitions and Assumptions
- 2. Executive Summary
- 2.1. Market Snapshot
- 3. Market Dynamics
- 3.1. Market Drivers
- 3.2. Market Restrains
- 3.3. Market Trends
- 3.4. Market Opportunities
- 4. Market Factor Analysis
- 4.1. Porters Five Forces
- 4.1.1. Bargaining Power of Suppliers
- 4.1.2. Bargaining Power of Buyers
- 4.1.3. Threat of New Entrants
- 4.1.4. Threat of Substitutes
- 4.1.5. Competitive Rivalry
- 4.2. PESTEL analysis
- 4.3. BCG Analysis
- 4.3.1. Stars (High Growth, High Market Share)
- 4.3.2. Cash Cows (Low Growth, High Market Share)
- 4.3.3. Question Mark (High Growth, Low Market Share)
- 4.3.4. Dogs (Low Growth, Low Market Share)
- 4.4. Ansoff Matrix Analysis
- 4.5. Supply Chain Analysis
- 4.6. Regulatory Landscape
- 4.7. Current Market Potential and Opportunity Assessment (TAM–SAM–SOM Framework)
- 4.8. DMV Analyst Note
- 4.1. Porters Five Forces
- 5. Market Analysis, Insights and Forecast 2021-2033
- 5.1. Market Analysis, Insights and Forecast - by Satellite Mass
- 5.1.1. 10-100kg
- 5.1.2. 100-500kg
- 5.1.3. 500-1000kg
- 5.1.4. Below 10 Kg
- 5.1.5. above 1000kg
- 5.2. Market Analysis, Insights and Forecast - by Orbit Class
- 5.2.1. GEO
- 5.2.2. LEO
- 5.2.3. MEO
- 5.3. Market Analysis, Insights and Forecast - by Communication Type
- 5.3.1. Broadcasting
- 5.3.2. Mobile Communication
- 5.3.3. Satellite Phone
- 5.3.4. Others
- 5.4. Market Analysis, Insights and Forecast - by End User
- 5.4.1. Commercial
- 5.4.2. Military & Government
- 5.4.3. Other
- 5.5. Market Analysis, Insights and Forecast - by Region
- 5.5.1. North America
- 5.5.2. South America
- 5.5.3. Europe
- 5.5.4. Middle East & Africa
- 5.5.5. Asia Pacific
- 5.1. Market Analysis, Insights and Forecast - by Satellite Mass
- 6. Global SATCOM Industry Analysis, Insights and Forecast, 2021-2033
- 6.1. Market Analysis, Insights and Forecast - by Satellite Mass
- 6.1.1. 10-100kg
- 6.1.2. 100-500kg
- 6.1.3. 500-1000kg
- 6.1.4. Below 10 Kg
- 6.1.5. above 1000kg
- 6.2. Market Analysis, Insights and Forecast - by Orbit Class
- 6.2.1. GEO
- 6.2.2. LEO
- 6.2.3. MEO
- 6.3. Market Analysis, Insights and Forecast - by Communication Type
- 6.3.1. Broadcasting
- 6.3.2. Mobile Communication
- 6.3.3. Satellite Phone
- 6.3.4. Others
- 6.4. Market Analysis, Insights and Forecast - by End User
- 6.4.1. Commercial
- 6.4.2. Military & Government
- 6.4.3. Other
- 6.1. Market Analysis, Insights and Forecast - by Satellite Mass
- 7. North America SATCOM Industry Analysis, Insights and Forecast, 2020-2032
- 7.1. Market Analysis, Insights and Forecast - by Satellite Mass
- 7.1.1. 10-100kg
- 7.1.2. 100-500kg
- 7.1.3. 500-1000kg
- 7.1.4. Below 10 Kg
- 7.1.5. above 1000kg
- 7.2. Market Analysis, Insights and Forecast - by Orbit Class
- 7.2.1. GEO
- 7.2.2. LEO
- 7.2.3. MEO
- 7.3. Market Analysis, Insights and Forecast - by Communication Type
- 7.3.1. Broadcasting
- 7.3.2. Mobile Communication
- 7.3.3. Satellite Phone
- 7.3.4. Others
- 7.4. Market Analysis, Insights and Forecast - by End User
- 7.4.1. Commercial
- 7.4.2. Military & Government
- 7.4.3. Other
- 7.1. Market Analysis, Insights and Forecast - by Satellite Mass
- 8. South America SATCOM Industry Analysis, Insights and Forecast, 2020-2032
- 8.1. Market Analysis, Insights and Forecast - by Satellite Mass
- 8.1.1. 10-100kg
- 8.1.2. 100-500kg
- 8.1.3. 500-1000kg
- 8.1.4. Below 10 Kg
- 8.1.5. above 1000kg
- 8.2. Market Analysis, Insights and Forecast - by Orbit Class
- 8.2.1. GEO
- 8.2.2. LEO
- 8.2.3. MEO
- 8.3. Market Analysis, Insights and Forecast - by Communication Type
- 8.3.1. Broadcasting
- 8.3.2. Mobile Communication
- 8.3.3. Satellite Phone
- 8.3.4. Others
- 8.4. Market Analysis, Insights and Forecast - by End User
- 8.4.1. Commercial
- 8.4.2. Military & Government
- 8.4.3. Other
- 8.1. Market Analysis, Insights and Forecast - by Satellite Mass
- 9. Europe SATCOM Industry Analysis, Insights and Forecast, 2020-2032
- 9.1. Market Analysis, Insights and Forecast - by Satellite Mass
- 9.1.1. 10-100kg
- 9.1.2. 100-500kg
- 9.1.3. 500-1000kg
- 9.1.4. Below 10 Kg
- 9.1.5. above 1000kg
- 9.2. Market Analysis, Insights and Forecast - by Orbit Class
- 9.2.1. GEO
- 9.2.2. LEO
- 9.2.3. MEO
- 9.3. Market Analysis, Insights and Forecast - by Communication Type
- 9.3.1. Broadcasting
- 9.3.2. Mobile Communication
- 9.3.3. Satellite Phone
- 9.3.4. Others
- 9.4. Market Analysis, Insights and Forecast - by End User
- 9.4.1. Commercial
- 9.4.2. Military & Government
- 9.4.3. Other
- 9.1. Market Analysis, Insights and Forecast - by Satellite Mass
- 10. Middle East & Africa SATCOM Industry Analysis, Insights and Forecast, 2020-2032
- 10.1. Market Analysis, Insights and Forecast - by Satellite Mass
- 10.1.1. 10-100kg
- 10.1.2. 100-500kg
- 10.1.3. 500-1000kg
- 10.1.4. Below 10 Kg
- 10.1.5. above 1000kg
- 10.2. Market Analysis, Insights and Forecast - by Orbit Class
- 10.2.1. GEO
- 10.2.2. LEO
- 10.2.3. MEO
- 10.3. Market Analysis, Insights and Forecast - by Communication Type
- 10.3.1. Broadcasting
- 10.3.2. Mobile Communication
- 10.3.3. Satellite Phone
- 10.3.4. Others
- 10.4. Market Analysis, Insights and Forecast - by End User
- 10.4.1. Commercial
- 10.4.2. Military & Government
- 10.4.3. Other
- 10.1. Market Analysis, Insights and Forecast - by Satellite Mass
- 11. Asia Pacific SATCOM Industry Analysis, Insights and Forecast, 2020-2032
- 11.1. Market Analysis, Insights and Forecast - by Satellite Mass
- 11.1.1. 10-100kg
- 11.1.2. 100-500kg
- 11.1.3. 500-1000kg
- 11.1.4. Below 10 Kg
- 11.1.5. above 1000kg
- 11.2. Market Analysis, Insights and Forecast - by Orbit Class
- 11.2.1. GEO
- 11.2.2. LEO
- 11.2.3. MEO
- 11.3. Market Analysis, Insights and Forecast - by Communication Type
- 11.3.1. Broadcasting
- 11.3.2. Mobile Communication
- 11.3.3. Satellite Phone
- 11.3.4. Others
- 11.4. Market Analysis, Insights and Forecast - by End User
- 11.4.1. Commercial
- 11.4.2. Military & Government
- 11.4.3. Other
- 11.1. Market Analysis, Insights and Forecast - by Satellite Mass
- 12. Competitive Analysis
- 12.1. Company Profiles
- 12.1.1 Space Exploration Technologies Corp
- 12.1.1.1. Company Overview
- 12.1.1.2. Products
- 12.1.1.3. Company Financials
- 12.1.1.4. SWOT Analysis
- 12.1.2 L3Harris Technologies Inc
- 12.1.2.1. Company Overview
- 12.1.2.2. Products
- 12.1.2.3. Company Financials
- 12.1.2.4. SWOT Analysis
- 12.1.3 Swarm Technologies Inc
- 12.1.3.1. Company Overview
- 12.1.3.2. Products
- 12.1.3.3. Company Financials
- 12.1.3.4. SWOT Analysis
- 12.1.4 Intelsat
- 12.1.4.1. Company Overview
- 12.1.4.2. Products
- 12.1.4.3. Company Financials
- 12.1.4.4. SWOT Analysis
- 12.1.5 Airbus SE
- 12.1.5.1. Company Overview
- 12.1.5.2. Products
- 12.1.5.3. Company Financials
- 12.1.5.4. SWOT Analysis
- 12.1.6 Viasat Inc
- 12.1.6.1. Company Overview
- 12.1.6.2. Products
- 12.1.6.3. Company Financials
- 12.1.6.4. SWOT Analysis
- 12.1.7 Cobham Limited
- 12.1.7.1. Company Overview
- 12.1.7.2. Products
- 12.1.7.3. Company Financials
- 12.1.7.4. SWOT Analysis
- 12.1.8 China Aerospace Science and Technology Corporation (CASC)
- 12.1.8.1. Company Overview
- 12.1.8.2. Products
- 12.1.8.3. Company Financials
- 12.1.8.4. SWOT Analysis
- 12.1.9 Thales
- 12.1.9.1. Company Overview
- 12.1.9.2. Products
- 12.1.9.3. Company Financials
- 12.1.9.4. SWOT Analysis
- 12.1.10 SKY Perfect JSAT Corporation
- 12.1.10.1. Company Overview
- 12.1.10.2. Products
- 12.1.10.3. Company Financials
- 12.1.10.4. SWOT Analysis
- 12.1.11 SES S A
- 12.1.11.1. Company Overview
- 12.1.11.2. Products
- 12.1.11.3. Company Financials
- 12.1.11.4. SWOT Analysis
- 12.1.12 Maxar Technologies Inc
- 12.1.12.1. Company Overview
- 12.1.12.2. Products
- 12.1.12.3. Company Financials
- 12.1.12.4. SWOT Analysis
- 12.1.13 Thuraya Telecommunications Company
- 12.1.13.1. Company Overview
- 12.1.13.2. Products
- 12.1.13.3. Company Financials
- 12.1.13.4. SWOT Analysis
- 12.1.14 EchoStar Corporation
- 12.1.14.1. Company Overview
- 12.1.14.2. Products
- 12.1.14.3. Company Financials
- 12.1.14.4. SWOT Analysis
- 12.1.1 Space Exploration Technologies Corp
- 12.2. Market Entropy
- 12.2.1 Company's Key Areas Served
- 12.2.2 Recent Developments
- 12.3. Company Market Share Analysis 2025
- 12.3.1 Top 5 Companies Market Share Analysis
- 12.3.2 Top 3 Companies Market Share Analysis
- 12.4. List of Potential Customers
- 13. Research Methodology
List of Figures
- Figure 1: Global SATCOM Industry Revenue Breakdown (billion, %) by Region 2025 & 2033
- Figure 2: North America SATCOM Industry Revenue (billion), by Satellite Mass 2025 & 2033
- Figure 3: North America SATCOM Industry Revenue Share (%), by Satellite Mass 2025 & 2033
- Figure 4: North America SATCOM Industry Revenue (billion), by Orbit Class 2025 & 2033
- Figure 5: North America SATCOM Industry Revenue Share (%), by Orbit Class 2025 & 2033
- Figure 6: North America SATCOM Industry Revenue (billion), by Communication Type 2025 & 2033
- Figure 7: North America SATCOM Industry Revenue Share (%), by Communication Type 2025 & 2033
- Figure 8: North America SATCOM Industry Revenue (billion), by End User 2025 & 2033
- Figure 9: North America SATCOM Industry Revenue Share (%), by End User 2025 & 2033
- Figure 10: North America SATCOM Industry Revenue (billion), by Country 2025 & 2033
- Figure 11: North America SATCOM Industry Revenue Share (%), by Country 2025 & 2033
- Figure 12: South America SATCOM Industry Revenue (billion), by Satellite Mass 2025 & 2033
- Figure 13: South America SATCOM Industry Revenue Share (%), by Satellite Mass 2025 & 2033
- Figure 14: South America SATCOM Industry Revenue (billion), by Orbit Class 2025 & 2033
- Figure 15: South America SATCOM Industry Revenue Share (%), by Orbit Class 2025 & 2033
- Figure 16: South America SATCOM Industry Revenue (billion), by Communication Type 2025 & 2033
- Figure 17: South America SATCOM Industry Revenue Share (%), by Communication Type 2025 & 2033
- Figure 18: South America SATCOM Industry Revenue (billion), by End User 2025 & 2033
- Figure 19: South America SATCOM Industry Revenue Share (%), by End User 2025 & 2033
- Figure 20: South America SATCOM Industry Revenue (billion), by Country 2025 & 2033
- Figure 21: South America SATCOM Industry Revenue Share (%), by Country 2025 & 2033
- Figure 22: Europe SATCOM Industry Revenue (billion), by Satellite Mass 2025 & 2033
- Figure 23: Europe SATCOM Industry Revenue Share (%), by Satellite Mass 2025 & 2033
- Figure 24: Europe SATCOM Industry Revenue (billion), by Orbit Class 2025 & 2033
- Figure 25: Europe SATCOM Industry Revenue Share (%), by Orbit Class 2025 & 2033
- Figure 26: Europe SATCOM Industry Revenue (billion), by Communication Type 2025 & 2033
- Figure 27: Europe SATCOM Industry Revenue Share (%), by Communication Type 2025 & 2033
- Figure 28: Europe SATCOM Industry Revenue (billion), by End User 2025 & 2033
- Figure 29: Europe SATCOM Industry Revenue Share (%), by End User 2025 & 2033
- Figure 30: Europe SATCOM Industry Revenue (billion), by Country 2025 & 2033
- Figure 31: Europe SATCOM Industry Revenue Share (%), by Country 2025 & 2033
- Figure 32: Middle East & Africa SATCOM Industry Revenue (billion), by Satellite Mass 2025 & 2033
- Figure 33: Middle East & Africa SATCOM Industry Revenue Share (%), by Satellite Mass 2025 & 2033
- Figure 34: Middle East & Africa SATCOM Industry Revenue (billion), by Orbit Class 2025 & 2033
- Figure 35: Middle East & Africa SATCOM Industry Revenue Share (%), by Orbit Class 2025 & 2033
- Figure 36: Middle East & Africa SATCOM Industry Revenue (billion), by Communication Type 2025 & 2033
- Figure 37: Middle East & Africa SATCOM Industry Revenue Share (%), by Communication Type 2025 & 2033
- Figure 38: Middle East & Africa SATCOM Industry Revenue (billion), by End User 2025 & 2033
- Figure 39: Middle East & Africa SATCOM Industry Revenue Share (%), by End User 2025 & 2033
- Figure 40: Middle East & Africa SATCOM Industry Revenue (billion), by Country 2025 & 2033
- Figure 41: Middle East & Africa SATCOM Industry Revenue Share (%), by Country 2025 & 2033
- Figure 42: Asia Pacific SATCOM Industry Revenue (billion), by Satellite Mass 2025 & 2033
- Figure 43: Asia Pacific SATCOM Industry Revenue Share (%), by Satellite Mass 2025 & 2033
- Figure 44: Asia Pacific SATCOM Industry Revenue (billion), by Orbit Class 2025 & 2033
- Figure 45: Asia Pacific SATCOM Industry Revenue Share (%), by Orbit Class 2025 & 2033
- Figure 46: Asia Pacific SATCOM Industry Revenue (billion), by Communication Type 2025 & 2033
- Figure 47: Asia Pacific SATCOM Industry Revenue Share (%), by Communication Type 2025 & 2033
- Figure 48: Asia Pacific SATCOM Industry Revenue (billion), by End User 2025 & 2033
- Figure 49: Asia Pacific SATCOM Industry Revenue Share (%), by End User 2025 & 2033
- Figure 50: Asia Pacific SATCOM Industry Revenue (billion), by Country 2025 & 2033
- Figure 51: Asia Pacific SATCOM Industry Revenue Share (%), by Country 2025 & 2033
List of Tables
- Table 1: Global SATCOM Industry Revenue billion Forecast, by Satellite Mass 2020 & 2033
- Table 2: Global SATCOM Industry Revenue billion Forecast, by Orbit Class 2020 & 2033
- Table 3: Global SATCOM Industry Revenue billion Forecast, by Communication Type 2020 & 2033
- Table 4: Global SATCOM Industry Revenue billion Forecast, by End User 2020 & 2033
- Table 5: Global SATCOM Industry Revenue billion Forecast, by Region 2020 & 2033
- Table 6: Global SATCOM Industry Revenue billion Forecast, by Satellite Mass 2020 & 2033
- Table 7: Global SATCOM Industry Revenue billion Forecast, by Orbit Class 2020 & 2033
- Table 8: Global SATCOM Industry Revenue billion Forecast, by Communication Type 2020 & 2033
- Table 9: Global SATCOM Industry Revenue billion Forecast, by End User 2020 & 2033
- Table 10: Global SATCOM Industry Revenue billion Forecast, by Country 2020 & 2033
- Table 11: United States SATCOM Industry Revenue (billion) Forecast, by Application 2020 & 2033
- Table 12: Canada SATCOM Industry Revenue (billion) Forecast, by Application 2020 & 2033
- Table 13: Mexico SATCOM Industry Revenue (billion) Forecast, by Application 2020 & 2033
- Table 14: Global SATCOM Industry Revenue billion Forecast, by Satellite Mass 2020 & 2033
- Table 15: Global SATCOM Industry Revenue billion Forecast, by Orbit Class 2020 & 2033
- Table 16: Global SATCOM Industry Revenue billion Forecast, by Communication Type 2020 & 2033
- Table 17: Global SATCOM Industry Revenue billion Forecast, by End User 2020 & 2033
- Table 18: Global SATCOM Industry Revenue billion Forecast, by Country 2020 & 2033
- Table 19: Brazil SATCOM Industry Revenue (billion) Forecast, by Application 2020 & 2033
- Table 20: Argentina SATCOM Industry Revenue (billion) Forecast, by Application 2020 & 2033
- Table 21: Rest of South America SATCOM Industry Revenue (billion) Forecast, by Application 2020 & 2033
- Table 22: Global SATCOM Industry Revenue billion Forecast, by Satellite Mass 2020 & 2033
- Table 23: Global SATCOM Industry Revenue billion Forecast, by Orbit Class 2020 & 2033
- Table 24: Global SATCOM Industry Revenue billion Forecast, by Communication Type 2020 & 2033
- Table 25: Global SATCOM Industry Revenue billion Forecast, by End User 2020 & 2033
- Table 26: Global SATCOM Industry Revenue billion Forecast, by Country 2020 & 2033
- Table 27: United Kingdom SATCOM Industry Revenue (billion) Forecast, by Application 2020 & 2033
- Table 28: Germany SATCOM Industry Revenue (billion) Forecast, by Application 2020 & 2033
- Table 29: France SATCOM Industry Revenue (billion) Forecast, by Application 2020 & 2033
- Table 30: Italy SATCOM Industry Revenue (billion) Forecast, by Application 2020 & 2033
- Table 31: Spain SATCOM Industry Revenue (billion) Forecast, by Application 2020 & 2033
- Table 32: Russia SATCOM Industry Revenue (billion) Forecast, by Application 2020 & 2033
- Table 33: Benelux SATCOM Industry Revenue (billion) Forecast, by Application 2020 & 2033
- Table 34: Nordics SATCOM Industry Revenue (billion) Forecast, by Application 2020 & 2033
- Table 35: Rest of Europe SATCOM Industry Revenue (billion) Forecast, by Application 2020 & 2033
- Table 36: Global SATCOM Industry Revenue billion Forecast, by Satellite Mass 2020 & 2033
- Table 37: Global SATCOM Industry Revenue billion Forecast, by Orbit Class 2020 & 2033
- Table 38: Global SATCOM Industry Revenue billion Forecast, by Communication Type 2020 & 2033
- Table 39: Global SATCOM Industry Revenue billion Forecast, by End User 2020 & 2033
- Table 40: Global SATCOM Industry Revenue billion Forecast, by Country 2020 & 2033
- Table 41: Turkey SATCOM Industry Revenue (billion) Forecast, by Application 2020 & 2033
- Table 42: Israel SATCOM Industry Revenue (billion) Forecast, by Application 2020 & 2033
- Table 43: GCC SATCOM Industry Revenue (billion) Forecast, by Application 2020 & 2033
- Table 44: North Africa SATCOM Industry Revenue (billion) Forecast, by Application 2020 & 2033
- Table 45: South Africa SATCOM Industry Revenue (billion) Forecast, by Application 2020 & 2033
- Table 46: Rest of Middle East & Africa SATCOM Industry Revenue (billion) Forecast, by Application 2020 & 2033
- Table 47: Global SATCOM Industry Revenue billion Forecast, by Satellite Mass 2020 & 2033
- Table 48: Global SATCOM Industry Revenue billion Forecast, by Orbit Class 2020 & 2033
- Table 49: Global SATCOM Industry Revenue billion Forecast, by Communication Type 2020 & 2033
- Table 50: Global SATCOM Industry Revenue billion Forecast, by End User 2020 & 2033
- Table 51: Global SATCOM Industry Revenue billion Forecast, by Country 2020 & 2033
- Table 52: China SATCOM Industry Revenue (billion) Forecast, by Application 2020 & 2033
- Table 53: India SATCOM Industry Revenue (billion) Forecast, by Application 2020 & 2033
- Table 54: Japan SATCOM Industry Revenue (billion) Forecast, by Application 2020 & 2033
- Table 55: South Korea SATCOM Industry Revenue (billion) Forecast, by Application 2020 & 2033
- Table 56: ASEAN SATCOM Industry Revenue (billion) Forecast, by Application 2020 & 2033
- Table 57: Oceania SATCOM Industry Revenue (billion) Forecast, by Application 2020 & 2033
- Table 58: Rest of Asia Pacific SATCOM Industry Revenue (billion) Forecast, by Application 2020 & 2033
Frequently Asked Questions
1. What is the projected Compound Annual Growth Rate (CAGR) of the SATCOM Industry?
The projected CAGR is approximately 11%.
2. Which companies are prominent players in the SATCOM Industry?
Key companies in the market include Space Exploration Technologies Corp, L3Harris Technologies Inc, Swarm Technologies Inc, Intelsat, Airbus SE, Viasat Inc, Cobham Limited, China Aerospace Science and Technology Corporation (CASC), Thales, SKY Perfect JSAT Corporation, SES S A, Maxar Technologies Inc, Thuraya Telecommunications Company, EchoStar Corporation.
3. What are the main segments of the SATCOM Industry?
The market segments include Satellite Mass, Orbit Class, Communication Type, End User.
4. Can you provide details about the market size?
The market size is estimated to be USD 98.28 billion as of 2022.
5. What are some drivers contributing to market growth?
N/A
6. What are the notable trends driving market growth?
OTHER KEY INDUSTRY TRENDS COVERED IN THE REPORT.
7. Are there any restraints impacting market growth?
N/A
8. Can you provide examples of recent developments in the market?
February 2023: Anuvu, a provider of high-speed connectivity solutions has signed an agreement with Telesat for new antennas and ground-station infrastructure to support the development of the Anuvu Constellation.February 2023: SES, in partnership with ThinKom and Hughes, has introduced a revolutionary high-performance multi-orbit service capable of supporting multiple solutions for government aerial missions. Open Architecture ThinKom ThinAir Ka2517 aerial satcom terminal has been successfully demonstrated on SES's Medium Earth Orbit (MEO) and Geostationary (GEO) satellite networksJanuary 2023: Satellite communications provider Viasat has been awarded a contract by the United States Marine Corps to provide end-to-end satellite communications support, extending the agreement under which it provides satellite communications solutions under managed services.
9. What pricing options are available for accessing the report?
Pricing options include single-user, multi-user, and enterprise licenses priced at USD 3800, USD 4500, and USD 5800 respectively.
10. Is the market size provided in terms of value or volume?
The market size is provided in terms of value, measured in billion.
11. Are there any specific market keywords associated with the report?
Yes, the market keyword associated with the report is "SATCOM Industry," which aids in identifying and referencing the specific market segment covered.
12. How do I determine which pricing option suits my needs best?
The pricing options vary based on user requirements and access needs. Individual users may opt for single-user licenses, while businesses requiring broader access may choose multi-user or enterprise licenses for cost-effective access to the report.
13. Are there any additional resources or data provided in the SATCOM Industry report?
While the report offers comprehensive insights, it's advisable to review the specific contents or supplementary materials provided to ascertain if additional resources or data are available.
14. How can I stay updated on further developments or reports in the SATCOM Industry?
To stay informed about further developments, trends, and reports in the SATCOM Industry, consider subscribing to industry newsletters, following relevant companies and organizations, or regularly checking reputable industry news sources and publications.
Methodology
Step 1 - Identification of Relevant Samples Size from Population Database


Step 2 - Approaches for Defining Global Market Size (Value, Volume* & Price*)

Note*: In applicable scenarios
Step 3 - Data Sources
Primary Research
- Web Analytics
- Survey Reports
- Research Institute
- Latest Research Reports
- Opinion Leaders
Secondary Research
- Annual Reports
- White Paper
- Latest Press Release
- Industry Association
- Paid Database
- Investor Presentations

Step 4 - Data Triangulation
Involves using different sources of information in order to increase the validity of a study
These sources are likely to be stakeholders in a program - participants, other researchers, program staff, other community members, and so on.
Then we put all data in single framework & apply various statistical tools to find out the dynamic on the market.
During the analysis stage, feedback from the stakeholder groups would be compared to determine areas of agreement as well as areas of divergence