

Key Insights
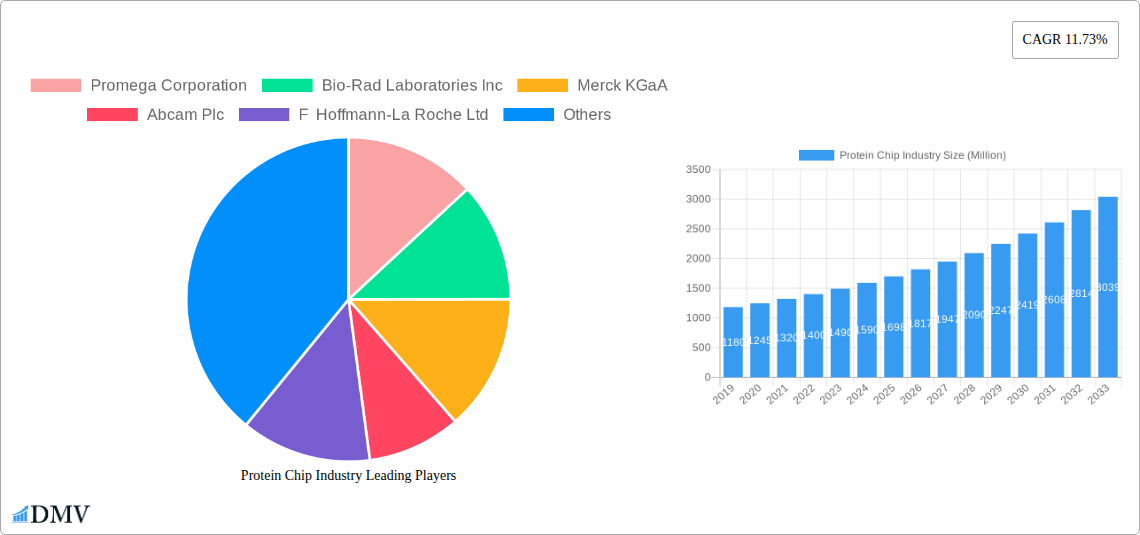
The global Protein Chip market is poised for significant expansion, projected to reach an estimated USD 2.03 billion in 2025, with a robust Compound Annual Growth Rate (CAGR) of 11.73% expected through 2033. This dynamic growth is fueled by the increasing demand for advanced diagnostic tools and a burgeoning drug discovery pipeline. Key drivers include the escalating prevalence of chronic diseases, the growing need for personalized medicine, and substantial investments in life science research and development by both government and private entities. Furthermore, technological advancements in protein analysis techniques and the expanding applications of protein chips in areas like biomarker discovery and proteomics are contributing to this upward trajectory. The market is characterized by a strong emphasis on innovation, with companies continually developing more sensitive, efficient, and cost-effective protein chip solutions.
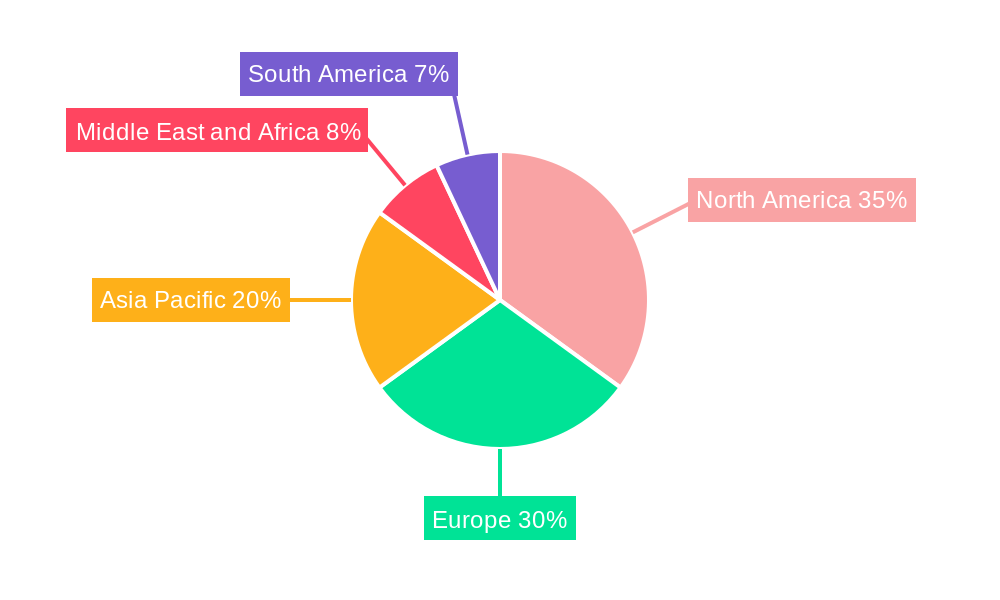
The market segmentation reveals a diverse landscape with significant opportunities across various product types, applications, and end-user industries. Kits and reagents represent a substantial segment, driven by their essential role in protein analysis workflows. The application segment is dominated by drug discovery and development, reflecting the critical need for high-throughput screening and target identification in the pharmaceutical sector. Disease diagnosis is another rapidly growing application, as protein chips offer promising avenues for early detection and monitoring of various ailments. Pharmaceutical and biotechnology industries, along with hospitals and clinics, are the primary end-users, leveraging protein chip technologies for research, diagnostics, and therapeutic development. Geographically, North America and Europe are expected to lead the market, owing to well-established healthcare infrastructure, significant R&D spending, and a strong presence of key market players. However, the Asia Pacific region is anticipated to witness the fastest growth, driven by increasing healthcare expenditure, a rising burden of diseases, and expanding research initiatives.
Protein Chip Industry Market Composition & Trends
The global protein chip market analysis reveals a moderately concentrated landscape, driven by significant R&D investments and a growing demand for personalized medicine. Key players like Thermo Fisher Scientific, Danaher Corporation, and F Hoffmann-La Roche Ltd hold substantial market share, with innovation catalysts stemming from advancements in proteomics, mass spectrometry, and microfluidics. Regulatory landscapes, particularly stringent FDA approvals for diagnostic applications, present both opportunities and challenges. Substitute products, such as traditional ELISA assays and western blotting, continue to coexist, but protein chips offer superior throughput and sensitivity. End-user profiles are dominated by pharmaceutical and biotechnology industries, with hospitals and clinics increasingly adopting these technologies for disease diagnosis. Mergers and acquisitions are a significant trend, with recent deal values exceeding several hundred million dollars, indicating strategic consolidation and expansion to enhance product portfolios and market reach. The market share distribution is dynamic, with top 5 players accounting for approximately 65% of the market in 2025. M&A deal values are projected to reach over $1.5 Billion by 2033.
Protein Chip Industry Industry Evolution
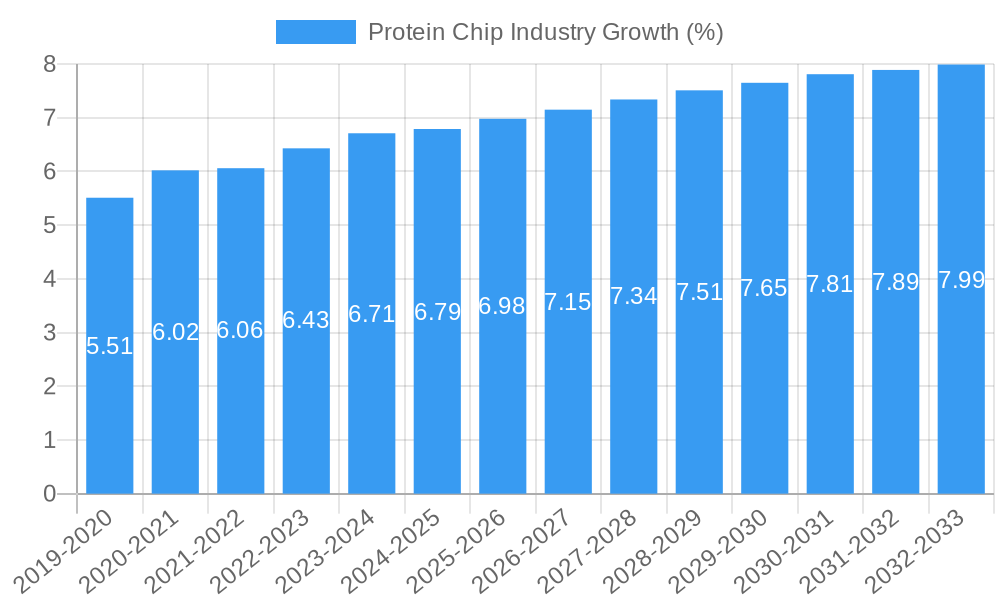
The protein chip industry has witnessed remarkable evolution over the historical period of 2019–2024 and is poised for substantial growth through the forecast period of 2025–2033, with the base and estimated year set at 2025. This growth trajectory is primarily fueled by relentless technological advancements and a deepening understanding of protein functions in health and disease. Early in the study period, protein chips were predominantly used in academic research for target identification and validation. However, with the maturation of the technology and improved assay sensitivity, their application has broadened significantly into drug discovery and development, and increasingly into clinical diagnostics.
The market growth has been characterized by a compound annual growth rate (CAGR) of approximately 10.5% from 2019 to 2024, with projections indicating a sustained CAGR of 12.2% from 2025 to 2033. This acceleration is attributed to several factors. Firstly, the increasing prevalence of chronic diseases like cancer, cardiovascular diseases, and neurological disorders has created a critical need for more efficient and accurate diagnostic tools, a niche where protein chips excel. The ability to detect biomarkers at very low concentrations provides early disease detection, enabling timely intervention and improved patient outcomes.
Technological advancements have been pivotal. The integration of artificial intelligence (AI) and machine learning (ML) with protein chip data analysis is revolutionizing the interpretation of complex proteomic profiles. High-throughput screening capabilities are being enhanced through miniaturization and automation, leading to reduced assay times and costs. Furthermore, the development of novel materials for chip fabrication and improved antibody and aptamer immobilization techniques have boosted assay specificity and sensitivity. Adoption metrics for protein chips in drug discovery have risen by an estimated 30% since 2019, reflecting their growing importance in identifying lead compounds and understanding drug mechanisms of action.
Shifting consumer demands, particularly the push towards personalized medicine, have further propelled the industry. Patients and healthcare providers are seeking tailored treatment strategies based on individual biological profiles. Protein chips, by enabling the analysis of a wide range of proteins simultaneously, are instrumental in deciphering these individual variations, leading to the development of personalized therapies. The "Other Applications" segment, which includes areas like food safety testing and environmental monitoring, is also experiencing steady growth, albeit at a slower pace than the core healthcare applications. The overall market size, estimated at $3.8 Billion in 2025, is projected to reach $9.5 Billion by 2033, underscoring the significant expansion and evolving role of protein chip technology in the global scientific and healthcare landscape.
Leading Regions, Countries, or Segments in Protein Chip Industry
The Pharmaceutical and Biotechnology Industries are unequivocally the leading end-user segment within the protein chip industry, driving the majority of market demand and innovation. This dominance is a direct consequence of the indispensable role protein chips play in modern drug discovery and development pipelines, as well as in the creation of novel biopharmaceuticals. Their ability to rapidly screen and analyze thousands of proteins simultaneously makes them invaluable tools for target identification, validation, lead optimization, and biomarker discovery.
- Key Drivers for Pharmaceutical and Biotechnology Industries Dominance:
- High R&D Expenditure: These industries allocate substantial budgets towards research and development, with a significant portion dedicated to advanced analytical technologies like protein chips.
- Need for Precision and Speed: The competitive nature of drug development necessitates faster and more accurate identification of therapeutic targets and potential drug candidates. Protein chips deliver on both fronts.
- Biomarker Discovery and Validation: Protein chips are crucial for identifying and validating protein biomarkers for disease diagnosis, prognosis, and predicting treatment response, aligning with the growing trend of personalized medicine.
- Regulatory Requirements: Increasingly stringent regulatory demands for comprehensive pre-clinical and clinical data further necessitate the use of high-throughput, sensitive analytical methods.
In terms of Product Type, Kits represent the most significant segment. This is because protein chip kits often integrate all the necessary reagents, consumables, and protocols for specific applications, making them user-friendly and accessible for a wide range of laboratories, from academic institutions to industrial R&D departments. These kits streamline experimental workflows, reduce setup time, and ensure reproducibility, thereby fostering wider adoption.
- Key Drivers for Kit Segment Dominance:
- Ease of Use and Accessibility: Pre-packaged kits lower the barrier to entry for complex proteomic analyses.
- Standardization and Reproducibility: Kits are designed for consistency, ensuring reliable results across different experiments and users.
- Application-Specific Solutions: A broad array of kits are available for various applications, from disease biomarker profiling to drug screening, catering to diverse research needs.
- Cost-Effectiveness for Specific Tasks: While instruments represent a significant upfront investment, kits offer a more cost-effective solution for routine or specific analytical tasks.
Geographically, North America consistently emerges as the leading region, driven by its robust pharmaceutical and biotechnology sector, extensive academic research infrastructure, and substantial government funding for life sciences research. The presence of major biotechnology hubs, venture capital investments in emerging life science companies, and a proactive regulatory environment contribute to its market leadership.
- Key Drivers for North American Leadership:
- Concentration of Pharmaceutical and Biotech Companies: Home to numerous global R&D centers.
- Significant Research Funding: Strong government and private investment in life sciences.
- Technological Innovation Hubs: Proximity to leading universities and research institutions.
- Favorable Regulatory Environment: Streamlined approval processes for innovative technologies in healthcare.
While Disease Diagnosis represents a rapidly growing application, Drug Discovery and Development currently commands the largest share within the application segment. This is due to the extensive use of protein chips in the early stages of pharmaceutical R&D, where identifying and validating novel drug targets is paramount. The complexity and cost of drug development naturally lead to a higher demand for advanced analytical tools that can accelerate these processes.
- Key Drivers for Drug Discovery and Development Application Dominance:
- High Demand for Novel Therapeutics: The continuous need for new treatments for unmet medical needs fuels intensive drug discovery efforts.
- Efficiency in Target Identification: Protein chips enable the screening of vast numbers of proteins to pinpoint potential drug targets quickly.
- Understanding Disease Mechanisms: Analyzing protein expression profiles provides critical insights into disease pathogenesis, guiding drug development strategies.
- Biomarker Identification for Efficacy and Safety: Protein chips aid in identifying biomarkers that predict drug efficacy and potential side effects.
In summary, the pharmaceutical and biotechnology industries, driven by the need for efficient drug discovery and development and facilitated by user-friendly protein chip kits, will continue to be the primary engine of growth, with North America leading the charge.
Protein Chip Industry Product Innovations
Product innovation in the protein chip industry is characterized by enhanced sensitivity, multiplexing capabilities, and integration with advanced data analytics. Companies are focusing on developing novel chip surfaces for improved protein immobilization and reduced non-specific binding, leading to higher signal-to-noise ratios and the detection of even trace biomarkers. Innovations in microfluidics are enabling smaller sample volumes and faster assay times, crucial for point-of-care diagnostics and high-throughput screening. Furthermore, the integration of artificial intelligence and machine learning algorithms with protein chip data analysis is a significant advancement, allowing for deeper biological insights and more accurate disease prognostication. Performance metrics like detection limits have seen continuous improvement, with some platforms now achieving attomolar sensitivity.
Propelling Factors for Protein Chip Industry Growth
Several key factors are propelling the growth of the protein chip industry. The relentless pursuit of personalized medicine, which demands precise analysis of individual protein profiles, is a primary driver. Advances in proteomics and mass spectrometry technologies have significantly enhanced the sensitivity and throughput of protein analysis, making protein chips more attractive. The increasing prevalence of chronic diseases like cancer and neurological disorders necessitates early and accurate diagnosis, a role where protein chips excel by detecting specific biomarkers. Furthermore, substantial investments in pharmaceutical R&D and a growing demand for novel drug targets are fueling the adoption of protein chip technologies for drug discovery and development. Regulatory bodies are also increasingly recognizing the value of these technologies for diagnostic applications, fostering market expansion.
Obstacles in the Protein Chip Industry Market
Despite its promising growth, the protein chip industry faces several obstacles. The high upfront cost of sophisticated protein chip instruments can be a significant barrier to adoption, especially for smaller research institutions and clinics. Stringent regulatory approval processes for novel diagnostic applications, particularly in the US and Europe, can lead to lengthy development timelines and increased expenditure. Standardization of protocols and data analysis across different platforms remains a challenge, impacting the reproducibility and comparability of results. Furthermore, the availability of skilled personnel capable of operating complex protein chip systems and interpreting the resulting proteomic data can be limited. Supply chain disruptions for critical components and reagents can also impact production and delivery schedules.
Future Opportunities in Protein Chip Industry
The future of the protein chip industry is rife with opportunities. The expansion of protein chip applications into emerging areas like liquid biopsies for non-invasive cancer detection presents a significant growth avenue. Advancements in nanotechnology and material science are paving the way for highly sensitive and miniaturized protein chip devices, potentially enabling point-of-care diagnostics. The increasing integration of artificial intelligence and machine learning with protein chip data analysis offers opportunities for predictive diagnostics and personalized treatment strategies. Furthermore, the growing demand for protein-based therapeutics, particularly in areas like antibody engineering and protein replacement therapy, will continue to drive the need for advanced protein analysis tools. Collaborations between academic institutions and industry players can accelerate the translation of research discoveries into commercially viable products.
Major Players in the Protein Chip Industry Ecosystem
- Promega Corporation
- Bio-Rad Laboratories Inc
- Merck KGaA
- Abcam Plc
- F Hoffmann-La Roche Ltd
- Cell Signaling Technology Inc
- Danaher Corporation
- Qiagen
- PerkinElmer Inc
- Thermo Fisher Scientific
Key Developments in Protein Chip Industry Industry
- March 2022: Biognosys launched an expanded suite of proteomics platforms, providing pharmaceutical and diagnostics customers with deep biological insights across the entire R&D pipeline, from early-stage discovery to clinical settings.
- January 2022: Amgen entered into a partnership with Generate Biomedicines to discover and create protein therapeutics for five targets across several therapeutic areas and multiple modalities with an early investment of USD 1.9 billion-plus.
Strategic Protein Chip Industry Market Forecast
The strategic protein chip market forecast is exceptionally positive, driven by the confluence of technological innovation and escalating healthcare needs. The continuous demand for more precise and early disease diagnostics, coupled with the pharmaceutical industry's insatiable quest for novel drug targets, will sustain robust market expansion. Emerging opportunities in areas like liquid biopsies and the integration of AI for predictive analytics are poised to unlock significant value. The market is expected to witness sustained double-digit growth, fueled by increasing R&D investments and a growing global emphasis on personalized medicine. Strategic collaborations and advancements in chip miniaturization will further solidify the protein chip industry's indispensable role in future healthcare and scientific research.
Protein Chip Industry Segmentation
-
1. Product Type
- 1.1. Kits
- 1.2. Reagents
- 1.3. Instruments and Accessories
-
2. Application
- 2.1. Drug Discovery and Development
- 2.2. Disease Diagnosis
- 2.3. Other Applications
-
3. End User
- 3.1. Pharmaceutical and Biotechnology Industries
- 3.2. Hospitals and Clinics
- 3.3. Other End Users
Protein Chip Industry Segmentation By Geography
-
1. North America
- 1.1. United States
- 1.2. Canada
- 1.3. Mexico
-
2. Europe
- 2.1. Germany
- 2.2. United Kingdom
- 2.3. France
- 2.4. Italy
- 2.5. Spain
- 2.6. Rest of Europe
-
3. Asia Pacific
- 3.1. China
- 3.2. Japan
- 3.3. India
- 3.4. Australia
- 3.5. South Korea
- 3.6. Rest of Asia Pacific
-
4. Middle East and Africa
- 4.1. GCC
- 4.2. South Africa
- 4.3. Rest of Middle East and Africa
-
5. South America
- 5.1. Brazil
- 5.2. Argentina
- 5.3. Rest of South America
Protein Chip Industry REPORT HIGHLIGHTS
| Aspects | Details |
|---|---|
| Study Period | 2019-2033 |
| Base Year | 2024 |
| Estimated Year | 2025 |
| Forecast Period | 2025-2033 |
| Historical Period | 2019-2024 |
| Growth Rate | CAGR of 11.73% from 2019-2033 |
| Segmentation |
|
Table of Contents
- 1. Introduction
- 1.1. Research Scope
- 1.2. Market Segmentation
- 1.3. Research Methodology
- 1.4. Definitions and Assumptions
- 2. Executive Summary
- 2.1. Introduction
- 3. Market Dynamics
- 3.1. Introduction
- 3.2. Market Drivers
- 3.2.1. Increasing Incidence of Chronic and Infectious Diseases; Technological Advancements in Protein Assay Techniques; Increasing Expenditure on Pharmaceutical and Biological Research and Development
- 3.3. Market Restrains
- 3.3.1. High Cost of Multiplex Assay Equipment
- 3.4. Market Trends
- 3.4.1. Drug Discovery and Development Segment is Expected to Hold a Significant Share in the Protein Assay Market during the Forecast Period of the Study
- 4. Market Factor Analysis
- 4.1. Porters Five Forces
- 4.2. Supply/Value Chain
- 4.3. PESTEL analysis
- 4.4. Market Entropy
- 4.5. Patent/Trademark Analysis
- 5. Global Protein Chip Industry Analysis, Insights and Forecast, 2019-2031
- 5.1. Market Analysis, Insights and Forecast - by Product Type
- 5.1.1. Kits
- 5.1.2. Reagents
- 5.1.3. Instruments and Accessories
- 5.2. Market Analysis, Insights and Forecast - by Application
- 5.2.1. Drug Discovery and Development
- 5.2.2. Disease Diagnosis
- 5.2.3. Other Applications
- 5.3. Market Analysis, Insights and Forecast - by End User
- 5.3.1. Pharmaceutical and Biotechnology Industries
- 5.3.2. Hospitals and Clinics
- 5.3.3. Other End Users
- 5.4. Market Analysis, Insights and Forecast - by Region
- 5.4.1. North America
- 5.4.2. Europe
- 5.4.3. Asia Pacific
- 5.4.4. Middle East and Africa
- 5.4.5. South America
- 5.1. Market Analysis, Insights and Forecast - by Product Type
- 6. North America Protein Chip Industry Analysis, Insights and Forecast, 2019-2031
- 6.1. Market Analysis, Insights and Forecast - by Product Type
- 6.1.1. Kits
- 6.1.2. Reagents
- 6.1.3. Instruments and Accessories
- 6.2. Market Analysis, Insights and Forecast - by Application
- 6.2.1. Drug Discovery and Development
- 6.2.2. Disease Diagnosis
- 6.2.3. Other Applications
- 6.3. Market Analysis, Insights and Forecast - by End User
- 6.3.1. Pharmaceutical and Biotechnology Industries
- 6.3.2. Hospitals and Clinics
- 6.3.3. Other End Users
- 6.1. Market Analysis, Insights and Forecast - by Product Type
- 7. Europe Protein Chip Industry Analysis, Insights and Forecast, 2019-2031
- 7.1. Market Analysis, Insights and Forecast - by Product Type
- 7.1.1. Kits
- 7.1.2. Reagents
- 7.1.3. Instruments and Accessories
- 7.2. Market Analysis, Insights and Forecast - by Application
- 7.2.1. Drug Discovery and Development
- 7.2.2. Disease Diagnosis
- 7.2.3. Other Applications
- 7.3. Market Analysis, Insights and Forecast - by End User
- 7.3.1. Pharmaceutical and Biotechnology Industries
- 7.3.2. Hospitals and Clinics
- 7.3.3. Other End Users
- 7.1. Market Analysis, Insights and Forecast - by Product Type
- 8. Asia Pacific Protein Chip Industry Analysis, Insights and Forecast, 2019-2031
- 8.1. Market Analysis, Insights and Forecast - by Product Type
- 8.1.1. Kits
- 8.1.2. Reagents
- 8.1.3. Instruments and Accessories
- 8.2. Market Analysis, Insights and Forecast - by Application
- 8.2.1. Drug Discovery and Development
- 8.2.2. Disease Diagnosis
- 8.2.3. Other Applications
- 8.3. Market Analysis, Insights and Forecast - by End User
- 8.3.1. Pharmaceutical and Biotechnology Industries
- 8.3.2. Hospitals and Clinics
- 8.3.3. Other End Users
- 8.1. Market Analysis, Insights and Forecast - by Product Type
- 9. Middle East and Africa Protein Chip Industry Analysis, Insights and Forecast, 2019-2031
- 9.1. Market Analysis, Insights and Forecast - by Product Type
- 9.1.1. Kits
- 9.1.2. Reagents
- 9.1.3. Instruments and Accessories
- 9.2. Market Analysis, Insights and Forecast - by Application
- 9.2.1. Drug Discovery and Development
- 9.2.2. Disease Diagnosis
- 9.2.3. Other Applications
- 9.3. Market Analysis, Insights and Forecast - by End User
- 9.3.1. Pharmaceutical and Biotechnology Industries
- 9.3.2. Hospitals and Clinics
- 9.3.3. Other End Users
- 9.1. Market Analysis, Insights and Forecast - by Product Type
- 10. South America Protein Chip Industry Analysis, Insights and Forecast, 2019-2031
- 10.1. Market Analysis, Insights and Forecast - by Product Type
- 10.1.1. Kits
- 10.1.2. Reagents
- 10.1.3. Instruments and Accessories
- 10.2. Market Analysis, Insights and Forecast - by Application
- 10.2.1. Drug Discovery and Development
- 10.2.2. Disease Diagnosis
- 10.2.3. Other Applications
- 10.3. Market Analysis, Insights and Forecast - by End User
- 10.3.1. Pharmaceutical and Biotechnology Industries
- 10.3.2. Hospitals and Clinics
- 10.3.3. Other End Users
- 10.1. Market Analysis, Insights and Forecast - by Product Type
- 11. North America Protein Chip Industry Analysis, Insights and Forecast, 2019-2031
- 11.1. Market Analysis, Insights and Forecast - By Country/Sub-region
- 11.1.1 United States
- 11.1.2 Canada
- 11.1.3 Mexico
- 12. Europe Protein Chip Industry Analysis, Insights and Forecast, 2019-2031
- 12.1. Market Analysis, Insights and Forecast - By Country/Sub-region
- 12.1.1 Germany
- 12.1.2 United Kingdom
- 12.1.3 France
- 12.1.4 Italy
- 12.1.5 Spain
- 12.1.6 Rest of Europe
- 13. Asia Pacific Protein Chip Industry Analysis, Insights and Forecast, 2019-2031
- 13.1. Market Analysis, Insights and Forecast - By Country/Sub-region
- 13.1.1 China
- 13.1.2 Japan
- 13.1.3 India
- 13.1.4 Australia
- 13.1.5 South Korea
- 13.1.6 Rest of Asia Pacific
- 14. Middle East and Africa Protein Chip Industry Analysis, Insights and Forecast, 2019-2031
- 14.1. Market Analysis, Insights and Forecast - By Country/Sub-region
- 14.1.1 GCC
- 14.1.2 South Africa
- 14.1.3 Rest of Middle East and Africa
- 15. South America Protein Chip Industry Analysis, Insights and Forecast, 2019-2031
- 15.1. Market Analysis, Insights and Forecast - By Country/Sub-region
- 15.1.1 Brazil
- 15.1.2 Argentina
- 15.1.3 Rest of South America
- 16. Competitive Analysis
- 16.1. Global Market Share Analysis 2024
- 16.2. Company Profiles
- 16.2.1 Promega Corporation
- 16.2.1.1. Overview
- 16.2.1.2. Products
- 16.2.1.3. SWOT Analysis
- 16.2.1.4. Recent Developments
- 16.2.1.5. Financials (Based on Availability)
- 16.2.2 Bio-Rad Laboratories Inc
- 16.2.2.1. Overview
- 16.2.2.2. Products
- 16.2.2.3. SWOT Analysis
- 16.2.2.4. Recent Developments
- 16.2.2.5. Financials (Based on Availability)
- 16.2.3 Merck KGaA
- 16.2.3.1. Overview
- 16.2.3.2. Products
- 16.2.3.3. SWOT Analysis
- 16.2.3.4. Recent Developments
- 16.2.3.5. Financials (Based on Availability)
- 16.2.4 Abcam Plc
- 16.2.4.1. Overview
- 16.2.4.2. Products
- 16.2.4.3. SWOT Analysis
- 16.2.4.4. Recent Developments
- 16.2.4.5. Financials (Based on Availability)
- 16.2.5 F Hoffmann-La Roche Ltd
- 16.2.5.1. Overview
- 16.2.5.2. Products
- 16.2.5.3. SWOT Analysis
- 16.2.5.4. Recent Developments
- 16.2.5.5. Financials (Based on Availability)
- 16.2.6 Cell Signaling Technology Inc
- 16.2.6.1. Overview
- 16.2.6.2. Products
- 16.2.6.3. SWOT Analysis
- 16.2.6.4. Recent Developments
- 16.2.6.5. Financials (Based on Availability)
- 16.2.7 Danaher Corporation
- 16.2.7.1. Overview
- 16.2.7.2. Products
- 16.2.7.3. SWOT Analysis
- 16.2.7.4. Recent Developments
- 16.2.7.5. Financials (Based on Availability)
- 16.2.8 Qiagen
- 16.2.8.1. Overview
- 16.2.8.2. Products
- 16.2.8.3. SWOT Analysis
- 16.2.8.4. Recent Developments
- 16.2.8.5. Financials (Based on Availability)
- 16.2.9 PerkinElmer Inc
- 16.2.9.1. Overview
- 16.2.9.2. Products
- 16.2.9.3. SWOT Analysis
- 16.2.9.4. Recent Developments
- 16.2.9.5. Financials (Based on Availability)
- 16.2.10 Thermo Fisher Scientific
- 16.2.10.1. Overview
- 16.2.10.2. Products
- 16.2.10.3. SWOT Analysis
- 16.2.10.4. Recent Developments
- 16.2.10.5. Financials (Based on Availability)
- 16.2.1 Promega Corporation
List of Figures
- Figure 1: Global Protein Chip Industry Revenue Breakdown (Million, %) by Region 2024 & 2032
- Figure 2: Global Protein Chip Industry Volume Breakdown (K Unit, %) by Region 2024 & 2032
- Figure 3: North America Protein Chip Industry Revenue (Million), by Country 2024 & 2032
- Figure 4: North America Protein Chip Industry Volume (K Unit), by Country 2024 & 2032
- Figure 5: North America Protein Chip Industry Revenue Share (%), by Country 2024 & 2032
- Figure 6: North America Protein Chip Industry Volume Share (%), by Country 2024 & 2032
- Figure 7: Europe Protein Chip Industry Revenue (Million), by Country 2024 & 2032
- Figure 8: Europe Protein Chip Industry Volume (K Unit), by Country 2024 & 2032
- Figure 9: Europe Protein Chip Industry Revenue Share (%), by Country 2024 & 2032
- Figure 10: Europe Protein Chip Industry Volume Share (%), by Country 2024 & 2032
- Figure 11: Asia Pacific Protein Chip Industry Revenue (Million), by Country 2024 & 2032
- Figure 12: Asia Pacific Protein Chip Industry Volume (K Unit), by Country 2024 & 2032
- Figure 13: Asia Pacific Protein Chip Industry Revenue Share (%), by Country 2024 & 2032
- Figure 14: Asia Pacific Protein Chip Industry Volume Share (%), by Country 2024 & 2032
- Figure 15: Middle East and Africa Protein Chip Industry Revenue (Million), by Country 2024 & 2032
- Figure 16: Middle East and Africa Protein Chip Industry Volume (K Unit), by Country 2024 & 2032
- Figure 17: Middle East and Africa Protein Chip Industry Revenue Share (%), by Country 2024 & 2032
- Figure 18: Middle East and Africa Protein Chip Industry Volume Share (%), by Country 2024 & 2032
- Figure 19: South America Protein Chip Industry Revenue (Million), by Country 2024 & 2032
- Figure 20: South America Protein Chip Industry Volume (K Unit), by Country 2024 & 2032
- Figure 21: South America Protein Chip Industry Revenue Share (%), by Country 2024 & 2032
- Figure 22: South America Protein Chip Industry Volume Share (%), by Country 2024 & 2032
- Figure 23: North America Protein Chip Industry Revenue (Million), by Product Type 2024 & 2032
- Figure 24: North America Protein Chip Industry Volume (K Unit), by Product Type 2024 & 2032
- Figure 25: North America Protein Chip Industry Revenue Share (%), by Product Type 2024 & 2032
- Figure 26: North America Protein Chip Industry Volume Share (%), by Product Type 2024 & 2032
- Figure 27: North America Protein Chip Industry Revenue (Million), by Application 2024 & 2032
- Figure 28: North America Protein Chip Industry Volume (K Unit), by Application 2024 & 2032
- Figure 29: North America Protein Chip Industry Revenue Share (%), by Application 2024 & 2032
- Figure 30: North America Protein Chip Industry Volume Share (%), by Application 2024 & 2032
- Figure 31: North America Protein Chip Industry Revenue (Million), by End User 2024 & 2032
- Figure 32: North America Protein Chip Industry Volume (K Unit), by End User 2024 & 2032
- Figure 33: North America Protein Chip Industry Revenue Share (%), by End User 2024 & 2032
- Figure 34: North America Protein Chip Industry Volume Share (%), by End User 2024 & 2032
- Figure 35: North America Protein Chip Industry Revenue (Million), by Country 2024 & 2032
- Figure 36: North America Protein Chip Industry Volume (K Unit), by Country 2024 & 2032
- Figure 37: North America Protein Chip Industry Revenue Share (%), by Country 2024 & 2032
- Figure 38: North America Protein Chip Industry Volume Share (%), by Country 2024 & 2032
- Figure 39: Europe Protein Chip Industry Revenue (Million), by Product Type 2024 & 2032
- Figure 40: Europe Protein Chip Industry Volume (K Unit), by Product Type 2024 & 2032
- Figure 41: Europe Protein Chip Industry Revenue Share (%), by Product Type 2024 & 2032
- Figure 42: Europe Protein Chip Industry Volume Share (%), by Product Type 2024 & 2032
- Figure 43: Europe Protein Chip Industry Revenue (Million), by Application 2024 & 2032
- Figure 44: Europe Protein Chip Industry Volume (K Unit), by Application 2024 & 2032
- Figure 45: Europe Protein Chip Industry Revenue Share (%), by Application 2024 & 2032
- Figure 46: Europe Protein Chip Industry Volume Share (%), by Application 2024 & 2032
- Figure 47: Europe Protein Chip Industry Revenue (Million), by End User 2024 & 2032
- Figure 48: Europe Protein Chip Industry Volume (K Unit), by End User 2024 & 2032
- Figure 49: Europe Protein Chip Industry Revenue Share (%), by End User 2024 & 2032
- Figure 50: Europe Protein Chip Industry Volume Share (%), by End User 2024 & 2032
- Figure 51: Europe Protein Chip Industry Revenue (Million), by Country 2024 & 2032
- Figure 52: Europe Protein Chip Industry Volume (K Unit), by Country 2024 & 2032
- Figure 53: Europe Protein Chip Industry Revenue Share (%), by Country 2024 & 2032
- Figure 54: Europe Protein Chip Industry Volume Share (%), by Country 2024 & 2032
- Figure 55: Asia Pacific Protein Chip Industry Revenue (Million), by Product Type 2024 & 2032
- Figure 56: Asia Pacific Protein Chip Industry Volume (K Unit), by Product Type 2024 & 2032
- Figure 57: Asia Pacific Protein Chip Industry Revenue Share (%), by Product Type 2024 & 2032
- Figure 58: Asia Pacific Protein Chip Industry Volume Share (%), by Product Type 2024 & 2032
- Figure 59: Asia Pacific Protein Chip Industry Revenue (Million), by Application 2024 & 2032
- Figure 60: Asia Pacific Protein Chip Industry Volume (K Unit), by Application 2024 & 2032
- Figure 61: Asia Pacific Protein Chip Industry Revenue Share (%), by Application 2024 & 2032
- Figure 62: Asia Pacific Protein Chip Industry Volume Share (%), by Application 2024 & 2032
- Figure 63: Asia Pacific Protein Chip Industry Revenue (Million), by End User 2024 & 2032
- Figure 64: Asia Pacific Protein Chip Industry Volume (K Unit), by End User 2024 & 2032
- Figure 65: Asia Pacific Protein Chip Industry Revenue Share (%), by End User 2024 & 2032
- Figure 66: Asia Pacific Protein Chip Industry Volume Share (%), by End User 2024 & 2032
- Figure 67: Asia Pacific Protein Chip Industry Revenue (Million), by Country 2024 & 2032
- Figure 68: Asia Pacific Protein Chip Industry Volume (K Unit), by Country 2024 & 2032
- Figure 69: Asia Pacific Protein Chip Industry Revenue Share (%), by Country 2024 & 2032
- Figure 70: Asia Pacific Protein Chip Industry Volume Share (%), by Country 2024 & 2032
- Figure 71: Middle East and Africa Protein Chip Industry Revenue (Million), by Product Type 2024 & 2032
- Figure 72: Middle East and Africa Protein Chip Industry Volume (K Unit), by Product Type 2024 & 2032
- Figure 73: Middle East and Africa Protein Chip Industry Revenue Share (%), by Product Type 2024 & 2032
- Figure 74: Middle East and Africa Protein Chip Industry Volume Share (%), by Product Type 2024 & 2032
- Figure 75: Middle East and Africa Protein Chip Industry Revenue (Million), by Application 2024 & 2032
- Figure 76: Middle East and Africa Protein Chip Industry Volume (K Unit), by Application 2024 & 2032
- Figure 77: Middle East and Africa Protein Chip Industry Revenue Share (%), by Application 2024 & 2032
- Figure 78: Middle East and Africa Protein Chip Industry Volume Share (%), by Application 2024 & 2032
- Figure 79: Middle East and Africa Protein Chip Industry Revenue (Million), by End User 2024 & 2032
- Figure 80: Middle East and Africa Protein Chip Industry Volume (K Unit), by End User 2024 & 2032
- Figure 81: Middle East and Africa Protein Chip Industry Revenue Share (%), by End User 2024 & 2032
- Figure 82: Middle East and Africa Protein Chip Industry Volume Share (%), by End User 2024 & 2032
- Figure 83: Middle East and Africa Protein Chip Industry Revenue (Million), by Country 2024 & 2032
- Figure 84: Middle East and Africa Protein Chip Industry Volume (K Unit), by Country 2024 & 2032
- Figure 85: Middle East and Africa Protein Chip Industry Revenue Share (%), by Country 2024 & 2032
- Figure 86: Middle East and Africa Protein Chip Industry Volume Share (%), by Country 2024 & 2032
- Figure 87: South America Protein Chip Industry Revenue (Million), by Product Type 2024 & 2032
- Figure 88: South America Protein Chip Industry Volume (K Unit), by Product Type 2024 & 2032
- Figure 89: South America Protein Chip Industry Revenue Share (%), by Product Type 2024 & 2032
- Figure 90: South America Protein Chip Industry Volume Share (%), by Product Type 2024 & 2032
- Figure 91: South America Protein Chip Industry Revenue (Million), by Application 2024 & 2032
- Figure 92: South America Protein Chip Industry Volume (K Unit), by Application 2024 & 2032
- Figure 93: South America Protein Chip Industry Revenue Share (%), by Application 2024 & 2032
- Figure 94: South America Protein Chip Industry Volume Share (%), by Application 2024 & 2032
- Figure 95: South America Protein Chip Industry Revenue (Million), by End User 2024 & 2032
- Figure 96: South America Protein Chip Industry Volume (K Unit), by End User 2024 & 2032
- Figure 97: South America Protein Chip Industry Revenue Share (%), by End User 2024 & 2032
- Figure 98: South America Protein Chip Industry Volume Share (%), by End User 2024 & 2032
- Figure 99: South America Protein Chip Industry Revenue (Million), by Country 2024 & 2032
- Figure 100: South America Protein Chip Industry Volume (K Unit), by Country 2024 & 2032
- Figure 101: South America Protein Chip Industry Revenue Share (%), by Country 2024 & 2032
- Figure 102: South America Protein Chip Industry Volume Share (%), by Country 2024 & 2032
List of Tables
- Table 1: Global Protein Chip Industry Revenue Million Forecast, by Region 2019 & 2032
- Table 2: Global Protein Chip Industry Volume K Unit Forecast, by Region 2019 & 2032
- Table 3: Global Protein Chip Industry Revenue Million Forecast, by Product Type 2019 & 2032
- Table 4: Global Protein Chip Industry Volume K Unit Forecast, by Product Type 2019 & 2032
- Table 5: Global Protein Chip Industry Revenue Million Forecast, by Application 2019 & 2032
- Table 6: Global Protein Chip Industry Volume K Unit Forecast, by Application 2019 & 2032
- Table 7: Global Protein Chip Industry Revenue Million Forecast, by End User 2019 & 2032
- Table 8: Global Protein Chip Industry Volume K Unit Forecast, by End User 2019 & 2032
- Table 9: Global Protein Chip Industry Revenue Million Forecast, by Region 2019 & 2032
- Table 10: Global Protein Chip Industry Volume K Unit Forecast, by Region 2019 & 2032
- Table 11: Global Protein Chip Industry Revenue Million Forecast, by Country 2019 & 2032
- Table 12: Global Protein Chip Industry Volume K Unit Forecast, by Country 2019 & 2032
- Table 13: United States Protein Chip Industry Revenue (Million) Forecast, by Application 2019 & 2032
- Table 14: United States Protein Chip Industry Volume (K Unit) Forecast, by Application 2019 & 2032
- Table 15: Canada Protein Chip Industry Revenue (Million) Forecast, by Application 2019 & 2032
- Table 16: Canada Protein Chip Industry Volume (K Unit) Forecast, by Application 2019 & 2032
- Table 17: Mexico Protein Chip Industry Revenue (Million) Forecast, by Application 2019 & 2032
- Table 18: Mexico Protein Chip Industry Volume (K Unit) Forecast, by Application 2019 & 2032
- Table 19: Global Protein Chip Industry Revenue Million Forecast, by Country 2019 & 2032
- Table 20: Global Protein Chip Industry Volume K Unit Forecast, by Country 2019 & 2032
- Table 21: Germany Protein Chip Industry Revenue (Million) Forecast, by Application 2019 & 2032
- Table 22: Germany Protein Chip Industry Volume (K Unit) Forecast, by Application 2019 & 2032
- Table 23: United Kingdom Protein Chip Industry Revenue (Million) Forecast, by Application 2019 & 2032
- Table 24: United Kingdom Protein Chip Industry Volume (K Unit) Forecast, by Application 2019 & 2032
- Table 25: France Protein Chip Industry Revenue (Million) Forecast, by Application 2019 & 2032
- Table 26: France Protein Chip Industry Volume (K Unit) Forecast, by Application 2019 & 2032
- Table 27: Italy Protein Chip Industry Revenue (Million) Forecast, by Application 2019 & 2032
- Table 28: Italy Protein Chip Industry Volume (K Unit) Forecast, by Application 2019 & 2032
- Table 29: Spain Protein Chip Industry Revenue (Million) Forecast, by Application 2019 & 2032
- Table 30: Spain Protein Chip Industry Volume (K Unit) Forecast, by Application 2019 & 2032
- Table 31: Rest of Europe Protein Chip Industry Revenue (Million) Forecast, by Application 2019 & 2032
- Table 32: Rest of Europe Protein Chip Industry Volume (K Unit) Forecast, by Application 2019 & 2032
- Table 33: Global Protein Chip Industry Revenue Million Forecast, by Country 2019 & 2032
- Table 34: Global Protein Chip Industry Volume K Unit Forecast, by Country 2019 & 2032
- Table 35: China Protein Chip Industry Revenue (Million) Forecast, by Application 2019 & 2032
- Table 36: China Protein Chip Industry Volume (K Unit) Forecast, by Application 2019 & 2032
- Table 37: Japan Protein Chip Industry Revenue (Million) Forecast, by Application 2019 & 2032
- Table 38: Japan Protein Chip Industry Volume (K Unit) Forecast, by Application 2019 & 2032
- Table 39: India Protein Chip Industry Revenue (Million) Forecast, by Application 2019 & 2032
- Table 40: India Protein Chip Industry Volume (K Unit) Forecast, by Application 2019 & 2032
- Table 41: Australia Protein Chip Industry Revenue (Million) Forecast, by Application 2019 & 2032
- Table 42: Australia Protein Chip Industry Volume (K Unit) Forecast, by Application 2019 & 2032
- Table 43: South Korea Protein Chip Industry Revenue (Million) Forecast, by Application 2019 & 2032
- Table 44: South Korea Protein Chip Industry Volume (K Unit) Forecast, by Application 2019 & 2032
- Table 45: Rest of Asia Pacific Protein Chip Industry Revenue (Million) Forecast, by Application 2019 & 2032
- Table 46: Rest of Asia Pacific Protein Chip Industry Volume (K Unit) Forecast, by Application 2019 & 2032
- Table 47: Global Protein Chip Industry Revenue Million Forecast, by Country 2019 & 2032
- Table 48: Global Protein Chip Industry Volume K Unit Forecast, by Country 2019 & 2032
- Table 49: GCC Protein Chip Industry Revenue (Million) Forecast, by Application 2019 & 2032
- Table 50: GCC Protein Chip Industry Volume (K Unit) Forecast, by Application 2019 & 2032
- Table 51: South Africa Protein Chip Industry Revenue (Million) Forecast, by Application 2019 & 2032
- Table 52: South Africa Protein Chip Industry Volume (K Unit) Forecast, by Application 2019 & 2032
- Table 53: Rest of Middle East and Africa Protein Chip Industry Revenue (Million) Forecast, by Application 2019 & 2032
- Table 54: Rest of Middle East and Africa Protein Chip Industry Volume (K Unit) Forecast, by Application 2019 & 2032
- Table 55: Global Protein Chip Industry Revenue Million Forecast, by Country 2019 & 2032
- Table 56: Global Protein Chip Industry Volume K Unit Forecast, by Country 2019 & 2032
- Table 57: Brazil Protein Chip Industry Revenue (Million) Forecast, by Application 2019 & 2032
- Table 58: Brazil Protein Chip Industry Volume (K Unit) Forecast, by Application 2019 & 2032
- Table 59: Argentina Protein Chip Industry Revenue (Million) Forecast, by Application 2019 & 2032
- Table 60: Argentina Protein Chip Industry Volume (K Unit) Forecast, by Application 2019 & 2032
- Table 61: Rest of South America Protein Chip Industry Revenue (Million) Forecast, by Application 2019 & 2032
- Table 62: Rest of South America Protein Chip Industry Volume (K Unit) Forecast, by Application 2019 & 2032
- Table 63: Global Protein Chip Industry Revenue Million Forecast, by Product Type 2019 & 2032
- Table 64: Global Protein Chip Industry Volume K Unit Forecast, by Product Type 2019 & 2032
- Table 65: Global Protein Chip Industry Revenue Million Forecast, by Application 2019 & 2032
- Table 66: Global Protein Chip Industry Volume K Unit Forecast, by Application 2019 & 2032
- Table 67: Global Protein Chip Industry Revenue Million Forecast, by End User 2019 & 2032
- Table 68: Global Protein Chip Industry Volume K Unit Forecast, by End User 2019 & 2032
- Table 69: Global Protein Chip Industry Revenue Million Forecast, by Country 2019 & 2032
- Table 70: Global Protein Chip Industry Volume K Unit Forecast, by Country 2019 & 2032
- Table 71: United States Protein Chip Industry Revenue (Million) Forecast, by Application 2019 & 2032
- Table 72: United States Protein Chip Industry Volume (K Unit) Forecast, by Application 2019 & 2032
- Table 73: Canada Protein Chip Industry Revenue (Million) Forecast, by Application 2019 & 2032
- Table 74: Canada Protein Chip Industry Volume (K Unit) Forecast, by Application 2019 & 2032
- Table 75: Mexico Protein Chip Industry Revenue (Million) Forecast, by Application 2019 & 2032
- Table 76: Mexico Protein Chip Industry Volume (K Unit) Forecast, by Application 2019 & 2032
- Table 77: Global Protein Chip Industry Revenue Million Forecast, by Product Type 2019 & 2032
- Table 78: Global Protein Chip Industry Volume K Unit Forecast, by Product Type 2019 & 2032
- Table 79: Global Protein Chip Industry Revenue Million Forecast, by Application 2019 & 2032
- Table 80: Global Protein Chip Industry Volume K Unit Forecast, by Application 2019 & 2032
- Table 81: Global Protein Chip Industry Revenue Million Forecast, by End User 2019 & 2032
- Table 82: Global Protein Chip Industry Volume K Unit Forecast, by End User 2019 & 2032
- Table 83: Global Protein Chip Industry Revenue Million Forecast, by Country 2019 & 2032
- Table 84: Global Protein Chip Industry Volume K Unit Forecast, by Country 2019 & 2032
- Table 85: Germany Protein Chip Industry Revenue (Million) Forecast, by Application 2019 & 2032
- Table 86: Germany Protein Chip Industry Volume (K Unit) Forecast, by Application 2019 & 2032
- Table 87: United Kingdom Protein Chip Industry Revenue (Million) Forecast, by Application 2019 & 2032
- Table 88: United Kingdom Protein Chip Industry Volume (K Unit) Forecast, by Application 2019 & 2032
- Table 89: France Protein Chip Industry Revenue (Million) Forecast, by Application 2019 & 2032
- Table 90: France Protein Chip Industry Volume (K Unit) Forecast, by Application 2019 & 2032
- Table 91: Italy Protein Chip Industry Revenue (Million) Forecast, by Application 2019 & 2032
- Table 92: Italy Protein Chip Industry Volume (K Unit) Forecast, by Application 2019 & 2032
- Table 93: Spain Protein Chip Industry Revenue (Million) Forecast, by Application 2019 & 2032
- Table 94: Spain Protein Chip Industry Volume (K Unit) Forecast, by Application 2019 & 2032
- Table 95: Rest of Europe Protein Chip Industry Revenue (Million) Forecast, by Application 2019 & 2032
- Table 96: Rest of Europe Protein Chip Industry Volume (K Unit) Forecast, by Application 2019 & 2032
- Table 97: Global Protein Chip Industry Revenue Million Forecast, by Product Type 2019 & 2032
- Table 98: Global Protein Chip Industry Volume K Unit Forecast, by Product Type 2019 & 2032
- Table 99: Global Protein Chip Industry Revenue Million Forecast, by Application 2019 & 2032
- Table 100: Global Protein Chip Industry Volume K Unit Forecast, by Application 2019 & 2032
- Table 101: Global Protein Chip Industry Revenue Million Forecast, by End User 2019 & 2032
- Table 102: Global Protein Chip Industry Volume K Unit Forecast, by End User 2019 & 2032
- Table 103: Global Protein Chip Industry Revenue Million Forecast, by Country 2019 & 2032
- Table 104: Global Protein Chip Industry Volume K Unit Forecast, by Country 2019 & 2032
- Table 105: China Protein Chip Industry Revenue (Million) Forecast, by Application 2019 & 2032
- Table 106: China Protein Chip Industry Volume (K Unit) Forecast, by Application 2019 & 2032
- Table 107: Japan Protein Chip Industry Revenue (Million) Forecast, by Application 2019 & 2032
- Table 108: Japan Protein Chip Industry Volume (K Unit) Forecast, by Application 2019 & 2032
- Table 109: India Protein Chip Industry Revenue (Million) Forecast, by Application 2019 & 2032
- Table 110: India Protein Chip Industry Volume (K Unit) Forecast, by Application 2019 & 2032
- Table 111: Australia Protein Chip Industry Revenue (Million) Forecast, by Application 2019 & 2032
- Table 112: Australia Protein Chip Industry Volume (K Unit) Forecast, by Application 2019 & 2032
- Table 113: South Korea Protein Chip Industry Revenue (Million) Forecast, by Application 2019 & 2032
- Table 114: South Korea Protein Chip Industry Volume (K Unit) Forecast, by Application 2019 & 2032
- Table 115: Rest of Asia Pacific Protein Chip Industry Revenue (Million) Forecast, by Application 2019 & 2032
- Table 116: Rest of Asia Pacific Protein Chip Industry Volume (K Unit) Forecast, by Application 2019 & 2032
- Table 117: Global Protein Chip Industry Revenue Million Forecast, by Product Type 2019 & 2032
- Table 118: Global Protein Chip Industry Volume K Unit Forecast, by Product Type 2019 & 2032
- Table 119: Global Protein Chip Industry Revenue Million Forecast, by Application 2019 & 2032
- Table 120: Global Protein Chip Industry Volume K Unit Forecast, by Application 2019 & 2032
- Table 121: Global Protein Chip Industry Revenue Million Forecast, by End User 2019 & 2032
- Table 122: Global Protein Chip Industry Volume K Unit Forecast, by End User 2019 & 2032
- Table 123: Global Protein Chip Industry Revenue Million Forecast, by Country 2019 & 2032
- Table 124: Global Protein Chip Industry Volume K Unit Forecast, by Country 2019 & 2032
- Table 125: GCC Protein Chip Industry Revenue (Million) Forecast, by Application 2019 & 2032
- Table 126: GCC Protein Chip Industry Volume (K Unit) Forecast, by Application 2019 & 2032
- Table 127: South Africa Protein Chip Industry Revenue (Million) Forecast, by Application 2019 & 2032
- Table 128: South Africa Protein Chip Industry Volume (K Unit) Forecast, by Application 2019 & 2032
- Table 129: Rest of Middle East and Africa Protein Chip Industry Revenue (Million) Forecast, by Application 2019 & 2032
- Table 130: Rest of Middle East and Africa Protein Chip Industry Volume (K Unit) Forecast, by Application 2019 & 2032
- Table 131: Global Protein Chip Industry Revenue Million Forecast, by Product Type 2019 & 2032
- Table 132: Global Protein Chip Industry Volume K Unit Forecast, by Product Type 2019 & 2032
- Table 133: Global Protein Chip Industry Revenue Million Forecast, by Application 2019 & 2032
- Table 134: Global Protein Chip Industry Volume K Unit Forecast, by Application 2019 & 2032
- Table 135: Global Protein Chip Industry Revenue Million Forecast, by End User 2019 & 2032
- Table 136: Global Protein Chip Industry Volume K Unit Forecast, by End User 2019 & 2032
- Table 137: Global Protein Chip Industry Revenue Million Forecast, by Country 2019 & 2032
- Table 138: Global Protein Chip Industry Volume K Unit Forecast, by Country 2019 & 2032
- Table 139: Brazil Protein Chip Industry Revenue (Million) Forecast, by Application 2019 & 2032
- Table 140: Brazil Protein Chip Industry Volume (K Unit) Forecast, by Application 2019 & 2032
- Table 141: Argentina Protein Chip Industry Revenue (Million) Forecast, by Application 2019 & 2032
- Table 142: Argentina Protein Chip Industry Volume (K Unit) Forecast, by Application 2019 & 2032
- Table 143: Rest of South America Protein Chip Industry Revenue (Million) Forecast, by Application 2019 & 2032
- Table 144: Rest of South America Protein Chip Industry Volume (K Unit) Forecast, by Application 2019 & 2032
Frequently Asked Questions
1. What is the projected Compound Annual Growth Rate (CAGR) of the Protein Chip Industry?
The projected CAGR is approximately 11.73%.
2. Which companies are prominent players in the Protein Chip Industry?
Key companies in the market include Promega Corporation, Bio-Rad Laboratories Inc, Merck KGaA, Abcam Plc, F Hoffmann-La Roche Ltd, Cell Signaling Technology Inc, Danaher Corporation, Qiagen, PerkinElmer Inc, Thermo Fisher Scientific.
3. What are the main segments of the Protein Chip Industry?
The market segments include Product Type, Application, End User.
4. Can you provide details about the market size?
The market size is estimated to be USD 2.03 Million as of 2022.
5. What are some drivers contributing to market growth?
Increasing Incidence of Chronic and Infectious Diseases; Technological Advancements in Protein Assay Techniques; Increasing Expenditure on Pharmaceutical and Biological Research and Development.
6. What are the notable trends driving market growth?
Drug Discovery and Development Segment is Expected to Hold a Significant Share in the Protein Assay Market during the Forecast Period of the Study.
7. Are there any restraints impacting market growth?
High Cost of Multiplex Assay Equipment.
8. Can you provide examples of recent developments in the market?
In March 2022, Biognosys launched an expanded suite of proteomics platforms that provide pharmaceutical and diagnostics customers with deep biological insights across the entire R&D pipeline, from early-stage discovery to clinical settings.
9. What pricing options are available for accessing the report?
Pricing options include single-user, multi-user, and enterprise licenses priced at USD 4750, USD 5250, and USD 8750 respectively.
10. Is the market size provided in terms of value or volume?
The market size is provided in terms of value, measured in Million and volume, measured in K Unit.
11. Are there any specific market keywords associated with the report?
Yes, the market keyword associated with the report is "Protein Chip Industry," which aids in identifying and referencing the specific market segment covered.
12. How do I determine which pricing option suits my needs best?
The pricing options vary based on user requirements and access needs. Individual users may opt for single-user licenses, while businesses requiring broader access may choose multi-user or enterprise licenses for cost-effective access to the report.
13. Are there any additional resources or data provided in the Protein Chip Industry report?
While the report offers comprehensive insights, it's advisable to review the specific contents or supplementary materials provided to ascertain if additional resources or data are available.
14. How can I stay updated on further developments or reports in the Protein Chip Industry?
To stay informed about further developments, trends, and reports in the Protein Chip Industry, consider subscribing to industry newsletters, following relevant companies and organizations, or regularly checking reputable industry news sources and publications.
Methodology
Step 1 - Identification of Relevant Samples Size from Population Database


Step 2 - Approaches for Defining Global Market Size (Value, Volume* & Price*)

Note*: In applicable scenarios
Step 3 - Data Sources
Primary Research
- Web Analytics
- Survey Reports
- Research Institute
- Latest Research Reports
- Opinion Leaders
Secondary Research
- Annual Reports
- White Paper
- Latest Press Release
- Industry Association
- Paid Database
- Investor Presentations

Step 4 - Data Triangulation
Involves using different sources of information in order to increase the validity of a study
These sources are likely to be stakeholders in a program - participants, other researchers, program staff, other community members, and so on.
Then we put all data in single framework & apply various statistical tools to find out the dynamic on the market.
During the analysis stage, feedback from the stakeholder groups would be compared to determine areas of agreement as well as areas of divergence
