

Key Insights
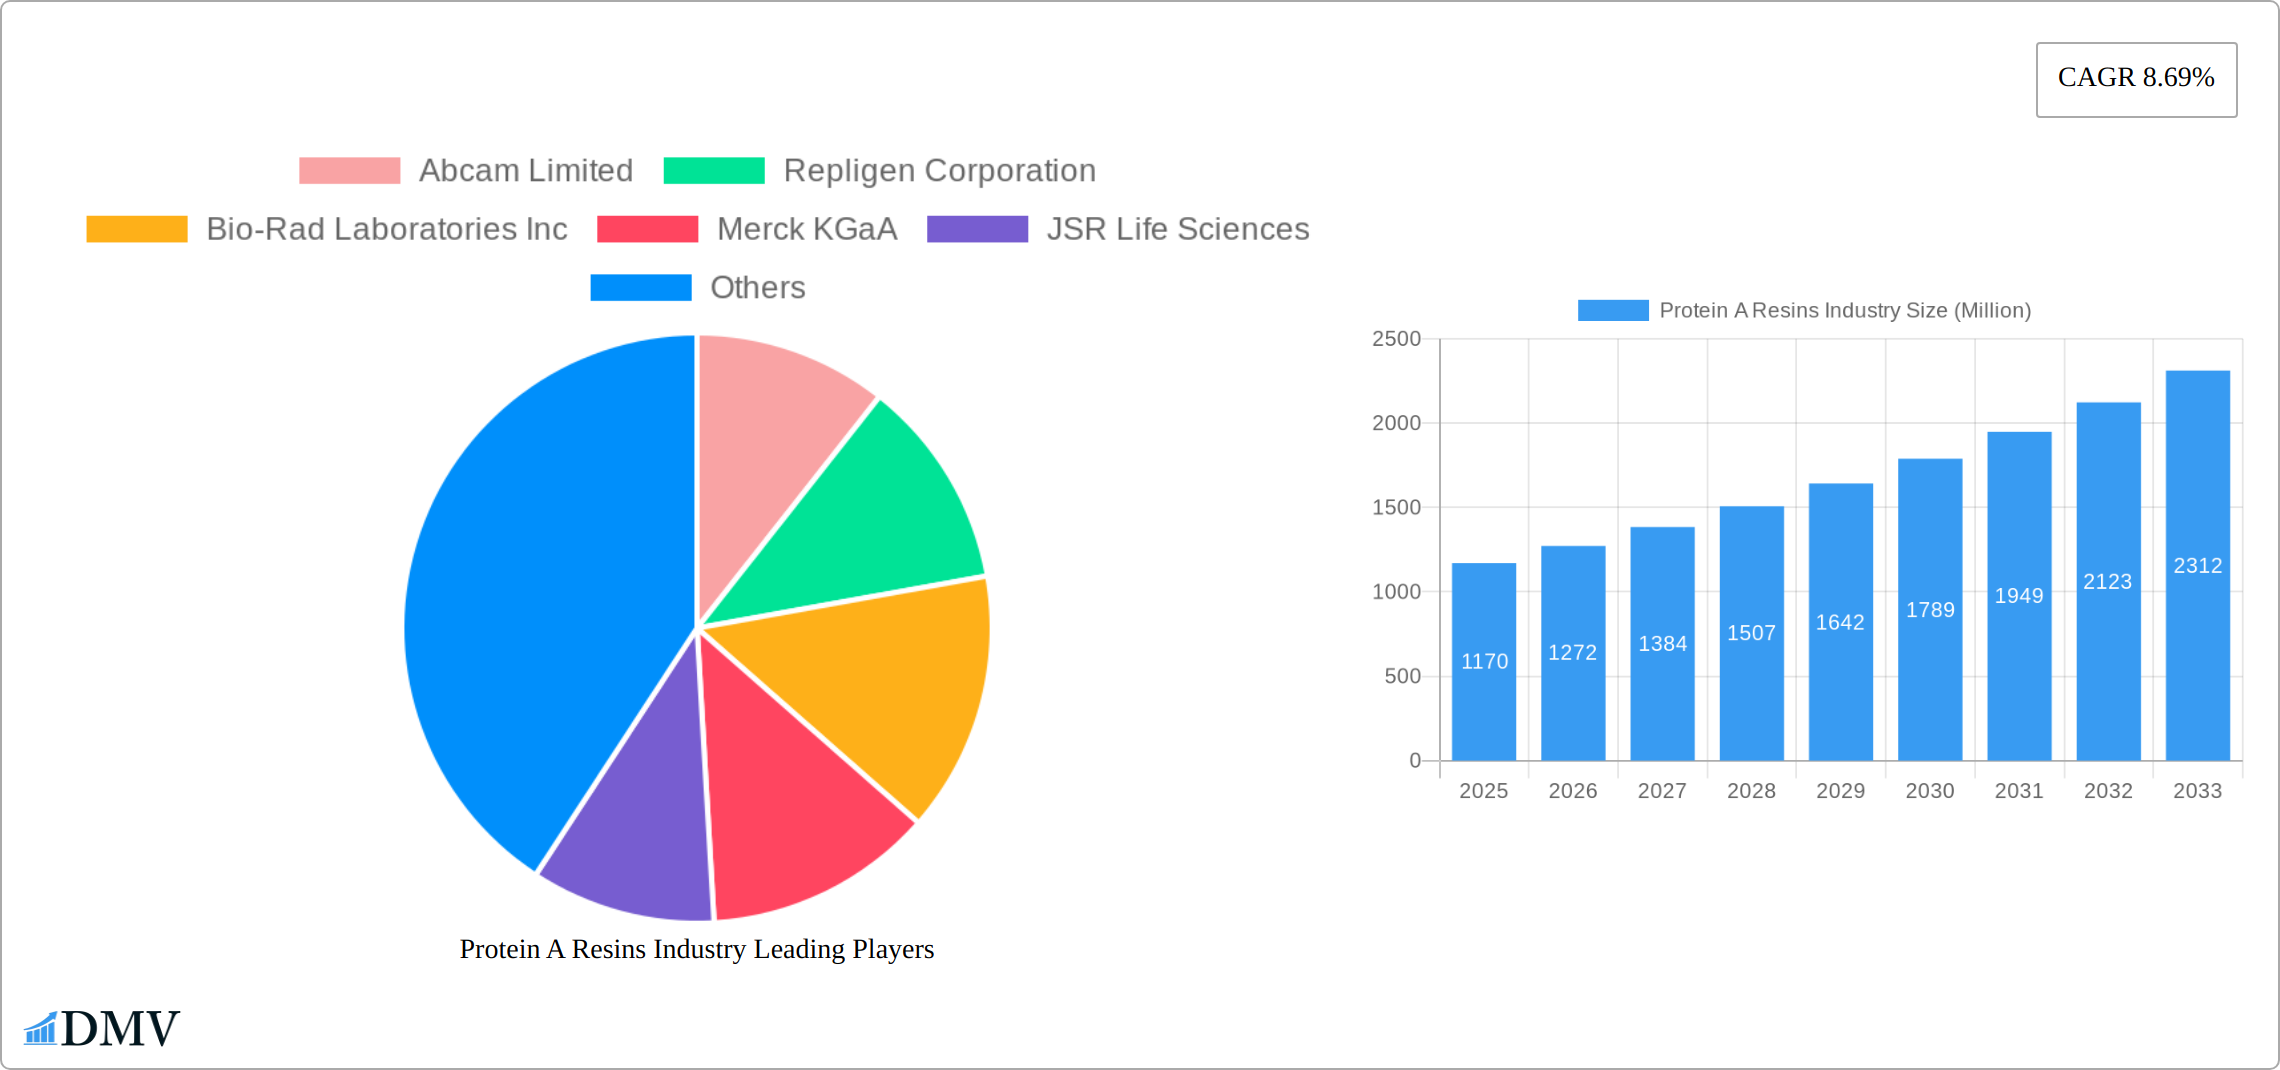
The Protein A Resins market, valued at $1.17 billion in 2025, is projected to experience robust growth, driven by a Compound Annual Growth Rate (CAGR) of 8.69% from 2025 to 2033. This expansion is fueled by several key factors. The burgeoning biopharmaceutical industry, constantly seeking efficient and high-yield protein purification methods, is a major catalyst. Increased demand for monoclonal antibodies (mAbs) in therapeutic applications like cancer treatment and autoimmune diseases significantly boosts the market. Advancements in resin technology, leading to improved binding capacity, selectivity, and longevity, further contribute to market growth. Furthermore, the rising prevalence of chronic diseases globally increases the demand for biologics, stimulating the need for efficient purification processes relying heavily on Protein A resins. The market also benefits from the continuous innovation in resin types, including agarose-based, glass or silica-based, and organic polymer-based options, each catering to specific purification needs and applications.
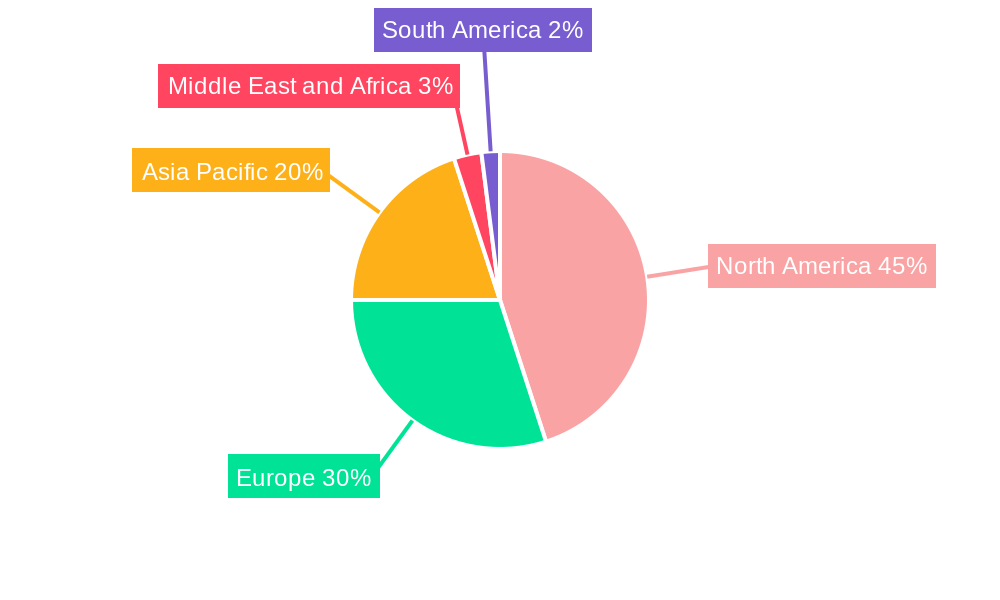
Despite the promising outlook, the market faces certain challenges. High production costs associated with advanced resin technologies may limit broader adoption, particularly in smaller research settings. Regulatory hurdles and stringent quality control requirements for biopharmaceutical applications also pose restraints. However, continuous technological advancements and the increasing focus on cost-effective manufacturing are expected to mitigate these challenges. The market is segmented by product type (agarose-based, glass/silica-based, organic polymer-based), application (antibody purification, immunoprecipitation), and end-user (pharmaceutical and biopharmaceutical companies, research laboratories). North America currently holds a significant market share due to the presence of major biopharmaceutical companies and well-established research infrastructure. However, the Asia-Pacific region is projected to exhibit substantial growth in the coming years, driven by rising healthcare expenditure and increased R&D activities in emerging economies.
Protein A Resins Industry: A Comprehensive Market Report (2019-2033)
This insightful report provides a detailed analysis of the Protein A Resins industry, offering a comprehensive overview of market dynamics, key players, and future growth prospects. With a study period spanning 2019-2033, a base year of 2025, and an estimated and forecast period of 2025-2033, this report is an invaluable resource for stakeholders seeking to navigate this rapidly evolving market. The global Protein A Resins market is projected to reach xx Million by 2033, exhibiting a Compound Annual Growth Rate (CAGR) of xx% during the forecast period.
Protein A Resins Industry Market Composition & Trends
The Protein A resins market is a moderately concentrated landscape dominated by key players like Danaher Corporation (Cytiva), Repligen Corporation, and Merck KGaA, who collectively hold a substantial market share. However, a competitive ecosystem also includes several smaller, specialized companies driving innovation. While precise 2024 market share figures are proprietary, Danaher Corporation (Cytiva) maintains a leading position, followed by Repligen Corporation and Merck KGaA. The remaining share is distributed among numerous smaller players. This dynamic market is fueled by the biopharmaceutical industry's relentless pursuit of higher purity antibodies, increased throughput in manufacturing processes, and reduced production costs. Stringent regulatory requirements governing biopharmaceutical manufacturing significantly influence market growth and necessitate continuous compliance efforts from industry participants. Alternative purification methods utilizing Protein G resins exist; however, Protein A remains the preferred choice for its superior binding affinity to a broader range of antibodies. The industry exhibits considerable merger and acquisition (M&A) activity, exemplified by the significant USD 80.4 Million Series A funding secured by Calluna Pharma Inc. Such strategic activities aim to expand product portfolios, enhance technological capabilities, and consolidate market positions.
- Market Concentration: Moderately concentrated, with a few dominant players and numerous niche competitors.
- Innovation Drivers: Demand for higher purity, increased throughput, and cost-effective antibody purification.
- Regulatory Influence: Stringent biopharmaceutical manufacturing regulations shape market dynamics and growth trajectories.
- Competitive Landscape: Protein G resins represent a niche alternative, but Protein A maintains its dominance due to superior binding capabilities.
- M&A Activity: Significant consolidation and investment are driving innovation and shaping the competitive landscape. Recent deals like Calluna Pharma Inc.'s funding highlight this trend.
Protein A Resins Industry Evolution
The Protein A Resins market has witnessed substantial growth over the historical period (2019-2024), driven by the booming biopharmaceutical industry and the increasing demand for monoclonal antibodies (mAbs). Technological advancements, including the development of novel resin chemistries and improved purification processes, have significantly enhanced the efficiency and scalability of antibody production. The market experienced a CAGR of xx% between 2019 and 2024. Consumer demand shifts toward higher-purity products and more efficient purification techniques, prompting continuous innovation in resin design and manufacturing. The increasing adoption of single-use technologies and automated systems is further fueling market expansion. Future growth will likely be influenced by advancements in resin technology, such as the introduction of Praesto CH1, and the expansion of the therapeutic antibody market. The shift toward personalized medicine and the development of novel antibody-based therapies are also set to create new opportunities for growth.
Leading Regions, Countries, or Segments in Protein A Resins Industry
The North American region currently dominates the Protein A Resins market, driven by the strong presence of major pharmaceutical and biopharmaceutical companies and robust research infrastructure. Europe holds a significant market share, with strong growth potential in emerging markets.
- Dominant Region: North America, driven by a strong pharmaceutical sector.
- Key Drivers: High R&D spending, supportive regulatory environment, and presence of major market players.
- Product Segments: Agarose-based resins currently hold the largest market share due to their cost-effectiveness and high binding capacity.
- Application Segments: Antibody purification dominates, followed by immunoprecipitation.
- End-User Segments: Pharmaceutical and biopharmaceutical companies are the primary consumers.
The dominance of North America is primarily attributed to the high concentration of major pharmaceutical and biotech companies, substantial investment in R&D, and a well-established regulatory framework. Europe also holds a significant market share due to its strong pharmaceutical industry and its focus on biopharmaceutical innovation. Asia Pacific is an emerging market showing rapid growth owing to the expanding biopharmaceutical industry and increasing government initiatives promoting biosimilar development.
Protein A Resins Industry Product Innovations
Recent innovations in Protein A resins include the development of novel chemistries offering improved binding capacity, selectivity, and durability. The launch of Praesto CH1, a 70 µm agarose-based resin, signifies a significant advancement in purifying specialized mAbs, addressing the growing demand for complex antibody therapies. These innovations focus on enhancing purification efficiency, reducing process time, and improving product quality, thereby minimizing production costs and maximizing yield.
Propelling Factors for Protein A Resins Industry Growth
The Protein A resins market is propelled by several key factors: the escalating demand for monoclonal antibodies for therapeutic applications, the continuous growth of the biopharmaceutical industry, and the increasing adoption of advanced purification techniques in bioprocessing. Technological advancements, such as the development of high-capacity and high-selectivity resins, further fuel market growth. Favorable regulatory environments in key regions also support the industry's expansion.
Obstacles in the Protein A Resins Industry Market
The Protein A resins market faces significant headwinds, including potential supply chain disruptions affecting raw material availability, potentially impacting both production capacity and pricing. The intense competition amongst both established industry giants and emerging players creates price pressure, potentially squeezing profit margins. Furthermore, the stringent regulatory landscape surrounding biopharmaceutical manufacturing imposes substantial compliance costs and operational complexities for all market participants.
Future Opportunities in Protein A Resins Industry
Significant growth opportunities exist in developing novel resin chemistries optimized for purifying complex antibody types, including bispecific antibodies and antibody-drug conjugates (ADCs). The rising adoption of single-use technologies and continuous manufacturing processes presents another avenue for significant market expansion. Finally, tapping into the growth potential of emerging markets, especially within Asia and Latin America, offers substantial untapped opportunities for industry players.
Major Players in the Protein A Resins Industry Ecosystem
- Abcam Limited
- Repligen Corporation
- Bio-Rad Laboratories Inc
- Merck KGaA
- JSR Life Sciences
- Kaneka Corporation
- Genscript Corporation
- Tosoh Bioscience LLC
- Danaher Corporation (Cytiva)
- Axplora
- Thermofisher Scientific Inc
- Agarose Beads Technologies
- Ecolab Inc (Purolite Lifesciences)
Key Developments in Protein A Resins Industry Industry
- February 2024: Purolite, an Ecolab company, and Repligen Corporation launched Praesto CH1, a novel 70 µm agarose-based affinity resin designed for purifying complex monoclonal antibodies (mAbs). This launch reflects the industry's ongoing innovation in resin technology to meet the growing demand for advanced antibody therapies.
- January 2024: The merger of Dutch Oxitope and Norwegian Arxx, forming Calluna Pharma Inc., resulted in securing USD 80.4 Million (EUR 75 Million) in Series A funding to advance monoclonal antibody therapy development. This significant investment underscores the substantial financial commitment to antibody-based therapeutics and its direct impact on the demand for Protein A resins.
Strategic Protein A Resins Industry Market Forecast
The Protein A resins market is poised for continued growth driven by the expanding biopharmaceutical industry, technological innovations in resin design and manufacturing, and the increasing demand for high-purity therapeutic antibodies. The market's future is bright, with significant opportunities in emerging markets and the development of novel antibody-based therapies. The market is projected to experience robust growth, driven by these factors, and maintain a strong CAGR throughout the forecast period.
Protein A Resins Industry Segmentation
-
1. Product
- 1.1. Agarose -based Protein
- 1.2. Glass or Silica-based Protein
- 1.3. Organic Polymer-based Protein
-
2. Application
- 2.1. Antibody Purification
- 2.2. Immunoprecipitation
-
3. End User
- 3.1. Pharmaceutical and Biopharmaceutical Companies
- 3.2. Research Laboratories
- 3.3. Other End Users
Protein A Resins Industry Segmentation By Geography
-
1. North America
- 1.1. United States
- 1.2. Canada
- 1.3. Mexico
-
2. Europe
- 2.1. Germany
- 2.2. United Kingdom
- 2.3. France
- 2.4. Italy
- 2.5. Spain
- 2.6. Rest of Europe
-
3. Asia Pacific
- 3.1. China
- 3.2. Japan
- 3.3. India
- 3.4. Australia
- 3.5. South Korea
- 3.6. Rest of Asia Pacific
-
4. Middle East and Africa
- 4.1. GCC
- 4.2. South Africa
- 4.3. Rest of Middle East and Africa
-
5. South America
- 5.1. Brazil
- 5.2. Argentina
- 5.3. Rest of South America
Protein A Resins Industry REPORT HIGHLIGHTS
| Aspects | Details |
|---|---|
| Study Period | 2019-2033 |
| Base Year | 2024 |
| Estimated Year | 2025 |
| Forecast Period | 2025-2033 |
| Historical Period | 2019-2024 |
| Growth Rate | CAGR of 8.69% from 2019-2033 |
| Segmentation |
|
Table of Contents
- 1. Introduction
- 1.1. Research Scope
- 1.2. Market Segmentation
- 1.3. Research Methodology
- 1.4. Definitions and Assumptions
- 2. Executive Summary
- 2.1. Introduction
- 3. Market Dynamics
- 3.1. Introduction
- 3.2. Market Drivers
- 3.2.1. Increasing Demand for Antibodies; Increasing Number of Drug Discoveries and R&D Activities
- 3.3. Market Restrains
- 3.3.1. High Cost Associated With Protein A Resin
- 3.4. Market Trends
- 3.4.1. Pharmaceutical and Biopharmaceutical Companies are Expected to Dominate the End User Segment
- 4. Market Factor Analysis
- 4.1. Porters Five Forces
- 4.2. Supply/Value Chain
- 4.3. PESTEL analysis
- 4.4. Market Entropy
- 4.5. Patent/Trademark Analysis
- 5. Global Protein A Resins Industry Analysis, Insights and Forecast, 2019-2031
- 5.1. Market Analysis, Insights and Forecast - by Product
- 5.1.1. Agarose -based Protein
- 5.1.2. Glass or Silica-based Protein
- 5.1.3. Organic Polymer-based Protein
- 5.2. Market Analysis, Insights and Forecast - by Application
- 5.2.1. Antibody Purification
- 5.2.2. Immunoprecipitation
- 5.3. Market Analysis, Insights and Forecast - by End User
- 5.3.1. Pharmaceutical and Biopharmaceutical Companies
- 5.3.2. Research Laboratories
- 5.3.3. Other End Users
- 5.4. Market Analysis, Insights and Forecast - by Region
- 5.4.1. North America
- 5.4.2. Europe
- 5.4.3. Asia Pacific
- 5.4.4. Middle East and Africa
- 5.4.5. South America
- 5.1. Market Analysis, Insights and Forecast - by Product
- 6. North America Protein A Resins Industry Analysis, Insights and Forecast, 2019-2031
- 6.1. Market Analysis, Insights and Forecast - by Product
- 6.1.1. Agarose -based Protein
- 6.1.2. Glass or Silica-based Protein
- 6.1.3. Organic Polymer-based Protein
- 6.2. Market Analysis, Insights and Forecast - by Application
- 6.2.1. Antibody Purification
- 6.2.2. Immunoprecipitation
- 6.3. Market Analysis, Insights and Forecast - by End User
- 6.3.1. Pharmaceutical and Biopharmaceutical Companies
- 6.3.2. Research Laboratories
- 6.3.3. Other End Users
- 6.1. Market Analysis, Insights and Forecast - by Product
- 7. Europe Protein A Resins Industry Analysis, Insights and Forecast, 2019-2031
- 7.1. Market Analysis, Insights and Forecast - by Product
- 7.1.1. Agarose -based Protein
- 7.1.2. Glass or Silica-based Protein
- 7.1.3. Organic Polymer-based Protein
- 7.2. Market Analysis, Insights and Forecast - by Application
- 7.2.1. Antibody Purification
- 7.2.2. Immunoprecipitation
- 7.3. Market Analysis, Insights and Forecast - by End User
- 7.3.1. Pharmaceutical and Biopharmaceutical Companies
- 7.3.2. Research Laboratories
- 7.3.3. Other End Users
- 7.1. Market Analysis, Insights and Forecast - by Product
- 8. Asia Pacific Protein A Resins Industry Analysis, Insights and Forecast, 2019-2031
- 8.1. Market Analysis, Insights and Forecast - by Product
- 8.1.1. Agarose -based Protein
- 8.1.2. Glass or Silica-based Protein
- 8.1.3. Organic Polymer-based Protein
- 8.2. Market Analysis, Insights and Forecast - by Application
- 8.2.1. Antibody Purification
- 8.2.2. Immunoprecipitation
- 8.3. Market Analysis, Insights and Forecast - by End User
- 8.3.1. Pharmaceutical and Biopharmaceutical Companies
- 8.3.2. Research Laboratories
- 8.3.3. Other End Users
- 8.1. Market Analysis, Insights and Forecast - by Product
- 9. Middle East and Africa Protein A Resins Industry Analysis, Insights and Forecast, 2019-2031
- 9.1. Market Analysis, Insights and Forecast - by Product
- 9.1.1. Agarose -based Protein
- 9.1.2. Glass or Silica-based Protein
- 9.1.3. Organic Polymer-based Protein
- 9.2. Market Analysis, Insights and Forecast - by Application
- 9.2.1. Antibody Purification
- 9.2.2. Immunoprecipitation
- 9.3. Market Analysis, Insights and Forecast - by End User
- 9.3.1. Pharmaceutical and Biopharmaceutical Companies
- 9.3.2. Research Laboratories
- 9.3.3. Other End Users
- 9.1. Market Analysis, Insights and Forecast - by Product
- 10. South America Protein A Resins Industry Analysis, Insights and Forecast, 2019-2031
- 10.1. Market Analysis, Insights and Forecast - by Product
- 10.1.1. Agarose -based Protein
- 10.1.2. Glass or Silica-based Protein
- 10.1.3. Organic Polymer-based Protein
- 10.2. Market Analysis, Insights and Forecast - by Application
- 10.2.1. Antibody Purification
- 10.2.2. Immunoprecipitation
- 10.3. Market Analysis, Insights and Forecast - by End User
- 10.3.1. Pharmaceutical and Biopharmaceutical Companies
- 10.3.2. Research Laboratories
- 10.3.3. Other End Users
- 10.1. Market Analysis, Insights and Forecast - by Product
- 11. North America Protein A Resins Industry Analysis, Insights and Forecast, 2019-2031
- 11.1. Market Analysis, Insights and Forecast - By Country/Sub-region
- 11.1.1 United States
- 11.1.2 Canada
- 11.1.3 Mexico
- 12. Europe Protein A Resins Industry Analysis, Insights and Forecast, 2019-2031
- 12.1. Market Analysis, Insights and Forecast - By Country/Sub-region
- 12.1.1 Germany
- 12.1.2 United Kingdom
- 12.1.3 France
- 12.1.4 Italy
- 12.1.5 Spain
- 12.1.6 Rest of Europe
- 13. Asia Pacific Protein A Resins Industry Analysis, Insights and Forecast, 2019-2031
- 13.1. Market Analysis, Insights and Forecast - By Country/Sub-region
- 13.1.1 China
- 13.1.2 Japan
- 13.1.3 India
- 13.1.4 Australia
- 13.1.5 South Korea
- 13.1.6 Rest of Asia Pacific
- 14. Middle East and Africa Protein A Resins Industry Analysis, Insights and Forecast, 2019-2031
- 14.1. Market Analysis, Insights and Forecast - By Country/Sub-region
- 14.1.1 GCC
- 14.1.2 South Africa
- 14.1.3 Rest of Middle East and Africa
- 15. South America Protein A Resins Industry Analysis, Insights and Forecast, 2019-2031
- 15.1. Market Analysis, Insights and Forecast - By Country/Sub-region
- 15.1.1 Brazil
- 15.1.2 Argentina
- 15.1.3 Rest of South America
- 16. Competitive Analysis
- 16.1. Global Market Share Analysis 2024
- 16.2. Company Profiles
- 16.2.1 Abcam Limited
- 16.2.1.1. Overview
- 16.2.1.2. Products
- 16.2.1.3. SWOT Analysis
- 16.2.1.4. Recent Developments
- 16.2.1.5. Financials (Based on Availability)
- 16.2.2 Repligen Corporation
- 16.2.2.1. Overview
- 16.2.2.2. Products
- 16.2.2.3. SWOT Analysis
- 16.2.2.4. Recent Developments
- 16.2.2.5. Financials (Based on Availability)
- 16.2.3 Bio-Rad Laboratories Inc
- 16.2.3.1. Overview
- 16.2.3.2. Products
- 16.2.3.3. SWOT Analysis
- 16.2.3.4. Recent Developments
- 16.2.3.5. Financials (Based on Availability)
- 16.2.4 Merck KGaA
- 16.2.4.1. Overview
- 16.2.4.2. Products
- 16.2.4.3. SWOT Analysis
- 16.2.4.4. Recent Developments
- 16.2.4.5. Financials (Based on Availability)
- 16.2.5 JSR Life Sciences
- 16.2.5.1. Overview
- 16.2.5.2. Products
- 16.2.5.3. SWOT Analysis
- 16.2.5.4. Recent Developments
- 16.2.5.5. Financials (Based on Availability)
- 16.2.6 Kaneka Corporation
- 16.2.6.1. Overview
- 16.2.6.2. Products
- 16.2.6.3. SWOT Analysis
- 16.2.6.4. Recent Developments
- 16.2.6.5. Financials (Based on Availability)
- 16.2.7 Genscript Corporation
- 16.2.7.1. Overview
- 16.2.7.2. Products
- 16.2.7.3. SWOT Analysis
- 16.2.7.4. Recent Developments
- 16.2.7.5. Financials (Based on Availability)
- 16.2.8 Tosoh Bioscience LLC
- 16.2.8.1. Overview
- 16.2.8.2. Products
- 16.2.8.3. SWOT Analysis
- 16.2.8.4. Recent Developments
- 16.2.8.5. Financials (Based on Availability)
- 16.2.9 Danaher Corporation (Cytiva)
- 16.2.9.1. Overview
- 16.2.9.2. Products
- 16.2.9.3. SWOT Analysis
- 16.2.9.4. Recent Developments
- 16.2.9.5. Financials (Based on Availability)
- 16.2.10 Axplora
- 16.2.10.1. Overview
- 16.2.10.2. Products
- 16.2.10.3. SWOT Analysis
- 16.2.10.4. Recent Developments
- 16.2.10.5. Financials (Based on Availability)
- 16.2.11 Thermofisher Scientific Inc
- 16.2.11.1. Overview
- 16.2.11.2. Products
- 16.2.11.3. SWOT Analysis
- 16.2.11.4. Recent Developments
- 16.2.11.5. Financials (Based on Availability)
- 16.2.12 Agarose Beads Technologies
- 16.2.12.1. Overview
- 16.2.12.2. Products
- 16.2.12.3. SWOT Analysis
- 16.2.12.4. Recent Developments
- 16.2.12.5. Financials (Based on Availability)
- 16.2.13 Ecolab Inc (Purolite Lifesciences)
- 16.2.13.1. Overview
- 16.2.13.2. Products
- 16.2.13.3. SWOT Analysis
- 16.2.13.4. Recent Developments
- 16.2.13.5. Financials (Based on Availability)
- 16.2.1 Abcam Limited
List of Figures
- Figure 1: Global Protein A Resins Industry Revenue Breakdown (Million, %) by Region 2024 & 2032
- Figure 2: Global Protein A Resins Industry Volume Breakdown (K Unit, %) by Region 2024 & 2032
- Figure 3: North America Protein A Resins Industry Revenue (Million), by Country 2024 & 2032
- Figure 4: North America Protein A Resins Industry Volume (K Unit), by Country 2024 & 2032
- Figure 5: North America Protein A Resins Industry Revenue Share (%), by Country 2024 & 2032
- Figure 6: North America Protein A Resins Industry Volume Share (%), by Country 2024 & 2032
- Figure 7: Europe Protein A Resins Industry Revenue (Million), by Country 2024 & 2032
- Figure 8: Europe Protein A Resins Industry Volume (K Unit), by Country 2024 & 2032
- Figure 9: Europe Protein A Resins Industry Revenue Share (%), by Country 2024 & 2032
- Figure 10: Europe Protein A Resins Industry Volume Share (%), by Country 2024 & 2032
- Figure 11: Asia Pacific Protein A Resins Industry Revenue (Million), by Country 2024 & 2032
- Figure 12: Asia Pacific Protein A Resins Industry Volume (K Unit), by Country 2024 & 2032
- Figure 13: Asia Pacific Protein A Resins Industry Revenue Share (%), by Country 2024 & 2032
- Figure 14: Asia Pacific Protein A Resins Industry Volume Share (%), by Country 2024 & 2032
- Figure 15: Middle East and Africa Protein A Resins Industry Revenue (Million), by Country 2024 & 2032
- Figure 16: Middle East and Africa Protein A Resins Industry Volume (K Unit), by Country 2024 & 2032
- Figure 17: Middle East and Africa Protein A Resins Industry Revenue Share (%), by Country 2024 & 2032
- Figure 18: Middle East and Africa Protein A Resins Industry Volume Share (%), by Country 2024 & 2032
- Figure 19: South America Protein A Resins Industry Revenue (Million), by Country 2024 & 2032
- Figure 20: South America Protein A Resins Industry Volume (K Unit), by Country 2024 & 2032
- Figure 21: South America Protein A Resins Industry Revenue Share (%), by Country 2024 & 2032
- Figure 22: South America Protein A Resins Industry Volume Share (%), by Country 2024 & 2032
- Figure 23: North America Protein A Resins Industry Revenue (Million), by Product 2024 & 2032
- Figure 24: North America Protein A Resins Industry Volume (K Unit), by Product 2024 & 2032
- Figure 25: North America Protein A Resins Industry Revenue Share (%), by Product 2024 & 2032
- Figure 26: North America Protein A Resins Industry Volume Share (%), by Product 2024 & 2032
- Figure 27: North America Protein A Resins Industry Revenue (Million), by Application 2024 & 2032
- Figure 28: North America Protein A Resins Industry Volume (K Unit), by Application 2024 & 2032
- Figure 29: North America Protein A Resins Industry Revenue Share (%), by Application 2024 & 2032
- Figure 30: North America Protein A Resins Industry Volume Share (%), by Application 2024 & 2032
- Figure 31: North America Protein A Resins Industry Revenue (Million), by End User 2024 & 2032
- Figure 32: North America Protein A Resins Industry Volume (K Unit), by End User 2024 & 2032
- Figure 33: North America Protein A Resins Industry Revenue Share (%), by End User 2024 & 2032
- Figure 34: North America Protein A Resins Industry Volume Share (%), by End User 2024 & 2032
- Figure 35: North America Protein A Resins Industry Revenue (Million), by Country 2024 & 2032
- Figure 36: North America Protein A Resins Industry Volume (K Unit), by Country 2024 & 2032
- Figure 37: North America Protein A Resins Industry Revenue Share (%), by Country 2024 & 2032
- Figure 38: North America Protein A Resins Industry Volume Share (%), by Country 2024 & 2032
- Figure 39: Europe Protein A Resins Industry Revenue (Million), by Product 2024 & 2032
- Figure 40: Europe Protein A Resins Industry Volume (K Unit), by Product 2024 & 2032
- Figure 41: Europe Protein A Resins Industry Revenue Share (%), by Product 2024 & 2032
- Figure 42: Europe Protein A Resins Industry Volume Share (%), by Product 2024 & 2032
- Figure 43: Europe Protein A Resins Industry Revenue (Million), by Application 2024 & 2032
- Figure 44: Europe Protein A Resins Industry Volume (K Unit), by Application 2024 & 2032
- Figure 45: Europe Protein A Resins Industry Revenue Share (%), by Application 2024 & 2032
- Figure 46: Europe Protein A Resins Industry Volume Share (%), by Application 2024 & 2032
- Figure 47: Europe Protein A Resins Industry Revenue (Million), by End User 2024 & 2032
- Figure 48: Europe Protein A Resins Industry Volume (K Unit), by End User 2024 & 2032
- Figure 49: Europe Protein A Resins Industry Revenue Share (%), by End User 2024 & 2032
- Figure 50: Europe Protein A Resins Industry Volume Share (%), by End User 2024 & 2032
- Figure 51: Europe Protein A Resins Industry Revenue (Million), by Country 2024 & 2032
- Figure 52: Europe Protein A Resins Industry Volume (K Unit), by Country 2024 & 2032
- Figure 53: Europe Protein A Resins Industry Revenue Share (%), by Country 2024 & 2032
- Figure 54: Europe Protein A Resins Industry Volume Share (%), by Country 2024 & 2032
- Figure 55: Asia Pacific Protein A Resins Industry Revenue (Million), by Product 2024 & 2032
- Figure 56: Asia Pacific Protein A Resins Industry Volume (K Unit), by Product 2024 & 2032
- Figure 57: Asia Pacific Protein A Resins Industry Revenue Share (%), by Product 2024 & 2032
- Figure 58: Asia Pacific Protein A Resins Industry Volume Share (%), by Product 2024 & 2032
- Figure 59: Asia Pacific Protein A Resins Industry Revenue (Million), by Application 2024 & 2032
- Figure 60: Asia Pacific Protein A Resins Industry Volume (K Unit), by Application 2024 & 2032
- Figure 61: Asia Pacific Protein A Resins Industry Revenue Share (%), by Application 2024 & 2032
- Figure 62: Asia Pacific Protein A Resins Industry Volume Share (%), by Application 2024 & 2032
- Figure 63: Asia Pacific Protein A Resins Industry Revenue (Million), by End User 2024 & 2032
- Figure 64: Asia Pacific Protein A Resins Industry Volume (K Unit), by End User 2024 & 2032
- Figure 65: Asia Pacific Protein A Resins Industry Revenue Share (%), by End User 2024 & 2032
- Figure 66: Asia Pacific Protein A Resins Industry Volume Share (%), by End User 2024 & 2032
- Figure 67: Asia Pacific Protein A Resins Industry Revenue (Million), by Country 2024 & 2032
- Figure 68: Asia Pacific Protein A Resins Industry Volume (K Unit), by Country 2024 & 2032
- Figure 69: Asia Pacific Protein A Resins Industry Revenue Share (%), by Country 2024 & 2032
- Figure 70: Asia Pacific Protein A Resins Industry Volume Share (%), by Country 2024 & 2032
- Figure 71: Middle East and Africa Protein A Resins Industry Revenue (Million), by Product 2024 & 2032
- Figure 72: Middle East and Africa Protein A Resins Industry Volume (K Unit), by Product 2024 & 2032
- Figure 73: Middle East and Africa Protein A Resins Industry Revenue Share (%), by Product 2024 & 2032
- Figure 74: Middle East and Africa Protein A Resins Industry Volume Share (%), by Product 2024 & 2032
- Figure 75: Middle East and Africa Protein A Resins Industry Revenue (Million), by Application 2024 & 2032
- Figure 76: Middle East and Africa Protein A Resins Industry Volume (K Unit), by Application 2024 & 2032
- Figure 77: Middle East and Africa Protein A Resins Industry Revenue Share (%), by Application 2024 & 2032
- Figure 78: Middle East and Africa Protein A Resins Industry Volume Share (%), by Application 2024 & 2032
- Figure 79: Middle East and Africa Protein A Resins Industry Revenue (Million), by End User 2024 & 2032
- Figure 80: Middle East and Africa Protein A Resins Industry Volume (K Unit), by End User 2024 & 2032
- Figure 81: Middle East and Africa Protein A Resins Industry Revenue Share (%), by End User 2024 & 2032
- Figure 82: Middle East and Africa Protein A Resins Industry Volume Share (%), by End User 2024 & 2032
- Figure 83: Middle East and Africa Protein A Resins Industry Revenue (Million), by Country 2024 & 2032
- Figure 84: Middle East and Africa Protein A Resins Industry Volume (K Unit), by Country 2024 & 2032
- Figure 85: Middle East and Africa Protein A Resins Industry Revenue Share (%), by Country 2024 & 2032
- Figure 86: Middle East and Africa Protein A Resins Industry Volume Share (%), by Country 2024 & 2032
- Figure 87: South America Protein A Resins Industry Revenue (Million), by Product 2024 & 2032
- Figure 88: South America Protein A Resins Industry Volume (K Unit), by Product 2024 & 2032
- Figure 89: South America Protein A Resins Industry Revenue Share (%), by Product 2024 & 2032
- Figure 90: South America Protein A Resins Industry Volume Share (%), by Product 2024 & 2032
- Figure 91: South America Protein A Resins Industry Revenue (Million), by Application 2024 & 2032
- Figure 92: South America Protein A Resins Industry Volume (K Unit), by Application 2024 & 2032
- Figure 93: South America Protein A Resins Industry Revenue Share (%), by Application 2024 & 2032
- Figure 94: South America Protein A Resins Industry Volume Share (%), by Application 2024 & 2032
- Figure 95: South America Protein A Resins Industry Revenue (Million), by End User 2024 & 2032
- Figure 96: South America Protein A Resins Industry Volume (K Unit), by End User 2024 & 2032
- Figure 97: South America Protein A Resins Industry Revenue Share (%), by End User 2024 & 2032
- Figure 98: South America Protein A Resins Industry Volume Share (%), by End User 2024 & 2032
- Figure 99: South America Protein A Resins Industry Revenue (Million), by Country 2024 & 2032
- Figure 100: South America Protein A Resins Industry Volume (K Unit), by Country 2024 & 2032
- Figure 101: South America Protein A Resins Industry Revenue Share (%), by Country 2024 & 2032
- Figure 102: South America Protein A Resins Industry Volume Share (%), by Country 2024 & 2032
List of Tables
- Table 1: Global Protein A Resins Industry Revenue Million Forecast, by Region 2019 & 2032
- Table 2: Global Protein A Resins Industry Volume K Unit Forecast, by Region 2019 & 2032
- Table 3: Global Protein A Resins Industry Revenue Million Forecast, by Product 2019 & 2032
- Table 4: Global Protein A Resins Industry Volume K Unit Forecast, by Product 2019 & 2032
- Table 5: Global Protein A Resins Industry Revenue Million Forecast, by Application 2019 & 2032
- Table 6: Global Protein A Resins Industry Volume K Unit Forecast, by Application 2019 & 2032
- Table 7: Global Protein A Resins Industry Revenue Million Forecast, by End User 2019 & 2032
- Table 8: Global Protein A Resins Industry Volume K Unit Forecast, by End User 2019 & 2032
- Table 9: Global Protein A Resins Industry Revenue Million Forecast, by Region 2019 & 2032
- Table 10: Global Protein A Resins Industry Volume K Unit Forecast, by Region 2019 & 2032
- Table 11: Global Protein A Resins Industry Revenue Million Forecast, by Country 2019 & 2032
- Table 12: Global Protein A Resins Industry Volume K Unit Forecast, by Country 2019 & 2032
- Table 13: United States Protein A Resins Industry Revenue (Million) Forecast, by Application 2019 & 2032
- Table 14: United States Protein A Resins Industry Volume (K Unit) Forecast, by Application 2019 & 2032
- Table 15: Canada Protein A Resins Industry Revenue (Million) Forecast, by Application 2019 & 2032
- Table 16: Canada Protein A Resins Industry Volume (K Unit) Forecast, by Application 2019 & 2032
- Table 17: Mexico Protein A Resins Industry Revenue (Million) Forecast, by Application 2019 & 2032
- Table 18: Mexico Protein A Resins Industry Volume (K Unit) Forecast, by Application 2019 & 2032
- Table 19: Global Protein A Resins Industry Revenue Million Forecast, by Country 2019 & 2032
- Table 20: Global Protein A Resins Industry Volume K Unit Forecast, by Country 2019 & 2032
- Table 21: Germany Protein A Resins Industry Revenue (Million) Forecast, by Application 2019 & 2032
- Table 22: Germany Protein A Resins Industry Volume (K Unit) Forecast, by Application 2019 & 2032
- Table 23: United Kingdom Protein A Resins Industry Revenue (Million) Forecast, by Application 2019 & 2032
- Table 24: United Kingdom Protein A Resins Industry Volume (K Unit) Forecast, by Application 2019 & 2032
- Table 25: France Protein A Resins Industry Revenue (Million) Forecast, by Application 2019 & 2032
- Table 26: France Protein A Resins Industry Volume (K Unit) Forecast, by Application 2019 & 2032
- Table 27: Italy Protein A Resins Industry Revenue (Million) Forecast, by Application 2019 & 2032
- Table 28: Italy Protein A Resins Industry Volume (K Unit) Forecast, by Application 2019 & 2032
- Table 29: Spain Protein A Resins Industry Revenue (Million) Forecast, by Application 2019 & 2032
- Table 30: Spain Protein A Resins Industry Volume (K Unit) Forecast, by Application 2019 & 2032
- Table 31: Rest of Europe Protein A Resins Industry Revenue (Million) Forecast, by Application 2019 & 2032
- Table 32: Rest of Europe Protein A Resins Industry Volume (K Unit) Forecast, by Application 2019 & 2032
- Table 33: Global Protein A Resins Industry Revenue Million Forecast, by Country 2019 & 2032
- Table 34: Global Protein A Resins Industry Volume K Unit Forecast, by Country 2019 & 2032
- Table 35: China Protein A Resins Industry Revenue (Million) Forecast, by Application 2019 & 2032
- Table 36: China Protein A Resins Industry Volume (K Unit) Forecast, by Application 2019 & 2032
- Table 37: Japan Protein A Resins Industry Revenue (Million) Forecast, by Application 2019 & 2032
- Table 38: Japan Protein A Resins Industry Volume (K Unit) Forecast, by Application 2019 & 2032
- Table 39: India Protein A Resins Industry Revenue (Million) Forecast, by Application 2019 & 2032
- Table 40: India Protein A Resins Industry Volume (K Unit) Forecast, by Application 2019 & 2032
- Table 41: Australia Protein A Resins Industry Revenue (Million) Forecast, by Application 2019 & 2032
- Table 42: Australia Protein A Resins Industry Volume (K Unit) Forecast, by Application 2019 & 2032
- Table 43: South Korea Protein A Resins Industry Revenue (Million) Forecast, by Application 2019 & 2032
- Table 44: South Korea Protein A Resins Industry Volume (K Unit) Forecast, by Application 2019 & 2032
- Table 45: Rest of Asia Pacific Protein A Resins Industry Revenue (Million) Forecast, by Application 2019 & 2032
- Table 46: Rest of Asia Pacific Protein A Resins Industry Volume (K Unit) Forecast, by Application 2019 & 2032
- Table 47: Global Protein A Resins Industry Revenue Million Forecast, by Country 2019 & 2032
- Table 48: Global Protein A Resins Industry Volume K Unit Forecast, by Country 2019 & 2032
- Table 49: GCC Protein A Resins Industry Revenue (Million) Forecast, by Application 2019 & 2032
- Table 50: GCC Protein A Resins Industry Volume (K Unit) Forecast, by Application 2019 & 2032
- Table 51: South Africa Protein A Resins Industry Revenue (Million) Forecast, by Application 2019 & 2032
- Table 52: South Africa Protein A Resins Industry Volume (K Unit) Forecast, by Application 2019 & 2032
- Table 53: Rest of Middle East and Africa Protein A Resins Industry Revenue (Million) Forecast, by Application 2019 & 2032
- Table 54: Rest of Middle East and Africa Protein A Resins Industry Volume (K Unit) Forecast, by Application 2019 & 2032
- Table 55: Global Protein A Resins Industry Revenue Million Forecast, by Country 2019 & 2032
- Table 56: Global Protein A Resins Industry Volume K Unit Forecast, by Country 2019 & 2032
- Table 57: Brazil Protein A Resins Industry Revenue (Million) Forecast, by Application 2019 & 2032
- Table 58: Brazil Protein A Resins Industry Volume (K Unit) Forecast, by Application 2019 & 2032
- Table 59: Argentina Protein A Resins Industry Revenue (Million) Forecast, by Application 2019 & 2032
- Table 60: Argentina Protein A Resins Industry Volume (K Unit) Forecast, by Application 2019 & 2032
- Table 61: Rest of South America Protein A Resins Industry Revenue (Million) Forecast, by Application 2019 & 2032
- Table 62: Rest of South America Protein A Resins Industry Volume (K Unit) Forecast, by Application 2019 & 2032
- Table 63: Global Protein A Resins Industry Revenue Million Forecast, by Product 2019 & 2032
- Table 64: Global Protein A Resins Industry Volume K Unit Forecast, by Product 2019 & 2032
- Table 65: Global Protein A Resins Industry Revenue Million Forecast, by Application 2019 & 2032
- Table 66: Global Protein A Resins Industry Volume K Unit Forecast, by Application 2019 & 2032
- Table 67: Global Protein A Resins Industry Revenue Million Forecast, by End User 2019 & 2032
- Table 68: Global Protein A Resins Industry Volume K Unit Forecast, by End User 2019 & 2032
- Table 69: Global Protein A Resins Industry Revenue Million Forecast, by Country 2019 & 2032
- Table 70: Global Protein A Resins Industry Volume K Unit Forecast, by Country 2019 & 2032
- Table 71: United States Protein A Resins Industry Revenue (Million) Forecast, by Application 2019 & 2032
- Table 72: United States Protein A Resins Industry Volume (K Unit) Forecast, by Application 2019 & 2032
- Table 73: Canada Protein A Resins Industry Revenue (Million) Forecast, by Application 2019 & 2032
- Table 74: Canada Protein A Resins Industry Volume (K Unit) Forecast, by Application 2019 & 2032
- Table 75: Mexico Protein A Resins Industry Revenue (Million) Forecast, by Application 2019 & 2032
- Table 76: Mexico Protein A Resins Industry Volume (K Unit) Forecast, by Application 2019 & 2032
- Table 77: Global Protein A Resins Industry Revenue Million Forecast, by Product 2019 & 2032
- Table 78: Global Protein A Resins Industry Volume K Unit Forecast, by Product 2019 & 2032
- Table 79: Global Protein A Resins Industry Revenue Million Forecast, by Application 2019 & 2032
- Table 80: Global Protein A Resins Industry Volume K Unit Forecast, by Application 2019 & 2032
- Table 81: Global Protein A Resins Industry Revenue Million Forecast, by End User 2019 & 2032
- Table 82: Global Protein A Resins Industry Volume K Unit Forecast, by End User 2019 & 2032
- Table 83: Global Protein A Resins Industry Revenue Million Forecast, by Country 2019 & 2032
- Table 84: Global Protein A Resins Industry Volume K Unit Forecast, by Country 2019 & 2032
- Table 85: Germany Protein A Resins Industry Revenue (Million) Forecast, by Application 2019 & 2032
- Table 86: Germany Protein A Resins Industry Volume (K Unit) Forecast, by Application 2019 & 2032
- Table 87: United Kingdom Protein A Resins Industry Revenue (Million) Forecast, by Application 2019 & 2032
- Table 88: United Kingdom Protein A Resins Industry Volume (K Unit) Forecast, by Application 2019 & 2032
- Table 89: France Protein A Resins Industry Revenue (Million) Forecast, by Application 2019 & 2032
- Table 90: France Protein A Resins Industry Volume (K Unit) Forecast, by Application 2019 & 2032
- Table 91: Italy Protein A Resins Industry Revenue (Million) Forecast, by Application 2019 & 2032
- Table 92: Italy Protein A Resins Industry Volume (K Unit) Forecast, by Application 2019 & 2032
- Table 93: Spain Protein A Resins Industry Revenue (Million) Forecast, by Application 2019 & 2032
- Table 94: Spain Protein A Resins Industry Volume (K Unit) Forecast, by Application 2019 & 2032
- Table 95: Rest of Europe Protein A Resins Industry Revenue (Million) Forecast, by Application 2019 & 2032
- Table 96: Rest of Europe Protein A Resins Industry Volume (K Unit) Forecast, by Application 2019 & 2032
- Table 97: Global Protein A Resins Industry Revenue Million Forecast, by Product 2019 & 2032
- Table 98: Global Protein A Resins Industry Volume K Unit Forecast, by Product 2019 & 2032
- Table 99: Global Protein A Resins Industry Revenue Million Forecast, by Application 2019 & 2032
- Table 100: Global Protein A Resins Industry Volume K Unit Forecast, by Application 2019 & 2032
- Table 101: Global Protein A Resins Industry Revenue Million Forecast, by End User 2019 & 2032
- Table 102: Global Protein A Resins Industry Volume K Unit Forecast, by End User 2019 & 2032
- Table 103: Global Protein A Resins Industry Revenue Million Forecast, by Country 2019 & 2032
- Table 104: Global Protein A Resins Industry Volume K Unit Forecast, by Country 2019 & 2032
- Table 105: China Protein A Resins Industry Revenue (Million) Forecast, by Application 2019 & 2032
- Table 106: China Protein A Resins Industry Volume (K Unit) Forecast, by Application 2019 & 2032
- Table 107: Japan Protein A Resins Industry Revenue (Million) Forecast, by Application 2019 & 2032
- Table 108: Japan Protein A Resins Industry Volume (K Unit) Forecast, by Application 2019 & 2032
- Table 109: India Protein A Resins Industry Revenue (Million) Forecast, by Application 2019 & 2032
- Table 110: India Protein A Resins Industry Volume (K Unit) Forecast, by Application 2019 & 2032
- Table 111: Australia Protein A Resins Industry Revenue (Million) Forecast, by Application 2019 & 2032
- Table 112: Australia Protein A Resins Industry Volume (K Unit) Forecast, by Application 2019 & 2032
- Table 113: South Korea Protein A Resins Industry Revenue (Million) Forecast, by Application 2019 & 2032
- Table 114: South Korea Protein A Resins Industry Volume (K Unit) Forecast, by Application 2019 & 2032
- Table 115: Rest of Asia Pacific Protein A Resins Industry Revenue (Million) Forecast, by Application 2019 & 2032
- Table 116: Rest of Asia Pacific Protein A Resins Industry Volume (K Unit) Forecast, by Application 2019 & 2032
- Table 117: Global Protein A Resins Industry Revenue Million Forecast, by Product 2019 & 2032
- Table 118: Global Protein A Resins Industry Volume K Unit Forecast, by Product 2019 & 2032
- Table 119: Global Protein A Resins Industry Revenue Million Forecast, by Application 2019 & 2032
- Table 120: Global Protein A Resins Industry Volume K Unit Forecast, by Application 2019 & 2032
- Table 121: Global Protein A Resins Industry Revenue Million Forecast, by End User 2019 & 2032
- Table 122: Global Protein A Resins Industry Volume K Unit Forecast, by End User 2019 & 2032
- Table 123: Global Protein A Resins Industry Revenue Million Forecast, by Country 2019 & 2032
- Table 124: Global Protein A Resins Industry Volume K Unit Forecast, by Country 2019 & 2032
- Table 125: GCC Protein A Resins Industry Revenue (Million) Forecast, by Application 2019 & 2032
- Table 126: GCC Protein A Resins Industry Volume (K Unit) Forecast, by Application 2019 & 2032
- Table 127: South Africa Protein A Resins Industry Revenue (Million) Forecast, by Application 2019 & 2032
- Table 128: South Africa Protein A Resins Industry Volume (K Unit) Forecast, by Application 2019 & 2032
- Table 129: Rest of Middle East and Africa Protein A Resins Industry Revenue (Million) Forecast, by Application 2019 & 2032
- Table 130: Rest of Middle East and Africa Protein A Resins Industry Volume (K Unit) Forecast, by Application 2019 & 2032
- Table 131: Global Protein A Resins Industry Revenue Million Forecast, by Product 2019 & 2032
- Table 132: Global Protein A Resins Industry Volume K Unit Forecast, by Product 2019 & 2032
- Table 133: Global Protein A Resins Industry Revenue Million Forecast, by Application 2019 & 2032
- Table 134: Global Protein A Resins Industry Volume K Unit Forecast, by Application 2019 & 2032
- Table 135: Global Protein A Resins Industry Revenue Million Forecast, by End User 2019 & 2032
- Table 136: Global Protein A Resins Industry Volume K Unit Forecast, by End User 2019 & 2032
- Table 137: Global Protein A Resins Industry Revenue Million Forecast, by Country 2019 & 2032
- Table 138: Global Protein A Resins Industry Volume K Unit Forecast, by Country 2019 & 2032
- Table 139: Brazil Protein A Resins Industry Revenue (Million) Forecast, by Application 2019 & 2032
- Table 140: Brazil Protein A Resins Industry Volume (K Unit) Forecast, by Application 2019 & 2032
- Table 141: Argentina Protein A Resins Industry Revenue (Million) Forecast, by Application 2019 & 2032
- Table 142: Argentina Protein A Resins Industry Volume (K Unit) Forecast, by Application 2019 & 2032
- Table 143: Rest of South America Protein A Resins Industry Revenue (Million) Forecast, by Application 2019 & 2032
- Table 144: Rest of South America Protein A Resins Industry Volume (K Unit) Forecast, by Application 2019 & 2032
Frequently Asked Questions
1. What is the projected Compound Annual Growth Rate (CAGR) of the Protein A Resins Industry?
The projected CAGR is approximately 8.69%.
2. Which companies are prominent players in the Protein A Resins Industry?
Key companies in the market include Abcam Limited, Repligen Corporation, Bio-Rad Laboratories Inc, Merck KGaA, JSR Life Sciences, Kaneka Corporation, Genscript Corporation, Tosoh Bioscience LLC, Danaher Corporation (Cytiva), Axplora, Thermofisher Scientific Inc, Agarose Beads Technologies, Ecolab Inc (Purolite Lifesciences).
3. What are the main segments of the Protein A Resins Industry?
The market segments include Product, Application, End User.
4. Can you provide details about the market size?
The market size is estimated to be USD 1.17 Million as of 2022.
5. What are some drivers contributing to market growth?
Increasing Demand for Antibodies; Increasing Number of Drug Discoveries and R&D Activities.
6. What are the notable trends driving market growth?
Pharmaceutical and Biopharmaceutical Companies are Expected to Dominate the End User Segment.
7. Are there any restraints impacting market growth?
High Cost Associated With Protein A Resin.
8. Can you provide examples of recent developments in the market?
February 2024: Purolite, an Ecolab company, and Repligen Corporation reported the commercial launch of Praesto CH1, a new 70 μm (micron) agarose-based affinity resin designed to purify specialized mAbs such as bispecifics and recombinant antibody fragments.
9. What pricing options are available for accessing the report?
Pricing options include single-user, multi-user, and enterprise licenses priced at USD 4750, USD 5250, and USD 8750 respectively.
10. Is the market size provided in terms of value or volume?
The market size is provided in terms of value, measured in Million and volume, measured in K Unit.
11. Are there any specific market keywords associated with the report?
Yes, the market keyword associated with the report is "Protein A Resins Industry," which aids in identifying and referencing the specific market segment covered.
12. How do I determine which pricing option suits my needs best?
The pricing options vary based on user requirements and access needs. Individual users may opt for single-user licenses, while businesses requiring broader access may choose multi-user or enterprise licenses for cost-effective access to the report.
13. Are there any additional resources or data provided in the Protein A Resins Industry report?
While the report offers comprehensive insights, it's advisable to review the specific contents or supplementary materials provided to ascertain if additional resources or data are available.
14. How can I stay updated on further developments or reports in the Protein A Resins Industry?
To stay informed about further developments, trends, and reports in the Protein A Resins Industry, consider subscribing to industry newsletters, following relevant companies and organizations, or regularly checking reputable industry news sources and publications.
Methodology
Step 1 - Identification of Relevant Samples Size from Population Database


Step 2 - Approaches for Defining Global Market Size (Value, Volume* & Price*)

Note*: In applicable scenarios
Step 3 - Data Sources
Primary Research
- Web Analytics
- Survey Reports
- Research Institute
- Latest Research Reports
- Opinion Leaders
Secondary Research
- Annual Reports
- White Paper
- Latest Press Release
- Industry Association
- Paid Database
- Investor Presentations

Step 4 - Data Triangulation
Involves using different sources of information in order to increase the validity of a study
These sources are likely to be stakeholders in a program - participants, other researchers, program staff, other community members, and so on.
Then we put all data in single framework & apply various statistical tools to find out the dynamic on the market.
During the analysis stage, feedback from the stakeholder groups would be compared to determine areas of agreement as well as areas of divergence
