

Key Insights
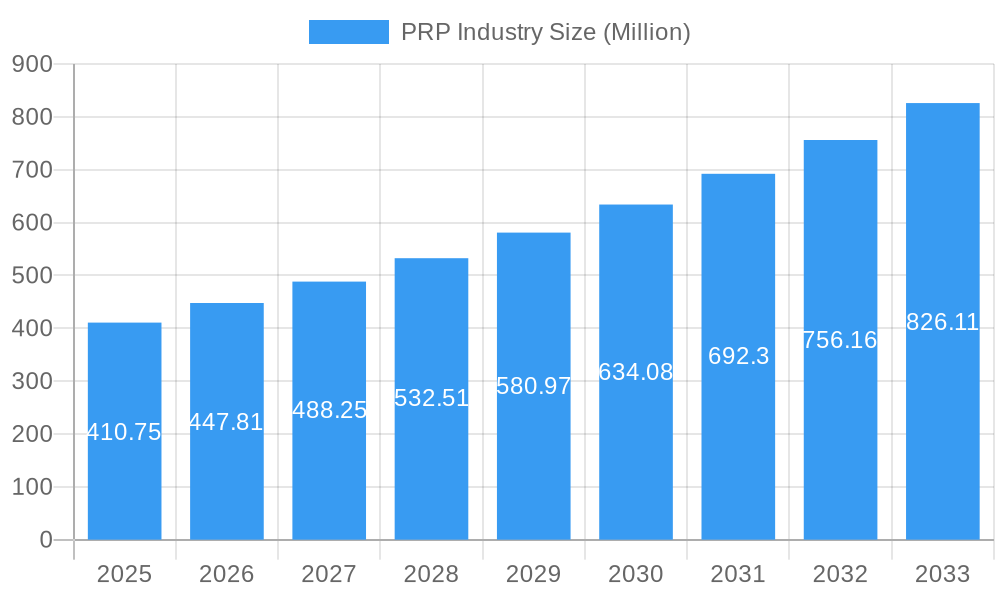
The global Platelet-Rich Plasma (PRP) market is poised for significant expansion, projected to reach approximately USD 410.75 million by 2025, with a robust Compound Annual Growth Rate (CAGR) of 9.03% expected to drive its trajectory through 2033. This impressive growth is fueled by the escalating adoption of PRP therapies across a spectrum of medical disciplines, notably orthopedics, cosmetic surgery, and dermatology. The inherent regenerative properties of PRP, derived from a patient's own blood, make it an increasingly sought-after alternative to traditional treatments, offering reduced recovery times and enhanced healing outcomes. Advancements in PRP preparation techniques and the development of sophisticated collection systems are further contributing to market dynamism, enabling more precise and effective therapeutic applications. The increasing prevalence of sports-related injuries, degenerative joint diseases, and aesthetic concerns globally acts as a primary impetus for this market's upward momentum.
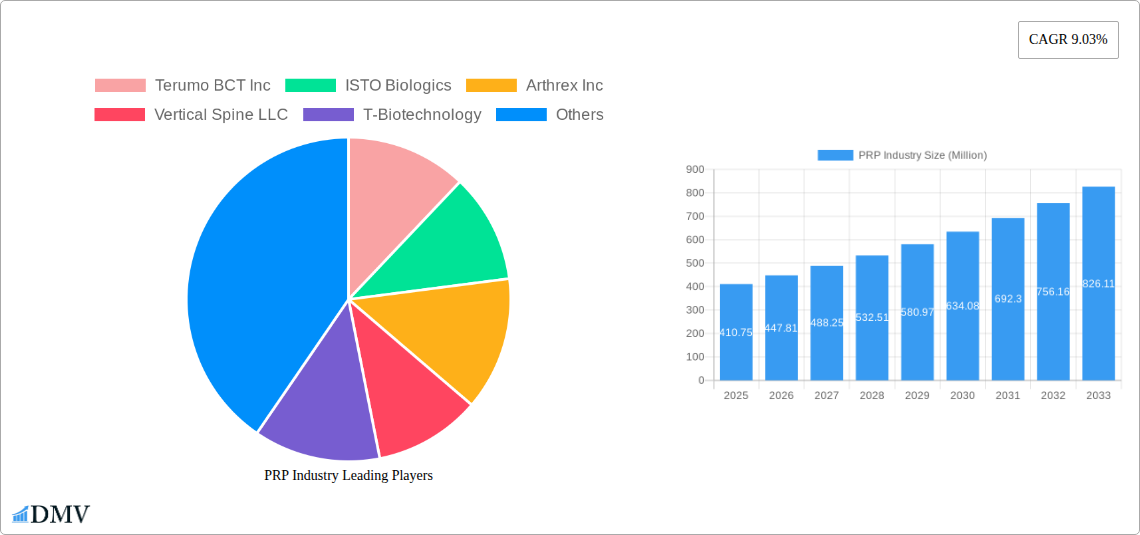
PRP Industry Market Size (In Million)
Looking ahead, the market is anticipated to witness sustained growth driven by several key factors. The expanding understanding and clinical validation of PRP's efficacy in diverse applications, including wound healing, hair restoration, and facial rejuvenation, are opening new avenues for market penetration. Furthermore, the growing demand for minimally invasive procedures and non-surgical cosmetic enhancements is directly translating into a higher adoption rate for PRP treatments. While the market is characterized by a fragmented landscape with numerous players, strategic collaborations, product innovations, and geographical expansions are expected to be defining trends. The increasing investment in research and development by leading companies is crucial for unlocking the full potential of PRP in addressing a wider array of medical conditions and improving patient quality of life.
PRP Industry Company Market Share
PRP Industry Market Composition & Trends
The Platelet-Rich Plasma (PRP) market exhibits a dynamic yet consolidating landscape, driven by increasing adoption across diverse medical specialties and a growing understanding of its regenerative potential. Market concentration is moderate, with key players like Terumo BCT Inc., ISTO Biologics, and Arthrex Inc. holding significant shares, estimated in the range of 15-20% each. Innovation remains a critical catalyst, spurred by continuous research into optimizing PRP preparation and application techniques, particularly for leukocyte-rich formulations. Regulatory landscapes, while evolving, are generally favorable, with a focus on safety and efficacy. Substitute products, such as stem cell therapies and hyaluronic acid fillers, present competition, but PRP's cost-effectiveness and autologous nature often provide a competitive edge. End-user profiles are broadening from primarily orthopedic and cosmetic surgery to encompass neurology, cardiology, and ophthalmology. Merger and acquisition (M&A) activities are on the rise, indicative of strategic consolidation. Notable M&A deals in recent years are valued between $50 Million and $150 Million, as companies seek to expand their product portfolios and market reach.
- Market Share Distribution (Estimated):
- Terumo BCT Inc.: 18%
- ISTO Biologics: 16%
- Arthrex Inc.: 15%
- Zimmer Biomet: 10%
- EmCyte Corporation: 8%
- Others: 23%
- Key Innovation Areas:
- Development of standardized PRP preparation protocols.
- Enhanced platelet yield and growth factor concentration.
- Integration of PRP with advanced delivery systems.
- M&A Activity Value Range: $50 Million – $150 Million
PRP Industry Industry Evolution
The Platelet-Rich Plasma (PRP) industry has undergone a significant evolution, transforming from a niche therapeutic modality to a mainstream regenerative medicine solution. The historical period from 2019 to 2024 witnessed robust growth, driven by increasing clinical evidence supporting PRP's efficacy in accelerating healing and reducing inflammation across a spectrum of medical applications. This growth trajectory, estimated at an average annual rate of 12-15%, was further propelled by technological advancements in PRP collection and processing systems. Companies developed more sophisticated devices that enhance platelet concentration and ensure higher yields of crucial growth factors, leading to improved patient outcomes and greater clinician confidence.
The base year of 2025 marks a pivotal point, with the market expected to reach an estimated value of $1,800 Million. This valuation reflects the cumulative impact of years of research, product development, and widening clinical acceptance. Shifting consumer demands also play a crucial role; patients are increasingly seeking minimally invasive, natural treatment options for pain management, tissue regeneration, and aesthetic enhancement, making PRP an attractive alternative to traditional surgical interventions. This demand fuels further investment in R&D, leading to the exploration of novel applications in areas like wound healing, hair restoration, and even systemic inflammatory conditions.
The forecast period from 2025 to 2033 is projected to see continued expansion, with an anticipated Compound Annual Growth Rate (CAGR) of approximately 10-12%. This sustained growth will be underpinned by several factors, including the expansion of PRP into underserved markets, the development of combination therapies leveraging PRP with other regenerative modalities, and a growing body of long-term clinical data demonstrating its sustained benefits. The increasing prevalence of age-related degenerative conditions and sports injuries will continue to create a consistent demand for effective, regenerative treatments like PRP. Furthermore, advancements in exosome research and the potential role of PRP-derived exosomes in cellular communication are opening new frontiers for therapeutic innovation, promising even greater efficacy and broader applicability in the coming years. The industry's evolution is characterized by a continuous cycle of scientific validation, technological refinement, and market expansion, solidifying PRP's position as a cornerstone of modern regenerative medicine.
Leading Regions, Countries, or Segments in PRP Industry
The Platelet-Rich Plasma (PRP) industry is experiencing significant regional growth, with North America currently leading in market dominance. This leadership is attributable to several key drivers, including a highly developed healthcare infrastructure, substantial investments in medical research and development, and a proactive regulatory environment that supports the adoption of innovative medical technologies. The United States, in particular, represents a substantial portion of the global PRP market, fueled by a high prevalence of sports injuries, an aging population seeking cosmetic and orthopedic treatments, and a strong presence of leading PRP technology manufacturers and research institutions.
Within North America, the Orthopedics application segment stands out as the primary driver of market growth. This dominance is driven by the widespread use of PRP in treating conditions such as osteoarthritis, tendinopathies, ligament injuries, and muscle tears. The efficacy of PRP in accelerating bone and soft tissue healing, reducing pain, and improving joint function has led to its extensive adoption by orthopedic surgeons and sports medicine practitioners. The Hospitals and Clinics end-user segment also plays a pivotal role, as these facilities are the primary centers for PRP treatment delivery, equipped with the necessary infrastructure and trained personnel.
Looking at product types, Pure PRP remains a significant segment due to its straightforward preparation and established clinical protocols. However, Leukocyte-rich PRP (LR-PRP) is gaining substantial traction, especially in orthopedic and wound healing applications where its enhanced anti-inflammatory and antimicrobial properties are highly valued. The market share for LR-PRP is projected to grow at a faster pace due to its perceived superior efficacy in certain clinical scenarios.
The following are key drivers and factors contributing to the dominance of North America and the Orthopedics segment:
- Investment Trends: Significant venture capital and private equity investments are being channeled into PRP technology developers and treatment providers in the region, fostering innovation and market expansion. For instance, investment rounds in the range of $20 Million to $50 Million are not uncommon for promising PRP companies.
- Regulatory Support: While stringent, the regulatory framework in the US, managed by bodies like the FDA, provides clear pathways for market approval for PRP devices and protocols, encouraging innovation and commercialization.
- Research & Development: A robust ecosystem of universities, research hospitals, and private companies actively conducts clinical trials and publishes findings that validate PRP's therapeutic benefits, thereby driving adoption.
- Technological Advancements: Leading companies like Arthrex Inc. and Terumo BCT Inc. are headquartered or have a strong presence in North America, driving the development of advanced PRP collection and processing systems, often valued between $10,000 and $50,000 per unit.
- High Patient Awareness and Demand: A well-informed patient population, particularly in North America, actively seeks out regenerative therapies for pain management and aesthetic enhancement, contributing to the high volume of PRP procedures.
- Prevalence of Sports Medicine and Orthopedic Clinics: The high incidence of sports-related injuries and a large aging demographic necessitate effective orthopedic interventions, making PRP a preferred choice for conservative management.
While other regions like Europe and Asia-Pacific are experiencing substantial growth, North America's established infrastructure, investment climate, and strong clinical evidence base currently position it as the leading market for PRP. The continued focus on regenerative medicine and evidence-based treatments will ensure its sustained leadership in the foreseeable future.
PRP Industry Product Innovations
The PRP industry is continuously evolving with groundbreaking product innovations aimed at enhancing efficacy, user-friendliness, and expanding therapeutic applications. Recent advancements include the development of advanced centrifuge systems capable of yielding highly concentrated platelet suspensions with optimized growth factor profiles, often achieving platelet concentrations of 5-8 times baseline levels. Innovations in leukoreduction filters and apheresis techniques are leading to more refined leukocyte-rich PRP (LR-PRP) and leukocyte-poor PRP (LP-PRP) options, catering to specific clinical needs, such as reducing inflammatory responses or maximizing growth factor delivery. Furthermore, the integration of PRP with bio-scaffolds and other regenerative materials is creating novel combination therapies that promote superior tissue regeneration. The performance metrics of these new products are demonstrating improved healing times and reduced pain scores by an estimated 30-40% in clinical trials for orthopedic indications.
Propelling Factors for PRP Industry Growth
The growth of the PRP industry is propelled by a confluence of significant factors, primarily driven by technological advancements and increasing clinical validation. The development of more sophisticated PRP preparation devices, offering higher platelet yields and customizable concentration levels, has significantly enhanced treatment efficacy. Furthermore, a growing body of peer-reviewed research and clinical trials consistently demonstrates the therapeutic benefits of PRP across a wide range of applications, from orthopedics to cosmetic surgery and wound healing. This evidence base is crucial for clinician adoption and patient confidence. Regulatory bodies in many regions are also streamlining approval processes for PRP-related technologies, further encouraging market expansion. Economic factors, including the cost-effectiveness of PRP compared to more invasive surgical procedures, also contribute to its widespread adoption, particularly in healthcare systems aiming to manage costs.
Obstacles in the PRP Industry Market
Despite its promising growth, the PRP industry faces several obstacles that hinder its full potential. Regulatory inconsistencies across different countries and regions can create market access challenges and increase the cost of compliance for manufacturers. The lack of standardized protocols for PRP preparation and application, while improving, can lead to variability in treatment outcomes and a perception of inconsistency among some clinicians. Supply chain disruptions, exacerbated by global events, can impact the availability of essential components and reagents for PRP production. Furthermore, competition from alternative regenerative therapies, such as stem cell treatments, which are often perceived as more advanced, poses a challenge. High upfront costs for some advanced PRP systems, ranging from $10,000 to $50,000, can also be a barrier for smaller clinics or in resource-limited settings.
Future Opportunities in PRP Industry
The future of the PRP industry is rich with opportunities for innovation and market expansion. Emerging applications in areas like neurological disorders, cardiovascular diseases, and ocular conditions are presenting vast untapped potential, with initial research showing promising results. The development of advanced exosome-based therapies derived from PRP offers a new frontier for targeted regenerative medicine, potentially leading to even more potent and precise treatments. Furthermore, the increasing patient demand for non-surgical and aesthetically pleasing solutions will continue to drive the growth of PRP in cosmetic surgery and dermatology, particularly in facial rejuvenation and hair restoration. The expansion of PRP into developing economies, where healthcare costs are a significant consideration, presents a substantial market opportunity. Strategic collaborations between PRP manufacturers and research institutions will be crucial for unlocking these opportunities and driving further clinical validation.
Major Players in the PRP Industry Ecosystem
- Terumo BCT Inc.
- ISTO Biologics
- Arthrex Inc.
- Vertical Spine LLC
- T-Biotechnology
- DePuy Synthes
- EmCyte Corporation
- Isto Biologics
- Harvest Technologies Corporation
- Glofinn Oy
- Zimmer Biomet
- Dr PRP USA LLC
Key Developments in PRP Industry Industry
- February 2021: Atlas Health Medical Group announced PRP (Platelet-rich Plasma) Microneedling Facelifts for patients, expanding the application of PRP into advanced dermatological aesthetic treatments.
- February 2020: EmCyte completed the acquisition of Cellmedix Holdings LLC, including all the assets of the US-based company, which also included its proprietary product system, namely Centrepid Platelet Concentrator, consolidating market positions and enhancing product portfolios in the PRP sector.
Strategic PRP Industry Market Forecast
The strategic forecast for the PRP industry is exceptionally positive, driven by robust market dynamics and a clear path for expansion. The projected market growth, estimated to reach $2,900 Million by 2033, is underpinned by continuous innovation in PRP preparation and delivery systems, alongside an ever-expanding portfolio of clinical applications. Key growth catalysts include the increasing adoption of PRP in regenerative medicine for a wider array of orthopedic, cosmetic, and potentially other medical conditions, fueled by compelling clinical evidence and favorable patient outcomes. Furthermore, strategic partnerships and mergers between key industry players are expected to enhance market consolidation and drive research and development, leading to more sophisticated and targeted PRP-based therapies. The forecast also anticipates a surge in demand from emerging economies, where the cost-effectiveness and minimally invasive nature of PRP treatments align well with healthcare needs, further solidifying its position as a cornerstone of modern regenerative medicine.
PRP Industry Segmentation
-
1. Type
- 1.1. Pure PRP
- 1.2. Leukocyte-rich PRP
- 1.3. Leukocyte-rich Fibrin
- 1.4. Other Types
-
2. Application
- 2.1. Orthopedics
- 2.2. Cosmetic Surgery and Dermatology
- 2.3. Neurology
- 2.4. Cardiology
- 2.5. Ophthalmology
- 2.6. Other Applications
-
3. End User
- 3.1. Hospitals and Clinics
- 3.2. Research Institutes
PRP Industry Segmentation By Geography
-
1. North America
- 1.1. United States
- 1.2. Canada
- 1.3. Mexico
-
2. Europe
- 2.1. Germany
- 2.2. United Kingdom
- 2.3. France
- 2.4. Italy
- 2.5. Spain
- 2.6. Rest of Europe
-
3. Asia Pacific
- 3.1. China
- 3.2. Japan
- 3.3. India
- 3.4. Australia
- 3.5. South Korea
- 3.6. Rest of Asia Pacific
- 4. Middle East
-
5. GCC
- 5.1. South Africa
- 5.2. Rest of Middle East
-
6. South America
- 6.1. Brazil
- 6.2. Argentina
- 6.3. Rest of South America
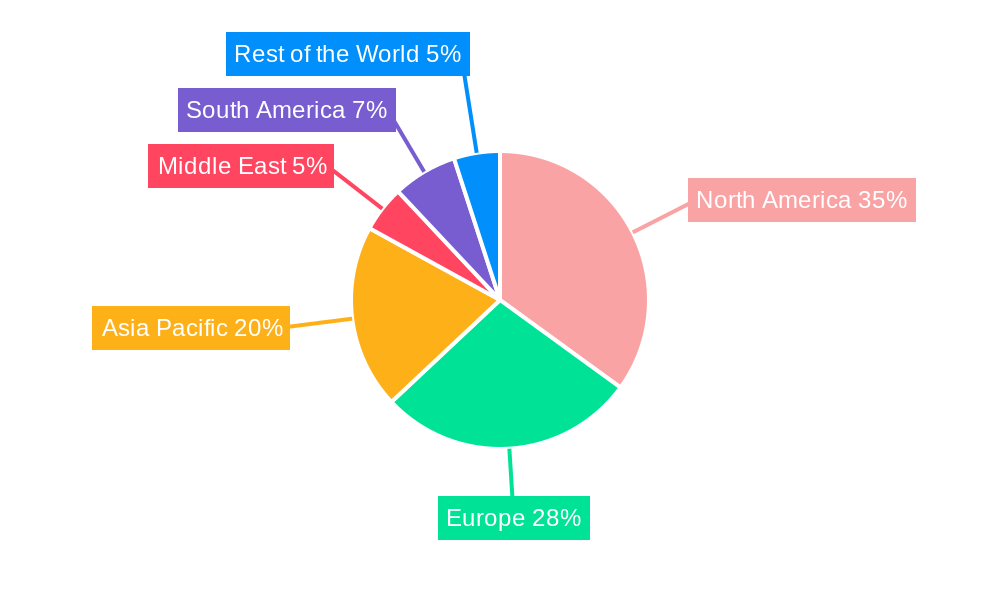
PRP Industry Regional Market Share
Geographic Coverage of PRP Industry
PRP Industry REPORT HIGHLIGHTS
| Aspects | Details |
|---|---|
| Study Period | 2020-2034 |
| Base Year | 2025 |
| Estimated Year | 2026 |
| Forecast Period | 2026-2034 |
| Historical Period | 2020-2025 |
| Growth Rate | CAGR of 9.03% from 2020-2034 |
| Segmentation |
|
Table of Contents
- 1. Introduction
- 1.1. Research Scope
- 1.2. Market Segmentation
- 1.3. Research Objective
- 1.4. Definitions and Assumptions
- 2. Executive Summary
- 2.1. Market Snapshot
- 3. Market Dynamics
- 3.1. Market Drivers
- 3.2. Market Restrains
- 3.3. Market Trends
- 3.4. Market Opportunities
- 4. Market Factor Analysis
- 4.1. Porters Five Forces
- 4.1.1. Bargaining Power of Suppliers
- 4.1.2. Bargaining Power of Buyers
- 4.1.3. Threat of New Entrants
- 4.1.4. Threat of Substitutes
- 4.1.5. Competitive Rivalry
- 4.2. PESTEL analysis
- 4.3. BCG Analysis
- 4.3.1. Stars (High Growth, High Market Share)
- 4.3.2. Cash Cows (Low Growth, High Market Share)
- 4.3.3. Question Mark (High Growth, Low Market Share)
- 4.3.4. Dogs (Low Growth, Low Market Share)
- 4.4. Ansoff Matrix Analysis
- 4.5. Supply Chain Analysis
- 4.6. Regulatory Landscape
- 4.7. Current Market Potential and Opportunity Assessment (TAM–SAM–SOM Framework)
- 4.8. DMV Analyst Note
- 4.1. Porters Five Forces
- 5. Market Analysis, Insights and Forecast 2021-2033
- 5.1. Market Analysis, Insights and Forecast - by Type
- 5.1.1. Pure PRP
- 5.1.2. Leukocyte-rich PRP
- 5.1.3. Leukocyte-rich Fibrin
- 5.1.4. Other Types
- 5.2. Market Analysis, Insights and Forecast - by Application
- 5.2.1. Orthopedics
- 5.2.2. Cosmetic Surgery and Dermatology
- 5.2.3. Neurology
- 5.2.4. Cardiology
- 5.2.5. Ophthalmology
- 5.2.6. Other Applications
- 5.3. Market Analysis, Insights and Forecast - by End User
- 5.3.1. Hospitals and Clinics
- 5.3.2. Research Institutes
- 5.4. Market Analysis, Insights and Forecast - by Region
- 5.4.1. North America
- 5.4.2. Europe
- 5.4.3. Asia Pacific
- 5.4.4. Middle East
- 5.4.5. GCC
- 5.4.6. South America
- 5.1. Market Analysis, Insights and Forecast - by Type
- 6. Global PRP Industry Analysis, Insights and Forecast, 2021-2033
- 6.1. Market Analysis, Insights and Forecast - by Type
- 6.1.1. Pure PRP
- 6.1.2. Leukocyte-rich PRP
- 6.1.3. Leukocyte-rich Fibrin
- 6.1.4. Other Types
- 6.2. Market Analysis, Insights and Forecast - by Application
- 6.2.1. Orthopedics
- 6.2.2. Cosmetic Surgery and Dermatology
- 6.2.3. Neurology
- 6.2.4. Cardiology
- 6.2.5. Ophthalmology
- 6.2.6. Other Applications
- 6.3. Market Analysis, Insights and Forecast - by End User
- 6.3.1. Hospitals and Clinics
- 6.3.2. Research Institutes
- 6.1. Market Analysis, Insights and Forecast - by Type
- 7. North America PRP Industry Analysis, Insights and Forecast, 2020-2032
- 7.1. Market Analysis, Insights and Forecast - by Type
- 7.1.1. Pure PRP
- 7.1.2. Leukocyte-rich PRP
- 7.1.3. Leukocyte-rich Fibrin
- 7.1.4. Other Types
- 7.2. Market Analysis, Insights and Forecast - by Application
- 7.2.1. Orthopedics
- 7.2.2. Cosmetic Surgery and Dermatology
- 7.2.3. Neurology
- 7.2.4. Cardiology
- 7.2.5. Ophthalmology
- 7.2.6. Other Applications
- 7.3. Market Analysis, Insights and Forecast - by End User
- 7.3.1. Hospitals and Clinics
- 7.3.2. Research Institutes
- 7.1. Market Analysis, Insights and Forecast - by Type
- 8. Europe PRP Industry Analysis, Insights and Forecast, 2020-2032
- 8.1. Market Analysis, Insights and Forecast - by Type
- 8.1.1. Pure PRP
- 8.1.2. Leukocyte-rich PRP
- 8.1.3. Leukocyte-rich Fibrin
- 8.1.4. Other Types
- 8.2. Market Analysis, Insights and Forecast - by Application
- 8.2.1. Orthopedics
- 8.2.2. Cosmetic Surgery and Dermatology
- 8.2.3. Neurology
- 8.2.4. Cardiology
- 8.2.5. Ophthalmology
- 8.2.6. Other Applications
- 8.3. Market Analysis, Insights and Forecast - by End User
- 8.3.1. Hospitals and Clinics
- 8.3.2. Research Institutes
- 8.1. Market Analysis, Insights and Forecast - by Type
- 9. Asia Pacific PRP Industry Analysis, Insights and Forecast, 2020-2032
- 9.1. Market Analysis, Insights and Forecast - by Type
- 9.1.1. Pure PRP
- 9.1.2. Leukocyte-rich PRP
- 9.1.3. Leukocyte-rich Fibrin
- 9.1.4. Other Types
- 9.2. Market Analysis, Insights and Forecast - by Application
- 9.2.1. Orthopedics
- 9.2.2. Cosmetic Surgery and Dermatology
- 9.2.3. Neurology
- 9.2.4. Cardiology
- 9.2.5. Ophthalmology
- 9.2.6. Other Applications
- 9.3. Market Analysis, Insights and Forecast - by End User
- 9.3.1. Hospitals and Clinics
- 9.3.2. Research Institutes
- 9.1. Market Analysis, Insights and Forecast - by Type
- 10. Middle East PRP Industry Analysis, Insights and Forecast, 2020-2032
- 10.1. Market Analysis, Insights and Forecast - by Type
- 10.1.1. Pure PRP
- 10.1.2. Leukocyte-rich PRP
- 10.1.3. Leukocyte-rich Fibrin
- 10.1.4. Other Types
- 10.2. Market Analysis, Insights and Forecast - by Application
- 10.2.1. Orthopedics
- 10.2.2. Cosmetic Surgery and Dermatology
- 10.2.3. Neurology
- 10.2.4. Cardiology
- 10.2.5. Ophthalmology
- 10.2.6. Other Applications
- 10.3. Market Analysis, Insights and Forecast - by End User
- 10.3.1. Hospitals and Clinics
- 10.3.2. Research Institutes
- 10.1. Market Analysis, Insights and Forecast - by Type
- 11. GCC PRP Industry Analysis, Insights and Forecast, 2020-2032
- 11.1. Market Analysis, Insights and Forecast - by Type
- 11.1.1. Pure PRP
- 11.1.2. Leukocyte-rich PRP
- 11.1.3. Leukocyte-rich Fibrin
- 11.1.4. Other Types
- 11.2. Market Analysis, Insights and Forecast - by Application
- 11.2.1. Orthopedics
- 11.2.2. Cosmetic Surgery and Dermatology
- 11.2.3. Neurology
- 11.2.4. Cardiology
- 11.2.5. Ophthalmology
- 11.2.6. Other Applications
- 11.3. Market Analysis, Insights and Forecast - by End User
- 11.3.1. Hospitals and Clinics
- 11.3.2. Research Institutes
- 11.1. Market Analysis, Insights and Forecast - by Type
- 12. South America PRP Industry Analysis, Insights and Forecast, 2020-2032
- 12.1. Market Analysis, Insights and Forecast - by Type
- 12.1.1. Pure PRP
- 12.1.2. Leukocyte-rich PRP
- 12.1.3. Leukocyte-rich Fibrin
- 12.1.4. Other Types
- 12.2. Market Analysis, Insights and Forecast - by Application
- 12.2.1. Orthopedics
- 12.2.2. Cosmetic Surgery and Dermatology
- 12.2.3. Neurology
- 12.2.4. Cardiology
- 12.2.5. Ophthalmology
- 12.2.6. Other Applications
- 12.3. Market Analysis, Insights and Forecast - by End User
- 12.3.1. Hospitals and Clinics
- 12.3.2. Research Institutes
- 12.1. Market Analysis, Insights and Forecast - by Type
- 13. Competitive Analysis
- 13.1. Company Profiles
- 13.1.1 Terumo BCT Inc
- 13.1.1.1. Company Overview
- 13.1.1.2. Products
- 13.1.1.3. Company Financials
- 13.1.1.4. SWOT Analysis
- 13.1.2 ISTO Biologics
- 13.1.2.1. Company Overview
- 13.1.2.2. Products
- 13.1.2.3. Company Financials
- 13.1.2.4. SWOT Analysis
- 13.1.3 Arthrex Inc
- 13.1.3.1. Company Overview
- 13.1.3.2. Products
- 13.1.3.3. Company Financials
- 13.1.3.4. SWOT Analysis
- 13.1.4 Vertical Spine LLC
- 13.1.4.1. Company Overview
- 13.1.4.2. Products
- 13.1.4.3. Company Financials
- 13.1.4.4. SWOT Analysis
- 13.1.5 T-Biotechnology
- 13.1.5.1. Company Overview
- 13.1.5.2. Products
- 13.1.5.3. Company Financials
- 13.1.5.4. SWOT Analysis
- 13.1.6 DePuy Synthes
- 13.1.6.1. Company Overview
- 13.1.6.2. Products
- 13.1.6.3. Company Financials
- 13.1.6.4. SWOT Analysis
- 13.1.7 EmCyte Corporation
- 13.1.7.1. Company Overview
- 13.1.7.2. Products
- 13.1.7.3. Company Financials
- 13.1.7.4. SWOT Analysis
- 13.1.8 Isto Biologics
- 13.1.8.1. Company Overview
- 13.1.8.2. Products
- 13.1.8.3. Company Financials
- 13.1.8.4. SWOT Analysis
- 13.1.9 Harvest Technologies Corporation
- 13.1.9.1. Company Overview
- 13.1.9.2. Products
- 13.1.9.3. Company Financials
- 13.1.9.4. SWOT Analysis
- 13.1.10 Glofinn Oy
- 13.1.10.1. Company Overview
- 13.1.10.2. Products
- 13.1.10.3. Company Financials
- 13.1.10.4. SWOT Analysis
- 13.1.11 Zimmer Biomet
- 13.1.11.1. Company Overview
- 13.1.11.2. Products
- 13.1.11.3. Company Financials
- 13.1.11.4. SWOT Analysis
- 13.1.12 Dr PRP USA LLC
- 13.1.12.1. Company Overview
- 13.1.12.2. Products
- 13.1.12.3. Company Financials
- 13.1.12.4. SWOT Analysis
- 13.1.1 Terumo BCT Inc
- 13.2. Market Entropy
- 13.2.1 Company's Key Areas Served
- 13.2.2 Recent Developments
- 13.3. Company Market Share Analysis 2025
- 13.3.1 Top 5 Companies Market Share Analysis
- 13.3.2 Top 3 Companies Market Share Analysis
- 13.4. List of Potential Customers
- 14. Research Methodology
List of Figures
- Figure 1: Global PRP Industry Revenue Breakdown (Million, %) by Region 2025 & 2033
- Figure 2: Global PRP Industry Volume Breakdown (K Unit, %) by Region 2025 & 2033
- Figure 3: North America PRP Industry Revenue (Million), by Type 2025 & 2033
- Figure 4: North America PRP Industry Volume (K Unit), by Type 2025 & 2033
- Figure 5: North America PRP Industry Revenue Share (%), by Type 2025 & 2033
- Figure 6: North America PRP Industry Volume Share (%), by Type 2025 & 2033
- Figure 7: North America PRP Industry Revenue (Million), by Application 2025 & 2033
- Figure 8: North America PRP Industry Volume (K Unit), by Application 2025 & 2033
- Figure 9: North America PRP Industry Revenue Share (%), by Application 2025 & 2033
- Figure 10: North America PRP Industry Volume Share (%), by Application 2025 & 2033
- Figure 11: North America PRP Industry Revenue (Million), by End User 2025 & 2033
- Figure 12: North America PRP Industry Volume (K Unit), by End User 2025 & 2033
- Figure 13: North America PRP Industry Revenue Share (%), by End User 2025 & 2033
- Figure 14: North America PRP Industry Volume Share (%), by End User 2025 & 2033
- Figure 15: North America PRP Industry Revenue (Million), by Country 2025 & 2033
- Figure 16: North America PRP Industry Volume (K Unit), by Country 2025 & 2033
- Figure 17: North America PRP Industry Revenue Share (%), by Country 2025 & 2033
- Figure 18: North America PRP Industry Volume Share (%), by Country 2025 & 2033
- Figure 19: Europe PRP Industry Revenue (Million), by Type 2025 & 2033
- Figure 20: Europe PRP Industry Volume (K Unit), by Type 2025 & 2033
- Figure 21: Europe PRP Industry Revenue Share (%), by Type 2025 & 2033
- Figure 22: Europe PRP Industry Volume Share (%), by Type 2025 & 2033
- Figure 23: Europe PRP Industry Revenue (Million), by Application 2025 & 2033
- Figure 24: Europe PRP Industry Volume (K Unit), by Application 2025 & 2033
- Figure 25: Europe PRP Industry Revenue Share (%), by Application 2025 & 2033
- Figure 26: Europe PRP Industry Volume Share (%), by Application 2025 & 2033
- Figure 27: Europe PRP Industry Revenue (Million), by End User 2025 & 2033
- Figure 28: Europe PRP Industry Volume (K Unit), by End User 2025 & 2033
- Figure 29: Europe PRP Industry Revenue Share (%), by End User 2025 & 2033
- Figure 30: Europe PRP Industry Volume Share (%), by End User 2025 & 2033
- Figure 31: Europe PRP Industry Revenue (Million), by Country 2025 & 2033
- Figure 32: Europe PRP Industry Volume (K Unit), by Country 2025 & 2033
- Figure 33: Europe PRP Industry Revenue Share (%), by Country 2025 & 2033
- Figure 34: Europe PRP Industry Volume Share (%), by Country 2025 & 2033
- Figure 35: Asia Pacific PRP Industry Revenue (Million), by Type 2025 & 2033
- Figure 36: Asia Pacific PRP Industry Volume (K Unit), by Type 2025 & 2033
- Figure 37: Asia Pacific PRP Industry Revenue Share (%), by Type 2025 & 2033
- Figure 38: Asia Pacific PRP Industry Volume Share (%), by Type 2025 & 2033
- Figure 39: Asia Pacific PRP Industry Revenue (Million), by Application 2025 & 2033
- Figure 40: Asia Pacific PRP Industry Volume (K Unit), by Application 2025 & 2033
- Figure 41: Asia Pacific PRP Industry Revenue Share (%), by Application 2025 & 2033
- Figure 42: Asia Pacific PRP Industry Volume Share (%), by Application 2025 & 2033
- Figure 43: Asia Pacific PRP Industry Revenue (Million), by End User 2025 & 2033
- Figure 44: Asia Pacific PRP Industry Volume (K Unit), by End User 2025 & 2033
- Figure 45: Asia Pacific PRP Industry Revenue Share (%), by End User 2025 & 2033
- Figure 46: Asia Pacific PRP Industry Volume Share (%), by End User 2025 & 2033
- Figure 47: Asia Pacific PRP Industry Revenue (Million), by Country 2025 & 2033
- Figure 48: Asia Pacific PRP Industry Volume (K Unit), by Country 2025 & 2033
- Figure 49: Asia Pacific PRP Industry Revenue Share (%), by Country 2025 & 2033
- Figure 50: Asia Pacific PRP Industry Volume Share (%), by Country 2025 & 2033
- Figure 51: Middle East PRP Industry Revenue (Million), by Type 2025 & 2033
- Figure 52: Middle East PRP Industry Volume (K Unit), by Type 2025 & 2033
- Figure 53: Middle East PRP Industry Revenue Share (%), by Type 2025 & 2033
- Figure 54: Middle East PRP Industry Volume Share (%), by Type 2025 & 2033
- Figure 55: Middle East PRP Industry Revenue (Million), by Application 2025 & 2033
- Figure 56: Middle East PRP Industry Volume (K Unit), by Application 2025 & 2033
- Figure 57: Middle East PRP Industry Revenue Share (%), by Application 2025 & 2033
- Figure 58: Middle East PRP Industry Volume Share (%), by Application 2025 & 2033
- Figure 59: Middle East PRP Industry Revenue (Million), by End User 2025 & 2033
- Figure 60: Middle East PRP Industry Volume (K Unit), by End User 2025 & 2033
- Figure 61: Middle East PRP Industry Revenue Share (%), by End User 2025 & 2033
- Figure 62: Middle East PRP Industry Volume Share (%), by End User 2025 & 2033
- Figure 63: Middle East PRP Industry Revenue (Million), by Country 2025 & 2033
- Figure 64: Middle East PRP Industry Volume (K Unit), by Country 2025 & 2033
- Figure 65: Middle East PRP Industry Revenue Share (%), by Country 2025 & 2033
- Figure 66: Middle East PRP Industry Volume Share (%), by Country 2025 & 2033
- Figure 67: GCC PRP Industry Revenue (Million), by Type 2025 & 2033
- Figure 68: GCC PRP Industry Volume (K Unit), by Type 2025 & 2033
- Figure 69: GCC PRP Industry Revenue Share (%), by Type 2025 & 2033
- Figure 70: GCC PRP Industry Volume Share (%), by Type 2025 & 2033
- Figure 71: GCC PRP Industry Revenue (Million), by Application 2025 & 2033
- Figure 72: GCC PRP Industry Volume (K Unit), by Application 2025 & 2033
- Figure 73: GCC PRP Industry Revenue Share (%), by Application 2025 & 2033
- Figure 74: GCC PRP Industry Volume Share (%), by Application 2025 & 2033
- Figure 75: GCC PRP Industry Revenue (Million), by End User 2025 & 2033
- Figure 76: GCC PRP Industry Volume (K Unit), by End User 2025 & 2033
- Figure 77: GCC PRP Industry Revenue Share (%), by End User 2025 & 2033
- Figure 78: GCC PRP Industry Volume Share (%), by End User 2025 & 2033
- Figure 79: GCC PRP Industry Revenue (Million), by Country 2025 & 2033
- Figure 80: GCC PRP Industry Volume (K Unit), by Country 2025 & 2033
- Figure 81: GCC PRP Industry Revenue Share (%), by Country 2025 & 2033
- Figure 82: GCC PRP Industry Volume Share (%), by Country 2025 & 2033
- Figure 83: South America PRP Industry Revenue (Million), by Type 2025 & 2033
- Figure 84: South America PRP Industry Volume (K Unit), by Type 2025 & 2033
- Figure 85: South America PRP Industry Revenue Share (%), by Type 2025 & 2033
- Figure 86: South America PRP Industry Volume Share (%), by Type 2025 & 2033
- Figure 87: South America PRP Industry Revenue (Million), by Application 2025 & 2033
- Figure 88: South America PRP Industry Volume (K Unit), by Application 2025 & 2033
- Figure 89: South America PRP Industry Revenue Share (%), by Application 2025 & 2033
- Figure 90: South America PRP Industry Volume Share (%), by Application 2025 & 2033
- Figure 91: South America PRP Industry Revenue (Million), by End User 2025 & 2033
- Figure 92: South America PRP Industry Volume (K Unit), by End User 2025 & 2033
- Figure 93: South America PRP Industry Revenue Share (%), by End User 2025 & 2033
- Figure 94: South America PRP Industry Volume Share (%), by End User 2025 & 2033
- Figure 95: South America PRP Industry Revenue (Million), by Country 2025 & 2033
- Figure 96: South America PRP Industry Volume (K Unit), by Country 2025 & 2033
- Figure 97: South America PRP Industry Revenue Share (%), by Country 2025 & 2033
- Figure 98: South America PRP Industry Volume Share (%), by Country 2025 & 2033
List of Tables
- Table 1: Global PRP Industry Revenue Million Forecast, by Type 2020 & 2033
- Table 2: Global PRP Industry Volume K Unit Forecast, by Type 2020 & 2033
- Table 3: Global PRP Industry Revenue Million Forecast, by Application 2020 & 2033
- Table 4: Global PRP Industry Volume K Unit Forecast, by Application 2020 & 2033
- Table 5: Global PRP Industry Revenue Million Forecast, by End User 2020 & 2033
- Table 6: Global PRP Industry Volume K Unit Forecast, by End User 2020 & 2033
- Table 7: Global PRP Industry Revenue Million Forecast, by Region 2020 & 2033
- Table 8: Global PRP Industry Volume K Unit Forecast, by Region 2020 & 2033
- Table 9: Global PRP Industry Revenue Million Forecast, by Type 2020 & 2033
- Table 10: Global PRP Industry Volume K Unit Forecast, by Type 2020 & 2033
- Table 11: Global PRP Industry Revenue Million Forecast, by Application 2020 & 2033
- Table 12: Global PRP Industry Volume K Unit Forecast, by Application 2020 & 2033
- Table 13: Global PRP Industry Revenue Million Forecast, by End User 2020 & 2033
- Table 14: Global PRP Industry Volume K Unit Forecast, by End User 2020 & 2033
- Table 15: Global PRP Industry Revenue Million Forecast, by Country 2020 & 2033
- Table 16: Global PRP Industry Volume K Unit Forecast, by Country 2020 & 2033
- Table 17: United States PRP Industry Revenue (Million) Forecast, by Application 2020 & 2033
- Table 18: United States PRP Industry Volume (K Unit) Forecast, by Application 2020 & 2033
- Table 19: Canada PRP Industry Revenue (Million) Forecast, by Application 2020 & 2033
- Table 20: Canada PRP Industry Volume (K Unit) Forecast, by Application 2020 & 2033
- Table 21: Mexico PRP Industry Revenue (Million) Forecast, by Application 2020 & 2033
- Table 22: Mexico PRP Industry Volume (K Unit) Forecast, by Application 2020 & 2033
- Table 23: Global PRP Industry Revenue Million Forecast, by Type 2020 & 2033
- Table 24: Global PRP Industry Volume K Unit Forecast, by Type 2020 & 2033
- Table 25: Global PRP Industry Revenue Million Forecast, by Application 2020 & 2033
- Table 26: Global PRP Industry Volume K Unit Forecast, by Application 2020 & 2033
- Table 27: Global PRP Industry Revenue Million Forecast, by End User 2020 & 2033
- Table 28: Global PRP Industry Volume K Unit Forecast, by End User 2020 & 2033
- Table 29: Global PRP Industry Revenue Million Forecast, by Country 2020 & 2033
- Table 30: Global PRP Industry Volume K Unit Forecast, by Country 2020 & 2033
- Table 31: Germany PRP Industry Revenue (Million) Forecast, by Application 2020 & 2033
- Table 32: Germany PRP Industry Volume (K Unit) Forecast, by Application 2020 & 2033
- Table 33: United Kingdom PRP Industry Revenue (Million) Forecast, by Application 2020 & 2033
- Table 34: United Kingdom PRP Industry Volume (K Unit) Forecast, by Application 2020 & 2033
- Table 35: France PRP Industry Revenue (Million) Forecast, by Application 2020 & 2033
- Table 36: France PRP Industry Volume (K Unit) Forecast, by Application 2020 & 2033
- Table 37: Italy PRP Industry Revenue (Million) Forecast, by Application 2020 & 2033
- Table 38: Italy PRP Industry Volume (K Unit) Forecast, by Application 2020 & 2033
- Table 39: Spain PRP Industry Revenue (Million) Forecast, by Application 2020 & 2033
- Table 40: Spain PRP Industry Volume (K Unit) Forecast, by Application 2020 & 2033
- Table 41: Rest of Europe PRP Industry Revenue (Million) Forecast, by Application 2020 & 2033
- Table 42: Rest of Europe PRP Industry Volume (K Unit) Forecast, by Application 2020 & 2033
- Table 43: Global PRP Industry Revenue Million Forecast, by Type 2020 & 2033
- Table 44: Global PRP Industry Volume K Unit Forecast, by Type 2020 & 2033
- Table 45: Global PRP Industry Revenue Million Forecast, by Application 2020 & 2033
- Table 46: Global PRP Industry Volume K Unit Forecast, by Application 2020 & 2033
- Table 47: Global PRP Industry Revenue Million Forecast, by End User 2020 & 2033
- Table 48: Global PRP Industry Volume K Unit Forecast, by End User 2020 & 2033
- Table 49: Global PRP Industry Revenue Million Forecast, by Country 2020 & 2033
- Table 50: Global PRP Industry Volume K Unit Forecast, by Country 2020 & 2033
- Table 51: China PRP Industry Revenue (Million) Forecast, by Application 2020 & 2033
- Table 52: China PRP Industry Volume (K Unit) Forecast, by Application 2020 & 2033
- Table 53: Japan PRP Industry Revenue (Million) Forecast, by Application 2020 & 2033
- Table 54: Japan PRP Industry Volume (K Unit) Forecast, by Application 2020 & 2033
- Table 55: India PRP Industry Revenue (Million) Forecast, by Application 2020 & 2033
- Table 56: India PRP Industry Volume (K Unit) Forecast, by Application 2020 & 2033
- Table 57: Australia PRP Industry Revenue (Million) Forecast, by Application 2020 & 2033
- Table 58: Australia PRP Industry Volume (K Unit) Forecast, by Application 2020 & 2033
- Table 59: South Korea PRP Industry Revenue (Million) Forecast, by Application 2020 & 2033
- Table 60: South Korea PRP Industry Volume (K Unit) Forecast, by Application 2020 & 2033
- Table 61: Rest of Asia Pacific PRP Industry Revenue (Million) Forecast, by Application 2020 & 2033
- Table 62: Rest of Asia Pacific PRP Industry Volume (K Unit) Forecast, by Application 2020 & 2033
- Table 63: Global PRP Industry Revenue Million Forecast, by Type 2020 & 2033
- Table 64: Global PRP Industry Volume K Unit Forecast, by Type 2020 & 2033
- Table 65: Global PRP Industry Revenue Million Forecast, by Application 2020 & 2033
- Table 66: Global PRP Industry Volume K Unit Forecast, by Application 2020 & 2033
- Table 67: Global PRP Industry Revenue Million Forecast, by End User 2020 & 2033
- Table 68: Global PRP Industry Volume K Unit Forecast, by End User 2020 & 2033
- Table 69: Global PRP Industry Revenue Million Forecast, by Country 2020 & 2033
- Table 70: Global PRP Industry Volume K Unit Forecast, by Country 2020 & 2033
- Table 71: Global PRP Industry Revenue Million Forecast, by Type 2020 & 2033
- Table 72: Global PRP Industry Volume K Unit Forecast, by Type 2020 & 2033
- Table 73: Global PRP Industry Revenue Million Forecast, by Application 2020 & 2033
- Table 74: Global PRP Industry Volume K Unit Forecast, by Application 2020 & 2033
- Table 75: Global PRP Industry Revenue Million Forecast, by End User 2020 & 2033
- Table 76: Global PRP Industry Volume K Unit Forecast, by End User 2020 & 2033
- Table 77: Global PRP Industry Revenue Million Forecast, by Country 2020 & 2033
- Table 78: Global PRP Industry Volume K Unit Forecast, by Country 2020 & 2033
- Table 79: South Africa PRP Industry Revenue (Million) Forecast, by Application 2020 & 2033
- Table 80: South Africa PRP Industry Volume (K Unit) Forecast, by Application 2020 & 2033
- Table 81: Rest of Middle East PRP Industry Revenue (Million) Forecast, by Application 2020 & 2033
- Table 82: Rest of Middle East PRP Industry Volume (K Unit) Forecast, by Application 2020 & 2033
- Table 83: Global PRP Industry Revenue Million Forecast, by Type 2020 & 2033
- Table 84: Global PRP Industry Volume K Unit Forecast, by Type 2020 & 2033
- Table 85: Global PRP Industry Revenue Million Forecast, by Application 2020 & 2033
- Table 86: Global PRP Industry Volume K Unit Forecast, by Application 2020 & 2033
- Table 87: Global PRP Industry Revenue Million Forecast, by End User 2020 & 2033
- Table 88: Global PRP Industry Volume K Unit Forecast, by End User 2020 & 2033
- Table 89: Global PRP Industry Revenue Million Forecast, by Country 2020 & 2033
- Table 90: Global PRP Industry Volume K Unit Forecast, by Country 2020 & 2033
- Table 91: Brazil PRP Industry Revenue (Million) Forecast, by Application 2020 & 2033
- Table 92: Brazil PRP Industry Volume (K Unit) Forecast, by Application 2020 & 2033
- Table 93: Argentina PRP Industry Revenue (Million) Forecast, by Application 2020 & 2033
- Table 94: Argentina PRP Industry Volume (K Unit) Forecast, by Application 2020 & 2033
- Table 95: Rest of South America PRP Industry Revenue (Million) Forecast, by Application 2020 & 2033
- Table 96: Rest of South America PRP Industry Volume (K Unit) Forecast, by Application 2020 & 2033
Frequently Asked Questions
1. What is the projected Compound Annual Growth Rate (CAGR) of the PRP Industry?
The projected CAGR is approximately 9.03%.
2. Which companies are prominent players in the PRP Industry?
Key companies in the market include Terumo BCT Inc, ISTO Biologics, Arthrex Inc, Vertical Spine LLC, T-Biotechnology, DePuy Synthes, EmCyte Corporation, Isto Biologics, Harvest Technologies Corporation, Glofinn Oy, Zimmer Biomet, Dr PRP USA LLC.
3. What are the main segments of the PRP Industry?
The market segments include Type, Application, End User.
4. Can you provide details about the market size?
The market size is estimated to be USD 410.75 Million as of 2022.
5. What are some drivers contributing to market growth?
Rising Incidences of Sports Injuries; Increasing Number of Cosmetic and Surgical Procedures; Growing use of Platelet-rich Plasma in Various Therapeutic Areas.
6. What are the notable trends driving market growth?
The Orthopedics Segment is Expected to Hold the Largest Market Share.
7. Are there any restraints impacting market growth?
Stringent Regulatory Policies; High Prices of Plasma Therapy.
8. Can you provide examples of recent developments in the market?
In February 2021, Atlas Health Medical Group announced PRP (Platelet-rich Plasma) Microneedling Facelifts for patients.
9. What pricing options are available for accessing the report?
Pricing options include single-user, multi-user, and enterprise licenses priced at USD 4750, USD 5250, and USD 8750 respectively.
10. Is the market size provided in terms of value or volume?
The market size is provided in terms of value, measured in Million and volume, measured in K Unit.
11. Are there any specific market keywords associated with the report?
Yes, the market keyword associated with the report is "PRP Industry," which aids in identifying and referencing the specific market segment covered.
12. How do I determine which pricing option suits my needs best?
The pricing options vary based on user requirements and access needs. Individual users may opt for single-user licenses, while businesses requiring broader access may choose multi-user or enterprise licenses for cost-effective access to the report.
13. Are there any additional resources or data provided in the PRP Industry report?
While the report offers comprehensive insights, it's advisable to review the specific contents or supplementary materials provided to ascertain if additional resources or data are available.
14. How can I stay updated on further developments or reports in the PRP Industry?
To stay informed about further developments, trends, and reports in the PRP Industry, consider subscribing to industry newsletters, following relevant companies and organizations, or regularly checking reputable industry news sources and publications.
Methodology
Step 1 - Identification of Relevant Samples Size from Population Database


Step 2 - Approaches for Defining Global Market Size (Value, Volume* & Price*)

Note*: In applicable scenarios
Step 3 - Data Sources
Primary Research
- Web Analytics
- Survey Reports
- Research Institute
- Latest Research Reports
- Opinion Leaders
Secondary Research
- Annual Reports
- White Paper
- Latest Press Release
- Industry Association
- Paid Database
- Investor Presentations

Step 4 - Data Triangulation
Involves using different sources of information in order to increase the validity of a study
These sources are likely to be stakeholders in a program - participants, other researchers, program staff, other community members, and so on.
Then we put all data in single framework & apply various statistical tools to find out the dynamic on the market.
During the analysis stage, feedback from the stakeholder groups would be compared to determine areas of agreement as well as areas of divergence