

Key Insights
The CAR T-cell therapy market is experiencing significant growth, projected to reach $5.9 billion by 2025, with a CAGR of 22.4%. This expansion is driven by advancements in personalized medicine and increasing demand for effective treatments for hematological malignancies and autoimmune disorders. Key growth factors include novel therapy development, expanding indications, and successful clinical trials. The rising incidence of cancers like leukemia and lymphoma, coupled with the need for better treatments in relapsed/refractory patients, further fuels market adoption. Leading companies are investing in R&D, strategic partnerships, and manufacturing to meet this demand.
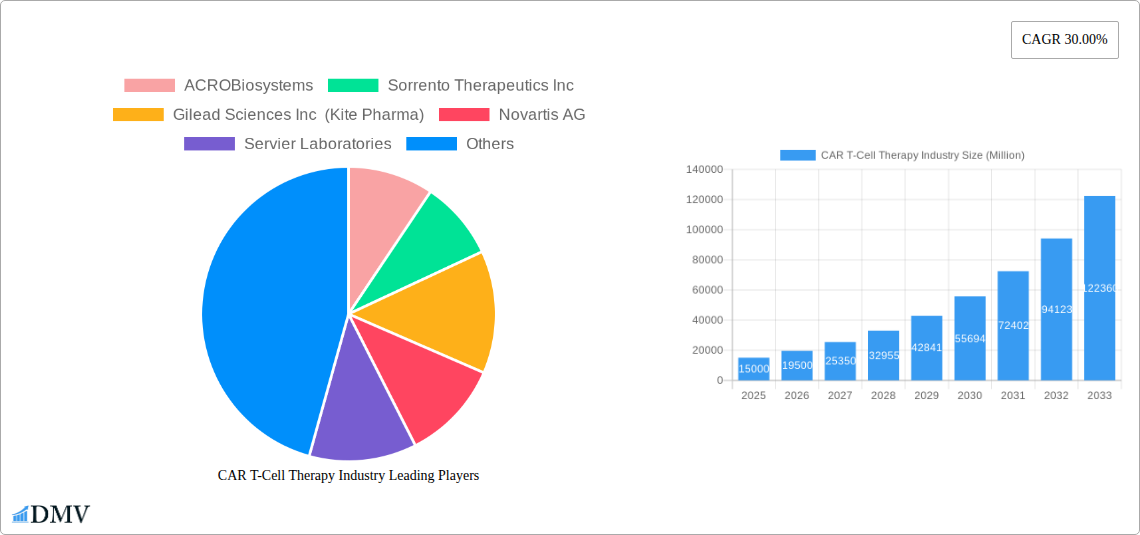
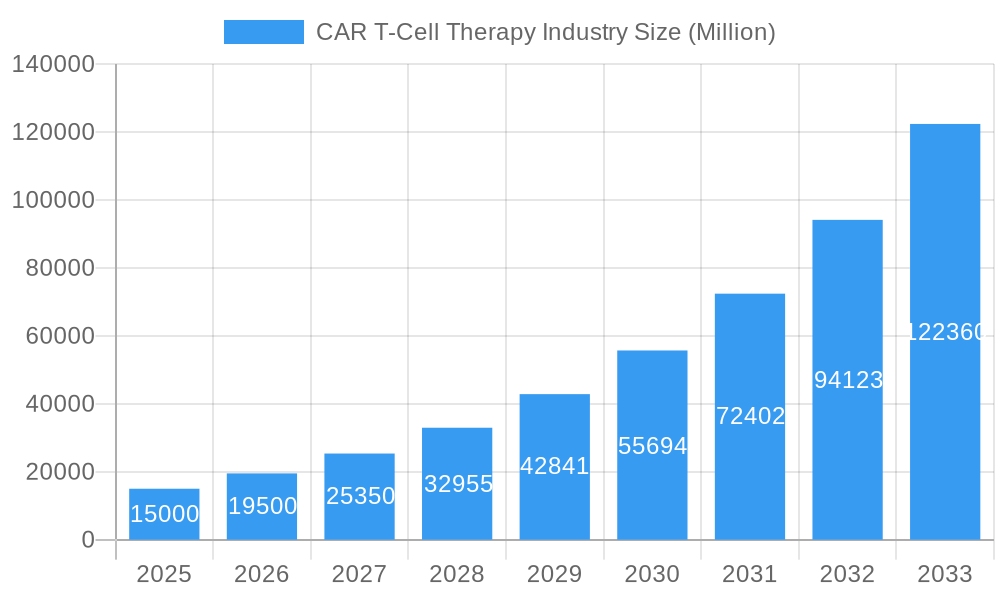
CAR T-Cell Therapy Industry Market Size (In Billion)
The competitive landscape features innovation and collaboration among key players such as Novartis AG, Bristol-Myers Squibb Company, and Gilead Sciences Inc. (Kite Pharma), developers of approved CAR T-cell therapies like Kymriah, Abecma, and Yescarta. The market is segmented by product type (Abecma, Breyanzi, Kymriah, Tecartus, Yescarta) and application, with Leukemia and Lymphoma dominating, and growing interest in Multiple Myeloma and Autoimmune Disorders. Hospitals and specialized cancer care centers are the primary end-users. North America leads the market due to advanced healthcare infrastructure and R&D investment. However, the Asia Pacific region, particularly China and Japan, is expected to witness rapid growth. Restraints like high treatment costs, complex manufacturing, and potential side effects are being addressed through ongoing research and policy initiatives.
CAR T-Cell Therapy Industry Company Market Share
Gain comprehensive insights into the dynamic CAR T-cell therapy market, a revolutionary frontier in oncology and autoimmune disease treatment. This in-depth report, spanning from 2019 to 2033 with a base year of 2025, offers an exhaustive analysis of market composition, evolving trends, and future growth trajectories. Discover critical information on chimeric antigen receptor T-cell therapy, including its pivotal role in treating leukemia, lymphoma, and multiple myeloma. Our analysis delves into the intricate workings of the CAR T-cell therapy industry, providing a detailed roadmap for stakeholders navigating this rapidly expanding sector.
CAR T-Cell Therapy Industry Market Composition & Trends
The CAR T-Cell Therapy industry is characterized by a high degree of innovation, driven by significant investment in biotechnology and pharmaceuticals. Market concentration is notable, with a few key players holding substantial market share, while emerging companies are actively pursuing novel therapeutic targets and manufacturing advancements. Innovation catalysts include breakthroughs in genetic engineering, viral vector development, and personalized medicine approaches. The regulatory landscape, particularly FDA and EMA approvals, significantly influences market entry and product lifecycle. Substitute products, while present in broader hematological oncology, offer limited direct competition to the targeted efficacy of CAR T-cell therapies. End-user profiles reveal a growing reliance on specialized cancer care treatment centers and advanced hospitals for administering these complex treatments. Mergers and acquisitions (M&A) activities are a significant trend, with an estimated M&A deal value of XXX Million in the historical period, indicating strategic consolidation and the pursuit of synergistic capabilities.
CAR T-Cell Therapy Industry Industry Evolution
The CAR T-Cell Therapy industry has witnessed an unprecedented evolution, marked by exponential growth trajectories and transformative technological advancements. From its nascent stages, this cutting-edge field has rapidly progressed from experimental treatments to approved therapies offering life-saving options for patients with previously intractable hematological malignancies. The market growth has been propelled by increasing understanding of the immune system's potential in combating cancer, alongside significant leaps in genetic modification technologies that enable the engineering of T-cells to specifically target and destroy cancer cells. As of the base year 2025, the estimated market size stands at XXX Million, with projections indicating a Compound Annual Growth Rate (CAGR) of XX% throughout the forecast period of 2025–2033. This robust growth is underpinned by continuous improvements in cell manufacturing processes, leading to enhanced efficacy, reduced toxicity, and improved patient outcomes. Shifting consumer demands, driven by patient advocacy groups and a greater awareness of advanced treatment options, are also pushing the industry towards greater accessibility and broader application. The successful development and approval of therapies like Kymriah, Yescarta, and Breyanzi have validated the potential of CAR T-cell therapy, fostering further research and development into new applications, including solid tumors and autoimmune disorders. Adoption metrics show a steady increase in the number of eligible patients receiving CAR T-cell therapy, reflecting its growing acceptance as a standard of care in specific cancer types. The historical period (2019–2024) saw initial market penetration and pivotal clinical trial successes, paving the way for the accelerated growth observed in recent years and anticipated for the future. The industry's evolution is a testament to scientific ingenuity and the relentless pursuit of better cancer treatments.
Leading Regions, Countries, or Segments in CAR T-Cell Therapy Industry
The CAR T-Cell Therapy industry exhibits distinct leadership across various segments, regions, and applications, driven by a confluence of factors including robust healthcare infrastructure, significant R&D investment, and favorable regulatory environments. The Type segment sees Kymriah and Yescarta currently leading the market, with strong adoption rates for Leukemia and Lymphoma applications. However, the burgeoning potential of Multiple Myeloma treatments, exemplified by therapies like Abecma, is rapidly elevating this segment's prominence. Geographically, North America, particularly the United States, stands as the dominant region, accounting for over XX% of the global CAR T-cell therapy market share. This dominance is fueled by substantial government funding for biomedical research, a high prevalence of target diseases, and the presence of leading pharmaceutical and biotechnology companies.
Key drivers contributing to this leadership include:
- Investment Trends: Significant venture capital and private equity funding directed towards CAR T-cell therapy research and development, estimated at XXX Million in the historical period.
- Regulatory Support: Streamlined approval pathways and expedited review processes from regulatory bodies like the FDA, facilitating faster market entry for innovative therapies.
- Advanced Healthcare Infrastructure: A high concentration of specialized cancer treatment centers and hospitals equipped with the necessary infrastructure and expertise to administer these complex cellular therapies.
- Prevalence of Target Cancers: A high incidence rate of leukemia, lymphoma, and multiple myeloma in the population drives demand for effective treatment options.
The Application segment is currently dominated by Lymphoma and Leukemia, which represent over XX% of the total patient population treated with CAR T-cell therapy. However, the market for Multiple Myeloma is experiencing rapid growth, with innovative therapies showing promising results and expanding patient eligibility. The End User segment is primarily comprised of Hospitals, which administer the majority of CAR T-cell therapies, followed by specialized Cancer Care Treatment Centers. Emerging trends indicate a growing role for academic medical centers in CAR T-cell therapy research and clinical trials. The market is projected to reach XXX Million by 2033, reflecting sustained innovation and increasing adoption across a broader spectrum of hematological malignancies and potentially autoimmune disorders.
CAR T-Cell Therapy Industry Product Innovations
Product innovations in the CAR T-Cell Therapy industry are fundamentally reshaping cancer treatment. Advancements focus on enhancing CAR construct design, improving T-cell persistence, and reducing on-target, off-tumor toxicities. Key innovations include the development of next-generation CARs with armored features and suicide switches, and multiplexed targeting strategies to overcome antigen escape mechanisms. Performance metrics such as sustained remission rates, improved safety profiles, and broader applicability across different cancer types are key differentiators. For instance, novel approaches are being explored to treat solid tumors, a significant unmet need, by overcoming the immunosuppressive tumor microenvironment. The unique selling proposition of these therapies lies in their ability to elicit potent and durable anti-tumor responses, offering a personalized and potentially curative option for patients with refractory diseases.
Propelling Factors for CAR T-Cell Therapy Industry Growth
The CAR T-Cell Therapy industry is propelled by a confluence of powerful factors. Technologically, advancements in gene editing, viral vector technology, and immunotherapy research are continuously expanding the potential of CAR T-cells. Economically, significant R&D investments from pharmaceutical giants and venture capital firms, estimated at XXX Million annually, are fueling innovation and pipeline development. Regulatory bodies, by providing expedited pathways for novel treatments, are also acting as key enablers. The increasing prevalence of target diseases like leukemia, lymphoma, and multiple myeloma, coupled with an aging global population, creates a growing patient pool. Furthermore, the demonstrated clinical efficacy of approved CAR T-cell therapies, leading to high remission rates and potential cures, is boosting physician and patient confidence, driving adoption. The shift towards personalized medicine also strongly favors CAR T-cell therapy's tailored approach.
Obstacles in the CAR T-Cell Therapy Industry Market
Despite its immense promise, the CAR T-Cell Therapy industry faces significant obstacles. Regulatory hurdles, while improving, can still be complex and time-consuming for new indications and manufacturing processes. The high cost of development and manufacturing, leading to treatment prices in the range of XXX Million per patient, poses a substantial challenge for healthcare systems and patient access. Supply chain disruptions and manufacturing complexities, including the need for specialized facilities and skilled personnel, can impact production capacity and lead times. Furthermore, toxicities such as cytokine release syndrome (CRS) and neurotoxicity, although manageable, remain a concern, necessitating intensive patient monitoring. Competitive pressures from other advanced therapies and the ongoing challenge of overcoming antigen escape mechanisms in relapsed/refractory patients also present barriers.
Future Opportunities in CAR T-Cell Therapy Industry
The future of the CAR T-Cell Therapy industry is brimming with opportunities. Expansion into new markets, including treating solid tumors, is a significant frontier, requiring innovative strategies to penetrate the tumor microenvironment. Further development of allogeneic ("off-the-shelf") CAR T-cell therapies promises to address manufacturing bottlenecks and reduce patient wait times. The application of CAR T-cell technology to autoimmune diseases, where T-cells can be engineered to suppress aberrant immune responses, presents a vast untapped market. Advancements in personalized manufacturing, such as point-of-care CAR T-cell production, could dramatically improve accessibility and reduce costs. The integration of artificial intelligence and machine learning in identifying optimal targets and predicting patient responses will further refine treatment strategies.
Major Players in the CAR T-Cell Therapy Industry Ecosystem
- ACROBiosystems
- Sorrento Therapeutics Inc
- Gilead Sciences Inc (Kite Pharma)
- Novartis AG
- Servier Laboratories
- Eli Lilly and Company
- Noile-Immune Biotech Inc
- Celyad Oncology
- Johnson & Johnson
- Sangamo Therapeutics Inc
- Miltenyi Biotec
- Bristol-Myers Squibb Company
Key Developments in CAR T-Cell Therapy Industry Industry
- June 2022: Bristol Myers Squibb received FDA approval for Breyanzi (lisocabtagene maraleucel), a CD19-directed chimeric antigen receptor (CAR) T-cell therapy, for the treatment of adult patients with large B-cell lymphoma (LBCL). This approval expanded treatment options for a critical patient population.
- April 2022: Kite, a Gilead Company, received FDA approval for Yescarta (axicabtagene ciloleucel) CAR T-cell therapy for adult patients with large B-cell lymphoma that is refractory to first-line chemoimmunotherapy or that relapses within 12 months of first-line chemoimmunotherapy. This marked a significant step in offering earlier treatment interventions.
Strategic CAR T-Cell Therapy Industry Market Forecast
The strategic forecast for the CAR T-Cell Therapy industry is exceptionally positive, driven by sustained innovation and expanding therapeutic applications. Growth catalysts include ongoing clinical trials exploring CAR T-cells for a wider array of hematological malignancies and the promising advancements in solid tumor research, which represents a vast unmet medical need with a market potential estimated at XXX Million. The anticipated launch of next-generation CAR T-cell products with improved safety profiles and efficacy will further bolster market expansion. Furthermore, the development of allogeneic CAR T-cell therapies and advancements in manufacturing technologies are poised to enhance accessibility and reduce treatment costs, driving increased patient adoption globally. The market is projected to reach XXX Million by 2033, indicating a robust trajectory fueled by scientific breakthroughs and increasing demand for highly effective cancer therapies.
CAR T-Cell Therapy Industry Segmentation
-
1. Type
- 1.1. Abecma
- 1.2. Breyanzi
- 1.3. Kymriah
- 1.4. Tecartus
- 1.5. Yescarta
- 1.6. Others
-
2. Application
- 2.1. Leukemia
- 2.2. Lymphoma
- 2.3. Multiple Myeloma
- 2.4. Autoimmune Disorders
- 2.5. Other Application
-
3. End User
- 3.1. Hospitals
- 3.2. Cancer Care Treatment Centers
- 3.3. Other End Users
CAR T-Cell Therapy Industry Segmentation By Geography
-
1. North America
- 1.1. United States
- 1.2. Canada
- 1.3. Mexico
-
2. Europe
- 2.1. Germany
- 2.2. United Kingdom
- 2.3. France
- 2.4. Italy
- 2.5. Spain
- 2.6. Rest of Europe
-
3. Asia Pacific
- 3.1. China
- 3.2. Japan
- 3.3. India
- 3.4. Australia
- 3.5. South Korea
- 3.6. Rest of Asia Pacific
-
4. Middle East and Africa
- 4.1. GCC
- 4.2. South Africa
- 4.3. Rest of Middle East and Africa
-
5. South America
- 5.1. Brazil
- 5.2. Argentina
- 5.3. Rest of South America
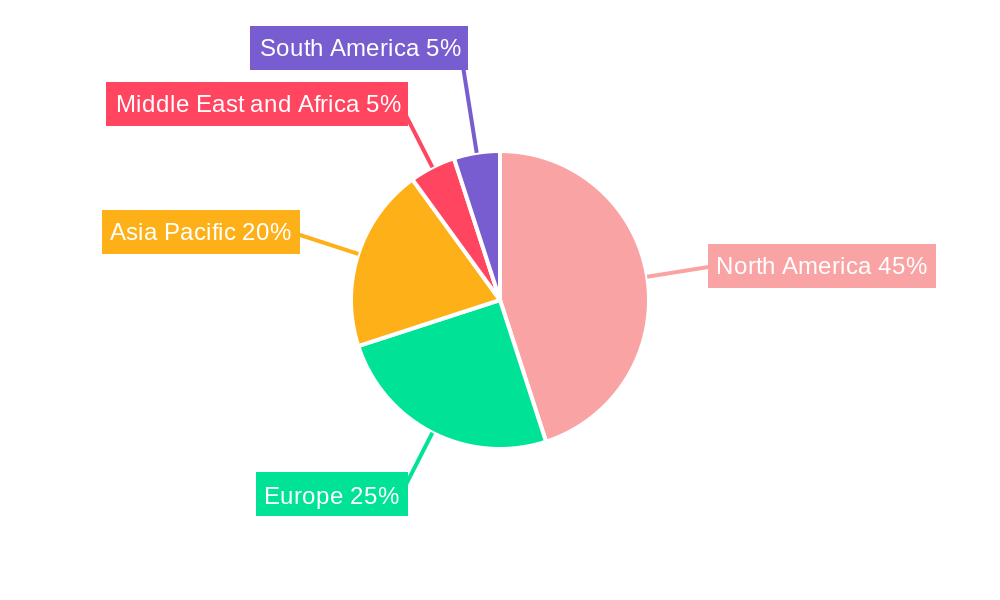
CAR T-Cell Therapy Industry Regional Market Share
Geographic Coverage of CAR T-Cell Therapy Industry
CAR T-Cell Therapy Industry REPORT HIGHLIGHTS
| Aspects | Details |
|---|---|
| Study Period | 2020-2034 |
| Base Year | 2025 |
| Estimated Year | 2026 |
| Forecast Period | 2026-2034 |
| Historical Period | 2020-2025 |
| Growth Rate | CAGR of 22.4% from 2020-2034 |
| Segmentation |
|
Table of Contents
- 1. Introduction
- 1.1. Research Scope
- 1.2. Market Segmentation
- 1.3. Research Objective
- 1.4. Definitions and Assumptions
- 2. Executive Summary
- 2.1. Market Snapshot
- 3. Market Dynamics
- 3.1. Market Drivers
- 3.2. Market Restrains
- 3.3. Market Trends
- 3.4. Market Opportunities
- 4. Market Factor Analysis
- 4.1. Porters Five Forces
- 4.1.1. Bargaining Power of Suppliers
- 4.1.2. Bargaining Power of Buyers
- 4.1.3. Threat of New Entrants
- 4.1.4. Threat of Substitutes
- 4.1.5. Competitive Rivalry
- 4.2. PESTEL analysis
- 4.3. BCG Analysis
- 4.3.1. Stars (High Growth, High Market Share)
- 4.3.2. Cash Cows (Low Growth, High Market Share)
- 4.3.3. Question Mark (High Growth, Low Market Share)
- 4.3.4. Dogs (Low Growth, Low Market Share)
- 4.4. Ansoff Matrix Analysis
- 4.5. Supply Chain Analysis
- 4.6. Regulatory Landscape
- 4.7. Current Market Potential and Opportunity Assessment (TAM–SAM–SOM Framework)
- 4.8. DMV Analyst Note
- 4.1. Porters Five Forces
- 5. Market Analysis, Insights and Forecast 2021-2033
- 5.1. Market Analysis, Insights and Forecast - by Type
- 5.1.1. Abecma
- 5.1.2. Breyanzi
- 5.1.3. Kymriah
- 5.1.4. Tecartus
- 5.1.5. Yescarta
- 5.1.6. Others
- 5.2. Market Analysis, Insights and Forecast - by Application
- 5.2.1. Leukemia
- 5.2.2. Lymphoma
- 5.2.3. Multiple Myeloma
- 5.2.4. Autoimmune Disorders
- 5.2.5. Other Application
- 5.3. Market Analysis, Insights and Forecast - by End User
- 5.3.1. Hospitals
- 5.3.2. Cancer Care Treatment Centers
- 5.3.3. Other End Users
- 5.4. Market Analysis, Insights and Forecast - by Region
- 5.4.1. North America
- 5.4.2. Europe
- 5.4.3. Asia Pacific
- 5.4.4. Middle East and Africa
- 5.4.5. South America
- 5.1. Market Analysis, Insights and Forecast - by Type
- 6. Global CAR T-Cell Therapy Industry Analysis, Insights and Forecast, 2021-2033
- 6.1. Market Analysis, Insights and Forecast - by Type
- 6.1.1. Abecma
- 6.1.2. Breyanzi
- 6.1.3. Kymriah
- 6.1.4. Tecartus
- 6.1.5. Yescarta
- 6.1.6. Others
- 6.2. Market Analysis, Insights and Forecast - by Application
- 6.2.1. Leukemia
- 6.2.2. Lymphoma
- 6.2.3. Multiple Myeloma
- 6.2.4. Autoimmune Disorders
- 6.2.5. Other Application
- 6.3. Market Analysis, Insights and Forecast - by End User
- 6.3.1. Hospitals
- 6.3.2. Cancer Care Treatment Centers
- 6.3.3. Other End Users
- 6.1. Market Analysis, Insights and Forecast - by Type
- 7. North America CAR T-Cell Therapy Industry Analysis, Insights and Forecast, 2020-2032
- 7.1. Market Analysis, Insights and Forecast - by Type
- 7.1.1. Abecma
- 7.1.2. Breyanzi
- 7.1.3. Kymriah
- 7.1.4. Tecartus
- 7.1.5. Yescarta
- 7.1.6. Others
- 7.2. Market Analysis, Insights and Forecast - by Application
- 7.2.1. Leukemia
- 7.2.2. Lymphoma
- 7.2.3. Multiple Myeloma
- 7.2.4. Autoimmune Disorders
- 7.2.5. Other Application
- 7.3. Market Analysis, Insights and Forecast - by End User
- 7.3.1. Hospitals
- 7.3.2. Cancer Care Treatment Centers
- 7.3.3. Other End Users
- 7.1. Market Analysis, Insights and Forecast - by Type
- 8. Europe CAR T-Cell Therapy Industry Analysis, Insights and Forecast, 2020-2032
- 8.1. Market Analysis, Insights and Forecast - by Type
- 8.1.1. Abecma
- 8.1.2. Breyanzi
- 8.1.3. Kymriah
- 8.1.4. Tecartus
- 8.1.5. Yescarta
- 8.1.6. Others
- 8.2. Market Analysis, Insights and Forecast - by Application
- 8.2.1. Leukemia
- 8.2.2. Lymphoma
- 8.2.3. Multiple Myeloma
- 8.2.4. Autoimmune Disorders
- 8.2.5. Other Application
- 8.3. Market Analysis, Insights and Forecast - by End User
- 8.3.1. Hospitals
- 8.3.2. Cancer Care Treatment Centers
- 8.3.3. Other End Users
- 8.1. Market Analysis, Insights and Forecast - by Type
- 9. Asia Pacific CAR T-Cell Therapy Industry Analysis, Insights and Forecast, 2020-2032
- 9.1. Market Analysis, Insights and Forecast - by Type
- 9.1.1. Abecma
- 9.1.2. Breyanzi
- 9.1.3. Kymriah
- 9.1.4. Tecartus
- 9.1.5. Yescarta
- 9.1.6. Others
- 9.2. Market Analysis, Insights and Forecast - by Application
- 9.2.1. Leukemia
- 9.2.2. Lymphoma
- 9.2.3. Multiple Myeloma
- 9.2.4. Autoimmune Disorders
- 9.2.5. Other Application
- 9.3. Market Analysis, Insights and Forecast - by End User
- 9.3.1. Hospitals
- 9.3.2. Cancer Care Treatment Centers
- 9.3.3. Other End Users
- 9.1. Market Analysis, Insights and Forecast - by Type
- 10. Middle East and Africa CAR T-Cell Therapy Industry Analysis, Insights and Forecast, 2020-2032
- 10.1. Market Analysis, Insights and Forecast - by Type
- 10.1.1. Abecma
- 10.1.2. Breyanzi
- 10.1.3. Kymriah
- 10.1.4. Tecartus
- 10.1.5. Yescarta
- 10.1.6. Others
- 10.2. Market Analysis, Insights and Forecast - by Application
- 10.2.1. Leukemia
- 10.2.2. Lymphoma
- 10.2.3. Multiple Myeloma
- 10.2.4. Autoimmune Disorders
- 10.2.5. Other Application
- 10.3. Market Analysis, Insights and Forecast - by End User
- 10.3.1. Hospitals
- 10.3.2. Cancer Care Treatment Centers
- 10.3.3. Other End Users
- 10.1. Market Analysis, Insights and Forecast - by Type
- 11. South America CAR T-Cell Therapy Industry Analysis, Insights and Forecast, 2020-2032
- 11.1. Market Analysis, Insights and Forecast - by Type
- 11.1.1. Abecma
- 11.1.2. Breyanzi
- 11.1.3. Kymriah
- 11.1.4. Tecartus
- 11.1.5. Yescarta
- 11.1.6. Others
- 11.2. Market Analysis, Insights and Forecast - by Application
- 11.2.1. Leukemia
- 11.2.2. Lymphoma
- 11.2.3. Multiple Myeloma
- 11.2.4. Autoimmune Disorders
- 11.2.5. Other Application
- 11.3. Market Analysis, Insights and Forecast - by End User
- 11.3.1. Hospitals
- 11.3.2. Cancer Care Treatment Centers
- 11.3.3. Other End Users
- 11.1. Market Analysis, Insights and Forecast - by Type
- 12. Competitive Analysis
- 12.1. Company Profiles
- 12.1.1 ACROBiosystems
- 12.1.1.1. Company Overview
- 12.1.1.2. Products
- 12.1.1.3. Company Financials
- 12.1.1.4. SWOT Analysis
- 12.1.2 Sorrento Therapeutics Inc
- 12.1.2.1. Company Overview
- 12.1.2.2. Products
- 12.1.2.3. Company Financials
- 12.1.2.4. SWOT Analysis
- 12.1.3 Gilead Sciences Inc (Kite Pharma)
- 12.1.3.1. Company Overview
- 12.1.3.2. Products
- 12.1.3.3. Company Financials
- 12.1.3.4. SWOT Analysis
- 12.1.4 Novartis AG
- 12.1.4.1. Company Overview
- 12.1.4.2. Products
- 12.1.4.3. Company Financials
- 12.1.4.4. SWOT Analysis
- 12.1.5 Servier Laboratories
- 12.1.5.1. Company Overview
- 12.1.5.2. Products
- 12.1.5.3. Company Financials
- 12.1.5.4. SWOT Analysis
- 12.1.6 Eli Lilly and Company
- 12.1.6.1. Company Overview
- 12.1.6.2. Products
- 12.1.6.3. Company Financials
- 12.1.6.4. SWOT Analysis
- 12.1.7 Noile-Immune Biotech Inc
- 12.1.7.1. Company Overview
- 12.1.7.2. Products
- 12.1.7.3. Company Financials
- 12.1.7.4. SWOT Analysis
- 12.1.8 Celyad Oncology
- 12.1.8.1. Company Overview
- 12.1.8.2. Products
- 12.1.8.3. Company Financials
- 12.1.8.4. SWOT Analysis
- 12.1.9 Johnson & Johnson
- 12.1.9.1. Company Overview
- 12.1.9.2. Products
- 12.1.9.3. Company Financials
- 12.1.9.4. SWOT Analysis
- 12.1.10 Sangamo Therapeutics Inc
- 12.1.10.1. Company Overview
- 12.1.10.2. Products
- 12.1.10.3. Company Financials
- 12.1.10.4. SWOT Analysis
- 12.1.11 Miltenyi Biotec
- 12.1.11.1. Company Overview
- 12.1.11.2. Products
- 12.1.11.3. Company Financials
- 12.1.11.4. SWOT Analysis
- 12.1.12 Bristol-Myers Squibb Company
- 12.1.12.1. Company Overview
- 12.1.12.2. Products
- 12.1.12.3. Company Financials
- 12.1.12.4. SWOT Analysis
- 12.1.1 ACROBiosystems
- 12.2. Market Entropy
- 12.2.1 Company's Key Areas Served
- 12.2.2 Recent Developments
- 12.3. Company Market Share Analysis 2025
- 12.3.1 Top 5 Companies Market Share Analysis
- 12.3.2 Top 3 Companies Market Share Analysis
- 12.4. List of Potential Customers
- 13. Research Methodology
List of Figures
- Figure 1: Global CAR T-Cell Therapy Industry Revenue Breakdown (billion, %) by Region 2025 & 2033
- Figure 2: Global CAR T-Cell Therapy Industry Volume Breakdown (K Unit, %) by Region 2025 & 2033
- Figure 3: North America CAR T-Cell Therapy Industry Revenue (billion), by Type 2025 & 2033
- Figure 4: North America CAR T-Cell Therapy Industry Volume (K Unit), by Type 2025 & 2033
- Figure 5: North America CAR T-Cell Therapy Industry Revenue Share (%), by Type 2025 & 2033
- Figure 6: North America CAR T-Cell Therapy Industry Volume Share (%), by Type 2025 & 2033
- Figure 7: North America CAR T-Cell Therapy Industry Revenue (billion), by Application 2025 & 2033
- Figure 8: North America CAR T-Cell Therapy Industry Volume (K Unit), by Application 2025 & 2033
- Figure 9: North America CAR T-Cell Therapy Industry Revenue Share (%), by Application 2025 & 2033
- Figure 10: North America CAR T-Cell Therapy Industry Volume Share (%), by Application 2025 & 2033
- Figure 11: North America CAR T-Cell Therapy Industry Revenue (billion), by End User 2025 & 2033
- Figure 12: North America CAR T-Cell Therapy Industry Volume (K Unit), by End User 2025 & 2033
- Figure 13: North America CAR T-Cell Therapy Industry Revenue Share (%), by End User 2025 & 2033
- Figure 14: North America CAR T-Cell Therapy Industry Volume Share (%), by End User 2025 & 2033
- Figure 15: North America CAR T-Cell Therapy Industry Revenue (billion), by Country 2025 & 2033
- Figure 16: North America CAR T-Cell Therapy Industry Volume (K Unit), by Country 2025 & 2033
- Figure 17: North America CAR T-Cell Therapy Industry Revenue Share (%), by Country 2025 & 2033
- Figure 18: North America CAR T-Cell Therapy Industry Volume Share (%), by Country 2025 & 2033
- Figure 19: Europe CAR T-Cell Therapy Industry Revenue (billion), by Type 2025 & 2033
- Figure 20: Europe CAR T-Cell Therapy Industry Volume (K Unit), by Type 2025 & 2033
- Figure 21: Europe CAR T-Cell Therapy Industry Revenue Share (%), by Type 2025 & 2033
- Figure 22: Europe CAR T-Cell Therapy Industry Volume Share (%), by Type 2025 & 2033
- Figure 23: Europe CAR T-Cell Therapy Industry Revenue (billion), by Application 2025 & 2033
- Figure 24: Europe CAR T-Cell Therapy Industry Volume (K Unit), by Application 2025 & 2033
- Figure 25: Europe CAR T-Cell Therapy Industry Revenue Share (%), by Application 2025 & 2033
- Figure 26: Europe CAR T-Cell Therapy Industry Volume Share (%), by Application 2025 & 2033
- Figure 27: Europe CAR T-Cell Therapy Industry Revenue (billion), by End User 2025 & 2033
- Figure 28: Europe CAR T-Cell Therapy Industry Volume (K Unit), by End User 2025 & 2033
- Figure 29: Europe CAR T-Cell Therapy Industry Revenue Share (%), by End User 2025 & 2033
- Figure 30: Europe CAR T-Cell Therapy Industry Volume Share (%), by End User 2025 & 2033
- Figure 31: Europe CAR T-Cell Therapy Industry Revenue (billion), by Country 2025 & 2033
- Figure 32: Europe CAR T-Cell Therapy Industry Volume (K Unit), by Country 2025 & 2033
- Figure 33: Europe CAR T-Cell Therapy Industry Revenue Share (%), by Country 2025 & 2033
- Figure 34: Europe CAR T-Cell Therapy Industry Volume Share (%), by Country 2025 & 2033
- Figure 35: Asia Pacific CAR T-Cell Therapy Industry Revenue (billion), by Type 2025 & 2033
- Figure 36: Asia Pacific CAR T-Cell Therapy Industry Volume (K Unit), by Type 2025 & 2033
- Figure 37: Asia Pacific CAR T-Cell Therapy Industry Revenue Share (%), by Type 2025 & 2033
- Figure 38: Asia Pacific CAR T-Cell Therapy Industry Volume Share (%), by Type 2025 & 2033
- Figure 39: Asia Pacific CAR T-Cell Therapy Industry Revenue (billion), by Application 2025 & 2033
- Figure 40: Asia Pacific CAR T-Cell Therapy Industry Volume (K Unit), by Application 2025 & 2033
- Figure 41: Asia Pacific CAR T-Cell Therapy Industry Revenue Share (%), by Application 2025 & 2033
- Figure 42: Asia Pacific CAR T-Cell Therapy Industry Volume Share (%), by Application 2025 & 2033
- Figure 43: Asia Pacific CAR T-Cell Therapy Industry Revenue (billion), by End User 2025 & 2033
- Figure 44: Asia Pacific CAR T-Cell Therapy Industry Volume (K Unit), by End User 2025 & 2033
- Figure 45: Asia Pacific CAR T-Cell Therapy Industry Revenue Share (%), by End User 2025 & 2033
- Figure 46: Asia Pacific CAR T-Cell Therapy Industry Volume Share (%), by End User 2025 & 2033
- Figure 47: Asia Pacific CAR T-Cell Therapy Industry Revenue (billion), by Country 2025 & 2033
- Figure 48: Asia Pacific CAR T-Cell Therapy Industry Volume (K Unit), by Country 2025 & 2033
- Figure 49: Asia Pacific CAR T-Cell Therapy Industry Revenue Share (%), by Country 2025 & 2033
- Figure 50: Asia Pacific CAR T-Cell Therapy Industry Volume Share (%), by Country 2025 & 2033
- Figure 51: Middle East and Africa CAR T-Cell Therapy Industry Revenue (billion), by Type 2025 & 2033
- Figure 52: Middle East and Africa CAR T-Cell Therapy Industry Volume (K Unit), by Type 2025 & 2033
- Figure 53: Middle East and Africa CAR T-Cell Therapy Industry Revenue Share (%), by Type 2025 & 2033
- Figure 54: Middle East and Africa CAR T-Cell Therapy Industry Volume Share (%), by Type 2025 & 2033
- Figure 55: Middle East and Africa CAR T-Cell Therapy Industry Revenue (billion), by Application 2025 & 2033
- Figure 56: Middle East and Africa CAR T-Cell Therapy Industry Volume (K Unit), by Application 2025 & 2033
- Figure 57: Middle East and Africa CAR T-Cell Therapy Industry Revenue Share (%), by Application 2025 & 2033
- Figure 58: Middle East and Africa CAR T-Cell Therapy Industry Volume Share (%), by Application 2025 & 2033
- Figure 59: Middle East and Africa CAR T-Cell Therapy Industry Revenue (billion), by End User 2025 & 2033
- Figure 60: Middle East and Africa CAR T-Cell Therapy Industry Volume (K Unit), by End User 2025 & 2033
- Figure 61: Middle East and Africa CAR T-Cell Therapy Industry Revenue Share (%), by End User 2025 & 2033
- Figure 62: Middle East and Africa CAR T-Cell Therapy Industry Volume Share (%), by End User 2025 & 2033
- Figure 63: Middle East and Africa CAR T-Cell Therapy Industry Revenue (billion), by Country 2025 & 2033
- Figure 64: Middle East and Africa CAR T-Cell Therapy Industry Volume (K Unit), by Country 2025 & 2033
- Figure 65: Middle East and Africa CAR T-Cell Therapy Industry Revenue Share (%), by Country 2025 & 2033
- Figure 66: Middle East and Africa CAR T-Cell Therapy Industry Volume Share (%), by Country 2025 & 2033
- Figure 67: South America CAR T-Cell Therapy Industry Revenue (billion), by Type 2025 & 2033
- Figure 68: South America CAR T-Cell Therapy Industry Volume (K Unit), by Type 2025 & 2033
- Figure 69: South America CAR T-Cell Therapy Industry Revenue Share (%), by Type 2025 & 2033
- Figure 70: South America CAR T-Cell Therapy Industry Volume Share (%), by Type 2025 & 2033
- Figure 71: South America CAR T-Cell Therapy Industry Revenue (billion), by Application 2025 & 2033
- Figure 72: South America CAR T-Cell Therapy Industry Volume (K Unit), by Application 2025 & 2033
- Figure 73: South America CAR T-Cell Therapy Industry Revenue Share (%), by Application 2025 & 2033
- Figure 74: South America CAR T-Cell Therapy Industry Volume Share (%), by Application 2025 & 2033
- Figure 75: South America CAR T-Cell Therapy Industry Revenue (billion), by End User 2025 & 2033
- Figure 76: South America CAR T-Cell Therapy Industry Volume (K Unit), by End User 2025 & 2033
- Figure 77: South America CAR T-Cell Therapy Industry Revenue Share (%), by End User 2025 & 2033
- Figure 78: South America CAR T-Cell Therapy Industry Volume Share (%), by End User 2025 & 2033
- Figure 79: South America CAR T-Cell Therapy Industry Revenue (billion), by Country 2025 & 2033
- Figure 80: South America CAR T-Cell Therapy Industry Volume (K Unit), by Country 2025 & 2033
- Figure 81: South America CAR T-Cell Therapy Industry Revenue Share (%), by Country 2025 & 2033
- Figure 82: South America CAR T-Cell Therapy Industry Volume Share (%), by Country 2025 & 2033
List of Tables
- Table 1: Global CAR T-Cell Therapy Industry Revenue billion Forecast, by Type 2020 & 2033
- Table 2: Global CAR T-Cell Therapy Industry Volume K Unit Forecast, by Type 2020 & 2033
- Table 3: Global CAR T-Cell Therapy Industry Revenue billion Forecast, by Application 2020 & 2033
- Table 4: Global CAR T-Cell Therapy Industry Volume K Unit Forecast, by Application 2020 & 2033
- Table 5: Global CAR T-Cell Therapy Industry Revenue billion Forecast, by End User 2020 & 2033
- Table 6: Global CAR T-Cell Therapy Industry Volume K Unit Forecast, by End User 2020 & 2033
- Table 7: Global CAR T-Cell Therapy Industry Revenue billion Forecast, by Region 2020 & 2033
- Table 8: Global CAR T-Cell Therapy Industry Volume K Unit Forecast, by Region 2020 & 2033
- Table 9: Global CAR T-Cell Therapy Industry Revenue billion Forecast, by Type 2020 & 2033
- Table 10: Global CAR T-Cell Therapy Industry Volume K Unit Forecast, by Type 2020 & 2033
- Table 11: Global CAR T-Cell Therapy Industry Revenue billion Forecast, by Application 2020 & 2033
- Table 12: Global CAR T-Cell Therapy Industry Volume K Unit Forecast, by Application 2020 & 2033
- Table 13: Global CAR T-Cell Therapy Industry Revenue billion Forecast, by End User 2020 & 2033
- Table 14: Global CAR T-Cell Therapy Industry Volume K Unit Forecast, by End User 2020 & 2033
- Table 15: Global CAR T-Cell Therapy Industry Revenue billion Forecast, by Country 2020 & 2033
- Table 16: Global CAR T-Cell Therapy Industry Volume K Unit Forecast, by Country 2020 & 2033
- Table 17: United States CAR T-Cell Therapy Industry Revenue (billion) Forecast, by Application 2020 & 2033
- Table 18: United States CAR T-Cell Therapy Industry Volume (K Unit) Forecast, by Application 2020 & 2033
- Table 19: Canada CAR T-Cell Therapy Industry Revenue (billion) Forecast, by Application 2020 & 2033
- Table 20: Canada CAR T-Cell Therapy Industry Volume (K Unit) Forecast, by Application 2020 & 2033
- Table 21: Mexico CAR T-Cell Therapy Industry Revenue (billion) Forecast, by Application 2020 & 2033
- Table 22: Mexico CAR T-Cell Therapy Industry Volume (K Unit) Forecast, by Application 2020 & 2033
- Table 23: Global CAR T-Cell Therapy Industry Revenue billion Forecast, by Type 2020 & 2033
- Table 24: Global CAR T-Cell Therapy Industry Volume K Unit Forecast, by Type 2020 & 2033
- Table 25: Global CAR T-Cell Therapy Industry Revenue billion Forecast, by Application 2020 & 2033
- Table 26: Global CAR T-Cell Therapy Industry Volume K Unit Forecast, by Application 2020 & 2033
- Table 27: Global CAR T-Cell Therapy Industry Revenue billion Forecast, by End User 2020 & 2033
- Table 28: Global CAR T-Cell Therapy Industry Volume K Unit Forecast, by End User 2020 & 2033
- Table 29: Global CAR T-Cell Therapy Industry Revenue billion Forecast, by Country 2020 & 2033
- Table 30: Global CAR T-Cell Therapy Industry Volume K Unit Forecast, by Country 2020 & 2033
- Table 31: Germany CAR T-Cell Therapy Industry Revenue (billion) Forecast, by Application 2020 & 2033
- Table 32: Germany CAR T-Cell Therapy Industry Volume (K Unit) Forecast, by Application 2020 & 2033
- Table 33: United Kingdom CAR T-Cell Therapy Industry Revenue (billion) Forecast, by Application 2020 & 2033
- Table 34: United Kingdom CAR T-Cell Therapy Industry Volume (K Unit) Forecast, by Application 2020 & 2033
- Table 35: France CAR T-Cell Therapy Industry Revenue (billion) Forecast, by Application 2020 & 2033
- Table 36: France CAR T-Cell Therapy Industry Volume (K Unit) Forecast, by Application 2020 & 2033
- Table 37: Italy CAR T-Cell Therapy Industry Revenue (billion) Forecast, by Application 2020 & 2033
- Table 38: Italy CAR T-Cell Therapy Industry Volume (K Unit) Forecast, by Application 2020 & 2033
- Table 39: Spain CAR T-Cell Therapy Industry Revenue (billion) Forecast, by Application 2020 & 2033
- Table 40: Spain CAR T-Cell Therapy Industry Volume (K Unit) Forecast, by Application 2020 & 2033
- Table 41: Rest of Europe CAR T-Cell Therapy Industry Revenue (billion) Forecast, by Application 2020 & 2033
- Table 42: Rest of Europe CAR T-Cell Therapy Industry Volume (K Unit) Forecast, by Application 2020 & 2033
- Table 43: Global CAR T-Cell Therapy Industry Revenue billion Forecast, by Type 2020 & 2033
- Table 44: Global CAR T-Cell Therapy Industry Volume K Unit Forecast, by Type 2020 & 2033
- Table 45: Global CAR T-Cell Therapy Industry Revenue billion Forecast, by Application 2020 & 2033
- Table 46: Global CAR T-Cell Therapy Industry Volume K Unit Forecast, by Application 2020 & 2033
- Table 47: Global CAR T-Cell Therapy Industry Revenue billion Forecast, by End User 2020 & 2033
- Table 48: Global CAR T-Cell Therapy Industry Volume K Unit Forecast, by End User 2020 & 2033
- Table 49: Global CAR T-Cell Therapy Industry Revenue billion Forecast, by Country 2020 & 2033
- Table 50: Global CAR T-Cell Therapy Industry Volume K Unit Forecast, by Country 2020 & 2033
- Table 51: China CAR T-Cell Therapy Industry Revenue (billion) Forecast, by Application 2020 & 2033
- Table 52: China CAR T-Cell Therapy Industry Volume (K Unit) Forecast, by Application 2020 & 2033
- Table 53: Japan CAR T-Cell Therapy Industry Revenue (billion) Forecast, by Application 2020 & 2033
- Table 54: Japan CAR T-Cell Therapy Industry Volume (K Unit) Forecast, by Application 2020 & 2033
- Table 55: India CAR T-Cell Therapy Industry Revenue (billion) Forecast, by Application 2020 & 2033
- Table 56: India CAR T-Cell Therapy Industry Volume (K Unit) Forecast, by Application 2020 & 2033
- Table 57: Australia CAR T-Cell Therapy Industry Revenue (billion) Forecast, by Application 2020 & 2033
- Table 58: Australia CAR T-Cell Therapy Industry Volume (K Unit) Forecast, by Application 2020 & 2033
- Table 59: South Korea CAR T-Cell Therapy Industry Revenue (billion) Forecast, by Application 2020 & 2033
- Table 60: South Korea CAR T-Cell Therapy Industry Volume (K Unit) Forecast, by Application 2020 & 2033
- Table 61: Rest of Asia Pacific CAR T-Cell Therapy Industry Revenue (billion) Forecast, by Application 2020 & 2033
- Table 62: Rest of Asia Pacific CAR T-Cell Therapy Industry Volume (K Unit) Forecast, by Application 2020 & 2033
- Table 63: Global CAR T-Cell Therapy Industry Revenue billion Forecast, by Type 2020 & 2033
- Table 64: Global CAR T-Cell Therapy Industry Volume K Unit Forecast, by Type 2020 & 2033
- Table 65: Global CAR T-Cell Therapy Industry Revenue billion Forecast, by Application 2020 & 2033
- Table 66: Global CAR T-Cell Therapy Industry Volume K Unit Forecast, by Application 2020 & 2033
- Table 67: Global CAR T-Cell Therapy Industry Revenue billion Forecast, by End User 2020 & 2033
- Table 68: Global CAR T-Cell Therapy Industry Volume K Unit Forecast, by End User 2020 & 2033
- Table 69: Global CAR T-Cell Therapy Industry Revenue billion Forecast, by Country 2020 & 2033
- Table 70: Global CAR T-Cell Therapy Industry Volume K Unit Forecast, by Country 2020 & 2033
- Table 71: GCC CAR T-Cell Therapy Industry Revenue (billion) Forecast, by Application 2020 & 2033
- Table 72: GCC CAR T-Cell Therapy Industry Volume (K Unit) Forecast, by Application 2020 & 2033
- Table 73: South Africa CAR T-Cell Therapy Industry Revenue (billion) Forecast, by Application 2020 & 2033
- Table 74: South Africa CAR T-Cell Therapy Industry Volume (K Unit) Forecast, by Application 2020 & 2033
- Table 75: Rest of Middle East and Africa CAR T-Cell Therapy Industry Revenue (billion) Forecast, by Application 2020 & 2033
- Table 76: Rest of Middle East and Africa CAR T-Cell Therapy Industry Volume (K Unit) Forecast, by Application 2020 & 2033
- Table 77: Global CAR T-Cell Therapy Industry Revenue billion Forecast, by Type 2020 & 2033
- Table 78: Global CAR T-Cell Therapy Industry Volume K Unit Forecast, by Type 2020 & 2033
- Table 79: Global CAR T-Cell Therapy Industry Revenue billion Forecast, by Application 2020 & 2033
- Table 80: Global CAR T-Cell Therapy Industry Volume K Unit Forecast, by Application 2020 & 2033
- Table 81: Global CAR T-Cell Therapy Industry Revenue billion Forecast, by End User 2020 & 2033
- Table 82: Global CAR T-Cell Therapy Industry Volume K Unit Forecast, by End User 2020 & 2033
- Table 83: Global CAR T-Cell Therapy Industry Revenue billion Forecast, by Country 2020 & 2033
- Table 84: Global CAR T-Cell Therapy Industry Volume K Unit Forecast, by Country 2020 & 2033
- Table 85: Brazil CAR T-Cell Therapy Industry Revenue (billion) Forecast, by Application 2020 & 2033
- Table 86: Brazil CAR T-Cell Therapy Industry Volume (K Unit) Forecast, by Application 2020 & 2033
- Table 87: Argentina CAR T-Cell Therapy Industry Revenue (billion) Forecast, by Application 2020 & 2033
- Table 88: Argentina CAR T-Cell Therapy Industry Volume (K Unit) Forecast, by Application 2020 & 2033
- Table 89: Rest of South America CAR T-Cell Therapy Industry Revenue (billion) Forecast, by Application 2020 & 2033
- Table 90: Rest of South America CAR T-Cell Therapy Industry Volume (K Unit) Forecast, by Application 2020 & 2033
Frequently Asked Questions
1. What is the projected Compound Annual Growth Rate (CAGR) of the CAR T-Cell Therapy Industry?
The projected CAGR is approximately 22.4%.
2. Which companies are prominent players in the CAR T-Cell Therapy Industry?
Key companies in the market include ACROBiosystems, Sorrento Therapeutics Inc, Gilead Sciences Inc (Kite Pharma), Novartis AG, Servier Laboratories, Eli Lilly and Company, Noile-Immune Biotech Inc, Celyad Oncology, Johnson & Johnson, Sangamo Therapeutics Inc, Miltenyi Biotec, Bristol-Myers Squibb Company.
3. What are the main segments of the CAR T-Cell Therapy Industry?
The market segments include Type, Application, End User.
4. Can you provide details about the market size?
The market size is estimated to be USD 5.9 billion as of 2022.
5. What are some drivers contributing to market growth?
Growing Burden of Cancer Worldwide; Increasing Invesment and Research and Development to Develop CAR T-Cell Therapy.
6. What are the notable trends driving market growth?
Multiple Myeloma is Expected to Observe a Significant Growth Over the Forecast Period.
7. Are there any restraints impacting market growth?
High Cost of Developing CAR T-Cell Therapy.
8. Can you provide examples of recent developments in the market?
June 2022: Bristol Myers Squibb received FDA approval for Breyanzi (lisocabtagene maraleucel), a CD19-directed chimeric antigen receptor (CAR) T-cell therapy, for the treatment of adult patients with large B-cell lymphoma (LBCL).
9. What pricing options are available for accessing the report?
Pricing options include single-user, multi-user, and enterprise licenses priced at USD 4750, USD 5250, and USD 8750 respectively.
10. Is the market size provided in terms of value or volume?
The market size is provided in terms of value, measured in billion and volume, measured in K Unit.
11. Are there any specific market keywords associated with the report?
Yes, the market keyword associated with the report is "CAR T-Cell Therapy Industry," which aids in identifying and referencing the specific market segment covered.
12. How do I determine which pricing option suits my needs best?
The pricing options vary based on user requirements and access needs. Individual users may opt for single-user licenses, while businesses requiring broader access may choose multi-user or enterprise licenses for cost-effective access to the report.
13. Are there any additional resources or data provided in the CAR T-Cell Therapy Industry report?
While the report offers comprehensive insights, it's advisable to review the specific contents or supplementary materials provided to ascertain if additional resources or data are available.
14. How can I stay updated on further developments or reports in the CAR T-Cell Therapy Industry?
To stay informed about further developments, trends, and reports in the CAR T-Cell Therapy Industry, consider subscribing to industry newsletters, following relevant companies and organizations, or regularly checking reputable industry news sources and publications.
Methodology
Step 1 - Identification of Relevant Samples Size from Population Database


Step 2 - Approaches for Defining Global Market Size (Value, Volume* & Price*)

Note*: In applicable scenarios
Step 3 - Data Sources
Primary Research
- Web Analytics
- Survey Reports
- Research Institute
- Latest Research Reports
- Opinion Leaders
Secondary Research
- Annual Reports
- White Paper
- Latest Press Release
- Industry Association
- Paid Database
- Investor Presentations

Step 4 - Data Triangulation
Involves using different sources of information in order to increase the validity of a study
These sources are likely to be stakeholders in a program - participants, other researchers, program staff, other community members, and so on.
Then we put all data in single framework & apply various statistical tools to find out the dynamic on the market.
During the analysis stage, feedback from the stakeholder groups would be compared to determine areas of agreement as well as areas of divergence