

Key Insights
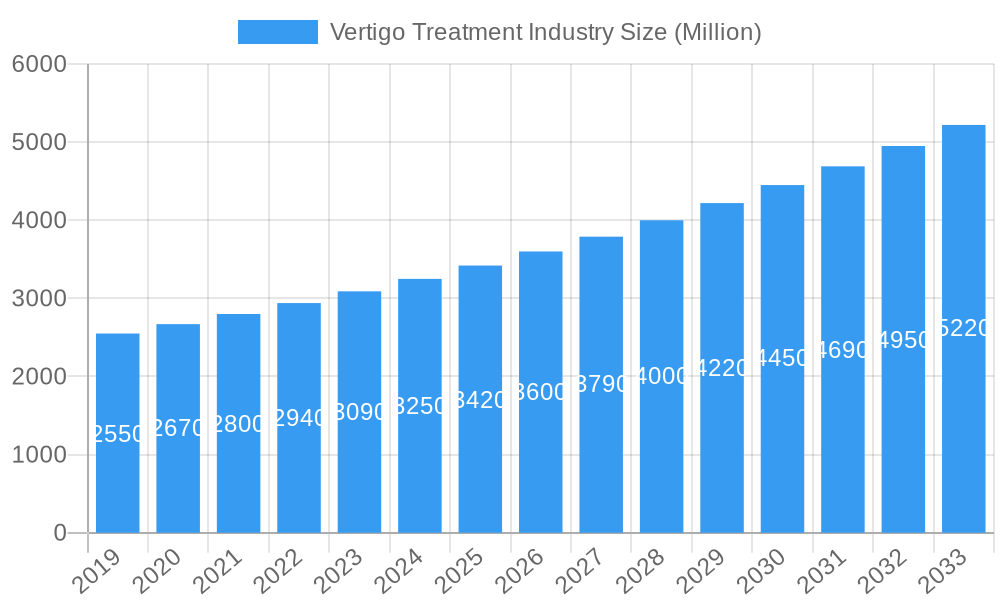
The global Vertigo Treatment market is poised for significant expansion, projected to reach an estimated market size of USD 3,500 million by 2025 and subsequently grow at a Compound Annual Growth Rate (CAGR) of 5.50% through 2033. This robust growth is primarily propelled by an increasing prevalence of vertigo-inducing conditions, including vestibular disorders and age-related neurological issues. The expanding elderly population globally, a demographic more susceptible to these conditions, acts as a substantial driver for market demand. Furthermore, advancements in diagnostic tools for accurately identifying the root cause of vertigo, coupled with the development of more effective and targeted therapeutic interventions, are significantly contributing to market penetration. The rising awareness among both patients and healthcare professionals regarding the impact of vertigo on quality of life and the availability of effective treatments is also fueling market expansion.
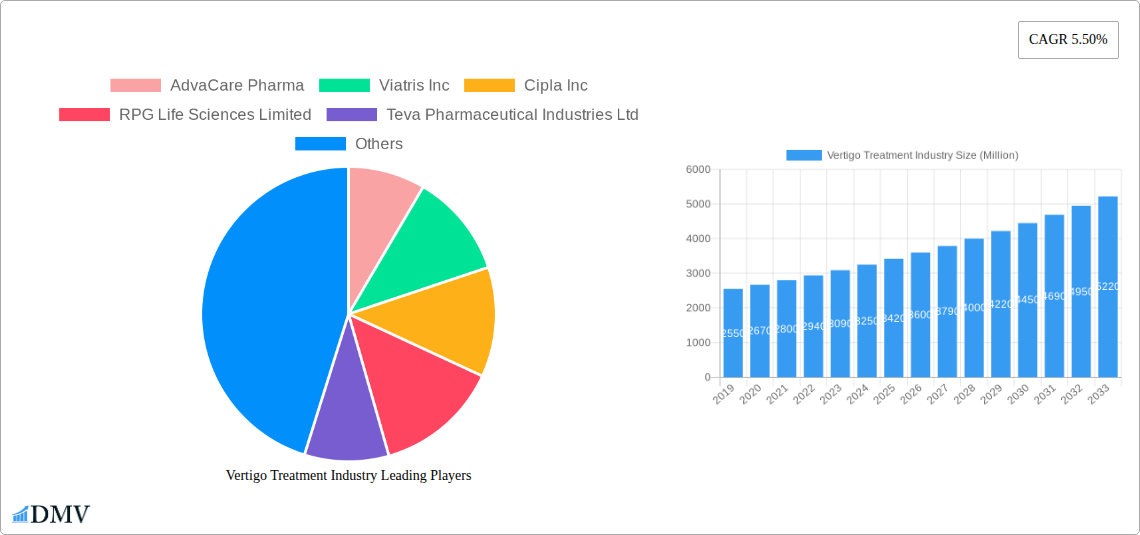
Vertigo Treatment Industry Market Size (In Billion)
The market is segmented into various treatment types, with medication, encompassing both over-the-counter and prescription drugs, currently dominating the landscape due to accessibility and ease of use. However, surgical interventions are expected to witness a steady rise as advanced techniques become more refined for specific and severe cases of vertigo. In terms of end-users, hospitals and clinics represent the largest share, reflecting the need for specialized medical care. Geographically, North America and Europe are leading markets, driven by high healthcare expenditure and sophisticated healthcare infrastructure. The Asia Pacific region, however, presents the most promising growth trajectory, fueled by a burgeoning patient pool, improving healthcare access, and increasing investment in medical research and development for neurological disorders. Emerging economies within this region are expected to be key contributors to future market growth.
Vertigo Treatment Industry Company Market Share
Vertigo Treatment Industry Market Composition & Trends
The global Vertigo Treatment Industry is characterized by a dynamic market composition and evolving trends, driven by an increasing prevalence of vestibular disorders and advancements in diagnostic and therapeutic solutions. Market concentration varies, with established pharmaceutical giants and emerging specialty clinics vying for market share. Innovation catalysts include the development of novel drug formulations, sophisticated diagnostic equipment, and minimally invasive surgical techniques. The regulatory landscape, while stringent, fosters patient safety and product efficacy. Substitute products, primarily home remedies and alternative therapies, pose a minor challenge but are overshadowed by evidence-based medical interventions. End-user profiles range from individual patients seeking relief to healthcare institutions demanding cost-effective and advanced treatment options. Mergers & Acquisitions (M&A) activities are anticipated to reshape the market, with potential deal values reaching into the hundreds of Million. Key M&A strategies focus on consolidating market presence, acquiring innovative technologies, and expanding geographical reach. The market share distribution is expected to see shifts as new entrants and established players strategically invest in research and development and market penetration.
- Market Share Distribution: Fragmented with a trend towards consolidation.
- M&A Deal Values: Anticipated to reach over 500 Million in strategic acquisitions.
- Innovation Catalysts: Novel drug development, advanced diagnostics, and telemedicine.
- Regulatory Landscape: Strict FDA and EMA approvals; focus on patient safety and efficacy.
- Substitute Products: Limited impact due to the specialized nature of vertigo treatment.
Vertigo Treatment Industry Industry Evolution
The Vertigo Treatment Industry has undergone a significant evolution over the Historical Period (2019–2024), marked by consistent market growth trajectories fueled by rising awareness, an aging global population susceptible to vestibular issues, and an increasing incidence of neurological conditions that manifest as vertigo. Technological advancements have been pivotal in this evolution, transforming diagnostic capabilities from basic clinical assessments to sophisticated imaging techniques and specialized vestibular function tests. This enhanced diagnostic accuracy has, in turn, led to more targeted and effective treatment approaches. Consumer demand has also shifted, with patients becoming more informed and actively seeking specialized care for dizziness and balance disorders. The Base Year (2025) serves as a crucial benchmark, from which further growth is projected. The market has witnessed a steady adoption of new medications, including improved over-the-counter (OTC) and prescription drugs that offer better symptom management with fewer side effects. Furthermore, advancements in surgical procedures, such as minimally invasive techniques for conditions like benign paroxysmal positional vertigo (BPPV), have reduced recovery times and improved patient outcomes, contributing to market expansion. The integration of telehealth and digital health solutions has also played a significant role, expanding access to diagnosis and treatment, especially in remote areas. The Study Period (2019–2033) encapsulates this transformative journey, highlighting a projected Compound Annual Growth Rate (CAGR) of approximately 6.5% through 2033. This growth is underpinned by continuous investment in research and development, leading to more refined therapeutic interventions and a deeper understanding of the underlying causes of various vertigo types. The increasing focus on patient-centric care and personalized treatment plans further drives the market's evolution, ensuring that solutions are tailored to individual needs and conditions, thereby fostering sustained growth and market expansion across the globe. The Estimated Year (2025) anticipates a robust market value of over 800 Million, reflecting the sustained demand and innovation within the sector.
Leading Regions, Countries, or Segments in Vertigo Treatment Industry
North America currently stands as the dominant region in the Vertigo Treatment Industry, driven by robust healthcare infrastructure, high disposable incomes, and a significant prevalence of age-related vestibular disorders. The United States, in particular, leads due to substantial investments in research and development, early adoption of advanced medical technologies, and a well-established network of specialized clinics and hospitals. The Peripheral Vertigo segment is expected to exhibit the highest growth within the Type category, owing to the widespread occurrence of conditions like BPPV and Meniere's disease, which are often age-related and highly responsive to available treatments. In terms of Treatment Type, Medication remains the cornerstone, with Prescription Drugs holding a larger market share due to the efficacy and targeted nature of treatments for specific underlying causes. However, the Over-the-Counter (OTC) segment is steadily gaining traction for mild symptom management. Hospitals and Clinics, as key End Users, are instrumental in driving market demand due to their direct patient engagement and access to diagnostic and treatment facilities.
Dominant Region: North America, specifically the United States.
- Key Drivers: High healthcare expenditure, advanced R&D infrastructure, increasing prevalence of age-related vestibular disorders.
- Investment Trends: Significant private and public funding for neurological research and treatment development.
- Regulatory Support: Favorable regulatory environment for drug approvals and medical device innovation.
Leading Segment (Type): Peripheral Vertigo.
- Drivers: High incidence rates of BPPV and Meniere's disease, effective and accessible treatment options.
- Market Share: Expected to account for over 60% of the total vertigo type market.
Leading Segment (Treatment Type): Medication (Prescription Drugs).
- Drivers: Efficacy in treating underlying causes, wider range of therapeutic options, physician preference.
- Market Share: Estimated to hold around 70% of the treatment type market by 2033.
Leading Segment (End User): Hospitals and Clinics.
- Drivers: Primary point of diagnosis and treatment, integration of specialized vertigo centers, demand for advanced equipment.
- Market Penetration: These sectors are projected to contribute more than 75% to the overall end-user market revenue.
The increasing focus on developing specialized vertigo and balance disorder centers, as seen in recent developments in India, indicates a global trend towards addressing this niche yet significant healthcare need. This strategic expansion of services by major healthcare providers directly fuels market growth and accessibility.
Vertigo Treatment Industry Product Innovations
Product innovations in the Vertigo Treatment Industry are rapidly advancing, focusing on enhanced efficacy and patient comfort. Novel drug formulations aim to provide faster symptom relief and address the root causes of vertigo, including targeted therapies for vestibular migraines and neurological causes. Advanced diagnostic tools, such as high-resolution vestibular testing equipment and AI-powered interpretation software, are improving diagnostic accuracy and speed, allowing for quicker intervention. Furthermore, the development of wearable devices for continuous monitoring and personalized vestibular rehabilitation exercises is transforming patient self-management and remote care. These innovations are driven by a deeper understanding of the complex neurophysiological mechanisms underlying vertigo and a commitment to improving the quality of life for millions affected by this debilitating condition. The unique selling propositions of these new products lie in their precision, reduced side effects, and greater accessibility through telemedicine integration, ensuring a significant impact on patient outcomes and market dynamics. The total value of innovative product launches is expected to reach over 100 Million annually by 2033.
Propelling Factors for Vertigo Treatment Industry Growth
The Vertigo Treatment Industry is propelled by a confluence of factors that are creating a fertile ground for sustained growth. An increasing global aging population directly contributes to a higher incidence of vestibular disorders, a primary driver for demand. Furthermore, a growing awareness among the general public and healthcare professionals about the impact of vertigo and the availability of effective treatments is facilitating earlier diagnosis and intervention. Technological advancements in diagnostic tools and therapeutic interventions are also significant, enabling more precise identification of vertigo causes and the development of targeted treatments. The rising prevalence of neurological disorders and inner ear conditions, which often manifest as vertigo, further fuels market expansion. Economic factors, including increased healthcare spending and insurance coverage for vertigo treatments, are also playing a crucial role.
- Aging Global Population: Increased susceptibility to vestibular disorders.
- Growing Awareness & Diagnosis: Enhanced public and professional understanding.
- Technological Advancements: Sophisticated diagnostics and targeted therapies.
- Rising Prevalence of Neurological/Inner Ear Conditions: Direct correlation with vertigo incidence.
- Increased Healthcare Spending & Insurance Coverage: Improved affordability and access.
Obstacles in the Vertigo Treatment Industry Market
Despite its promising growth, the Vertigo Treatment Industry faces several obstacles that could temper its expansion. Regulatory hurdles for new drug approvals and medical devices, while crucial for safety, can lead to prolonged development timelines and significant costs. The diagnostic complexity of vertigo, with its myriad causes, can lead to misdiagnosis and delayed treatment, impacting patient outcomes and market efficiency. Supply chain disruptions for specialized medications and equipment, especially in the wake of global events, can affect availability and pricing. Competitive pressures among established pharmaceutical companies and a growing number of smaller biotech firms can lead to pricing challenges and market saturation in certain segments. Furthermore, a lack of standardized treatment protocols across different healthcare systems and regions can create inconsistencies in care delivery. The estimated impact of these obstacles could result in a reduction of market growth by up to 10% in certain periods.
- Regulatory Hurdles: Extended approval processes for new treatments.
- Diagnostic Complexity: Potential for misdiagnosis and delayed interventions.
- Supply Chain Disruptions: Availability and pricing volatility of essential components.
- Intense Competition: Pricing pressures and market saturation.
- Lack of Standardized Protocols: Inconsistent treatment approaches.
Future Opportunities in Vertigo Treatment Industry
The future of the Vertigo Treatment Industry is brimming with opportunities, driven by unmet needs and emerging trends. The expansion into emerging economies, where awareness and access to specialized care are growing, presents a significant untapped market. Advancements in personalized medicine, leveraging genetic profiling and advanced diagnostics to tailor treatments to individual patient profiles, offer immense potential. The integration of digital health solutions, including AI-powered diagnostic platforms and remote patient monitoring, can enhance accessibility and efficiency. Furthermore, research into novel therapeutic targets, such as regenerative medicine for inner ear damage, could unlock entirely new treatment paradigms. The development of integrated care models that combine pharmacological, physical therapy, and psychological interventions is also a promising avenue for comprehensive patient management. The projected market value from these opportunities could reach an additional 400 Million by 2033.
- Emerging Markets: Significant growth potential in Asia-Pacific and Latin America.
- Personalized Medicine: Tailored treatments based on individual patient genetics and diagnostics.
- Digital Health Integration: AI-driven diagnostics and remote patient monitoring.
- Novel Therapeutic Targets: Research into regenerative medicine and advanced drug delivery.
- Integrated Care Models: Holistic approach combining various therapeutic modalities.
Major Players in the Vertigo Treatment Industry Ecosystem
- AdvaCare Pharma
- Viatris Inc
- Cipla Inc
- RPG Life Sciences Limited
- Teva Pharmaceutical Industries Ltd
- Epic Pharma LLC
- Amneal Pharmaceuticals LLC
- Sun Pharmaceutical Industries Limited
- Zydus Cadila
- Lupin
- Prestige Consumer Healthcare Inc
- Pfizer Inc
Key Developments in Vertigo Treatment Industry Industry
- November 2022: Apollo launched a vertigo and balance disorder clinic in its hospital in Hyderabad, India. This is expected to grow the vertigo treatment in India, increasing regional market penetration.
- March 2022: In collaboration with NeuroEquilibrium, Sri Ramakrishna Hospital launched a super-specialty dizziness and vertigo diagnosis and treatment center in Coimbatore, India. This development highlights the increasing specialization of healthcare services and the growing demand for advanced vertigo care in key Indian markets.
Strategic Vertigo Treatment Industry Market Forecast
The strategic Vertigo Treatment Industry forecast indicates a robust and sustained growth trajectory driven by a combination of rising disease prevalence, technological innovation, and expanding healthcare access. The increasing incidence of peripheral and central vertigo, coupled with an aging global population, will continue to fuel demand for effective treatment solutions. Pharmaceutical companies are investing heavily in research and development to launch novel medications and improve existing ones, while advancements in diagnostic equipment and surgical techniques are enhancing treatment precision and patient outcomes. The integration of digital health technologies and the establishment of specialized vertigo clinics, as evidenced by recent developments in India, are further expanding market reach and accessibility. These growth catalysts, alongside a generally positive economic outlook for healthcare spending and improved insurance coverage, point towards a dynamic and expanding market poised to reach a valuation of over 1 Billion by the end of the Forecast Period (2025–2033).
Vertigo Treatment Industry Segmentation
-
1. Type
- 1.1. Peripheral Vertigo
- 1.2. Central Vertigo
-
2. Treatment Type
-
2.1. Medication
- 2.1.1. Over-the-counter Drugs
- 2.1.2. Prescription Drugs
- 2.2. Surgery
-
2.1. Medication
-
3. End User
- 3.1. Hospitals
- 3.2. Clinics
- 3.3. Other End Users
Vertigo Treatment Industry Segmentation By Geography
-
1. North America
- 1.1. United States
- 1.2. Canada
- 1.3. Mexico
-
2. Europe
- 2.1. Germany
- 2.2. United Kingdom
- 2.3. France
- 2.4. Italy
- 2.5. Spain
- 2.6. Rest of Europe
-
3. Asia Pacific
- 3.1. China
- 3.2. Japan
- 3.3. India
- 3.4. Australia
- 3.5. South Korea
- 3.6. Rest of Asia Pacific
-
4. Middle East and Africa
- 4.1. GCC
- 4.2. South Africa
- 4.3. Rest of Middle East and Africa
-
5. South America
- 5.1. Brazil
- 5.2. Argentina
- 5.3. Rest of South America
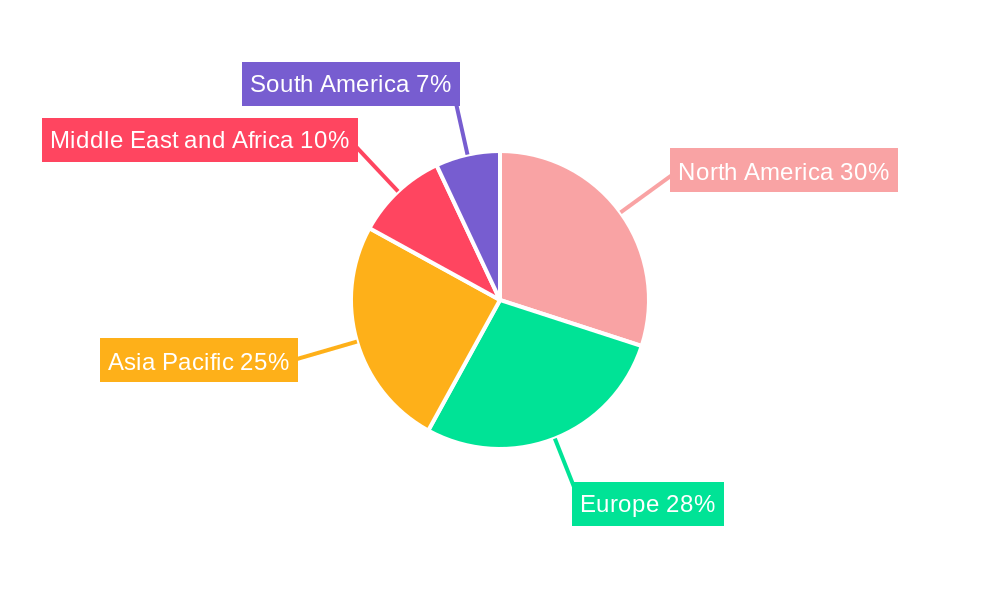
Vertigo Treatment Industry Regional Market Share
Geographic Coverage of Vertigo Treatment Industry
Vertigo Treatment Industry REPORT HIGHLIGHTS
| Aspects | Details |
|---|---|
| Study Period | 2020-2034 |
| Base Year | 2025 |
| Estimated Year | 2026 |
| Forecast Period | 2026-2034 |
| Historical Period | 2020-2025 |
| Growth Rate | CAGR of 4.89% from 2020-2034 |
| Segmentation |
|
Table of Contents
- 1. Introduction
- 1.1. Research Scope
- 1.2. Market Segmentation
- 1.3. Research Objective
- 1.4. Definitions and Assumptions
- 2. Executive Summary
- 2.1. Market Snapshot
- 3. Market Dynamics
- 3.1. Market Drivers
- 3.2. Market Restrains
- 3.3. Market Trends
- 3.4. Market Opportunities
- 4. Market Factor Analysis
- 4.1. Porters Five Forces
- 4.1.1. Bargaining Power of Suppliers
- 4.1.2. Bargaining Power of Buyers
- 4.1.3. Threat of New Entrants
- 4.1.4. Threat of Substitutes
- 4.1.5. Competitive Rivalry
- 4.2. PESTEL analysis
- 4.3. BCG Analysis
- 4.3.1. Stars (High Growth, High Market Share)
- 4.3.2. Cash Cows (Low Growth, High Market Share)
- 4.3.3. Question Mark (High Growth, Low Market Share)
- 4.3.4. Dogs (Low Growth, Low Market Share)
- 4.4. Ansoff Matrix Analysis
- 4.5. Supply Chain Analysis
- 4.6. Regulatory Landscape
- 4.7. Current Market Potential and Opportunity Assessment (TAM–SAM–SOM Framework)
- 4.8. DMV Analyst Note
- 4.1. Porters Five Forces
- 5. Market Analysis, Insights and Forecast 2021-2033
- 5.1. Market Analysis, Insights and Forecast - by Type
- 5.1.1. Peripheral Vertigo
- 5.1.2. Central Vertigo
- 5.2. Market Analysis, Insights and Forecast - by Treatment Type
- 5.2.1. Medication
- 5.2.1.1. Over-the-counter Drugs
- 5.2.1.2. Prescription Drugs
- 5.2.2. Surgery
- 5.2.1. Medication
- 5.3. Market Analysis, Insights and Forecast - by End User
- 5.3.1. Hospitals
- 5.3.2. Clinics
- 5.3.3. Other End Users
- 5.4. Market Analysis, Insights and Forecast - by Region
- 5.4.1. North America
- 5.4.2. Europe
- 5.4.3. Asia Pacific
- 5.4.4. Middle East and Africa
- 5.4.5. South America
- 5.1. Market Analysis, Insights and Forecast - by Type
- 6. Global Vertigo Treatment Industry Analysis, Insights and Forecast, 2021-2033
- 6.1. Market Analysis, Insights and Forecast - by Type
- 6.1.1. Peripheral Vertigo
- 6.1.2. Central Vertigo
- 6.2. Market Analysis, Insights and Forecast - by Treatment Type
- 6.2.1. Medication
- 6.2.1.1. Over-the-counter Drugs
- 6.2.1.2. Prescription Drugs
- 6.2.2. Surgery
- 6.2.1. Medication
- 6.3. Market Analysis, Insights and Forecast - by End User
- 6.3.1. Hospitals
- 6.3.2. Clinics
- 6.3.3. Other End Users
- 6.1. Market Analysis, Insights and Forecast - by Type
- 7. North America Vertigo Treatment Industry Analysis, Insights and Forecast, 2020-2032
- 7.1. Market Analysis, Insights and Forecast - by Type
- 7.1.1. Peripheral Vertigo
- 7.1.2. Central Vertigo
- 7.2. Market Analysis, Insights and Forecast - by Treatment Type
- 7.2.1. Medication
- 7.2.1.1. Over-the-counter Drugs
- 7.2.1.2. Prescription Drugs
- 7.2.2. Surgery
- 7.2.1. Medication
- 7.3. Market Analysis, Insights and Forecast - by End User
- 7.3.1. Hospitals
- 7.3.2. Clinics
- 7.3.3. Other End Users
- 7.1. Market Analysis, Insights and Forecast - by Type
- 8. Europe Vertigo Treatment Industry Analysis, Insights and Forecast, 2020-2032
- 8.1. Market Analysis, Insights and Forecast - by Type
- 8.1.1. Peripheral Vertigo
- 8.1.2. Central Vertigo
- 8.2. Market Analysis, Insights and Forecast - by Treatment Type
- 8.2.1. Medication
- 8.2.1.1. Over-the-counter Drugs
- 8.2.1.2. Prescription Drugs
- 8.2.2. Surgery
- 8.2.1. Medication
- 8.3. Market Analysis, Insights and Forecast - by End User
- 8.3.1. Hospitals
- 8.3.2. Clinics
- 8.3.3. Other End Users
- 8.1. Market Analysis, Insights and Forecast - by Type
- 9. Asia Pacific Vertigo Treatment Industry Analysis, Insights and Forecast, 2020-2032
- 9.1. Market Analysis, Insights and Forecast - by Type
- 9.1.1. Peripheral Vertigo
- 9.1.2. Central Vertigo
- 9.2. Market Analysis, Insights and Forecast - by Treatment Type
- 9.2.1. Medication
- 9.2.1.1. Over-the-counter Drugs
- 9.2.1.2. Prescription Drugs
- 9.2.2. Surgery
- 9.2.1. Medication
- 9.3. Market Analysis, Insights and Forecast - by End User
- 9.3.1. Hospitals
- 9.3.2. Clinics
- 9.3.3. Other End Users
- 9.1. Market Analysis, Insights and Forecast - by Type
- 10. Middle East and Africa Vertigo Treatment Industry Analysis, Insights and Forecast, 2020-2032
- 10.1. Market Analysis, Insights and Forecast - by Type
- 10.1.1. Peripheral Vertigo
- 10.1.2. Central Vertigo
- 10.2. Market Analysis, Insights and Forecast - by Treatment Type
- 10.2.1. Medication
- 10.2.1.1. Over-the-counter Drugs
- 10.2.1.2. Prescription Drugs
- 10.2.2. Surgery
- 10.2.1. Medication
- 10.3. Market Analysis, Insights and Forecast - by End User
- 10.3.1. Hospitals
- 10.3.2. Clinics
- 10.3.3. Other End Users
- 10.1. Market Analysis, Insights and Forecast - by Type
- 11. South America Vertigo Treatment Industry Analysis, Insights and Forecast, 2020-2032
- 11.1. Market Analysis, Insights and Forecast - by Type
- 11.1.1. Peripheral Vertigo
- 11.1.2. Central Vertigo
- 11.2. Market Analysis, Insights and Forecast - by Treatment Type
- 11.2.1. Medication
- 11.2.1.1. Over-the-counter Drugs
- 11.2.1.2. Prescription Drugs
- 11.2.2. Surgery
- 11.2.1. Medication
- 11.3. Market Analysis, Insights and Forecast - by End User
- 11.3.1. Hospitals
- 11.3.2. Clinics
- 11.3.3. Other End Users
- 11.1. Market Analysis, Insights and Forecast - by Type
- 12. Competitive Analysis
- 12.1. Company Profiles
- 12.1.1 AdvaCare Pharma
- 12.1.1.1. Company Overview
- 12.1.1.2. Products
- 12.1.1.3. Company Financials
- 12.1.1.4. SWOT Analysis
- 12.1.2 Viatris Inc
- 12.1.2.1. Company Overview
- 12.1.2.2. Products
- 12.1.2.3. Company Financials
- 12.1.2.4. SWOT Analysis
- 12.1.3 Cipla Inc
- 12.1.3.1. Company Overview
- 12.1.3.2. Products
- 12.1.3.3. Company Financials
- 12.1.3.4. SWOT Analysis
- 12.1.4 RPG Life Sciences Limited
- 12.1.4.1. Company Overview
- 12.1.4.2. Products
- 12.1.4.3. Company Financials
- 12.1.4.4. SWOT Analysis
- 12.1.5 Teva Pharmaceutical Industries Ltd
- 12.1.5.1. Company Overview
- 12.1.5.2. Products
- 12.1.5.3. Company Financials
- 12.1.5.4. SWOT Analysis
- 12.1.6 Epic Pharma LLC
- 12.1.6.1. Company Overview
- 12.1.6.2. Products
- 12.1.6.3. Company Financials
- 12.1.6.4. SWOT Analysis
- 12.1.7 Amneal Pharmaceuticals LLC
- 12.1.7.1. Company Overview
- 12.1.7.2. Products
- 12.1.7.3. Company Financials
- 12.1.7.4. SWOT Analysis
- 12.1.8 Sun Pharmaceutical Industries Limited
- 12.1.8.1. Company Overview
- 12.1.8.2. Products
- 12.1.8.3. Company Financials
- 12.1.8.4. SWOT Analysis
- 12.1.9 Zydus Cadila
- 12.1.9.1. Company Overview
- 12.1.9.2. Products
- 12.1.9.3. Company Financials
- 12.1.9.4. SWOT Analysis
- 12.1.10 Lupin
- 12.1.10.1. Company Overview
- 12.1.10.2. Products
- 12.1.10.3. Company Financials
- 12.1.10.4. SWOT Analysis
- 12.1.11 Prestige Consumer Healthcare Inc
- 12.1.11.1. Company Overview
- 12.1.11.2. Products
- 12.1.11.3. Company Financials
- 12.1.11.4. SWOT Analysis
- 12.1.12 Pfizer Inc
- 12.1.12.1. Company Overview
- 12.1.12.2. Products
- 12.1.12.3. Company Financials
- 12.1.12.4. SWOT Analysis
- 12.1.1 AdvaCare Pharma
- 12.2. Market Entropy
- 12.2.1 Company's Key Areas Served
- 12.2.2 Recent Developments
- 12.3. Company Market Share Analysis 2025
- 12.3.1 Top 5 Companies Market Share Analysis
- 12.3.2 Top 3 Companies Market Share Analysis
- 12.4. List of Potential Customers
- 13. Research Methodology
List of Figures
- Figure 1: Global Vertigo Treatment Industry Revenue Breakdown (billion, %) by Region 2025 & 2033
- Figure 2: Global Vertigo Treatment Industry Volume Breakdown (K Unit, %) by Region 2025 & 2033
- Figure 3: North America Vertigo Treatment Industry Revenue (billion), by Type 2025 & 2033
- Figure 4: North America Vertigo Treatment Industry Volume (K Unit), by Type 2025 & 2033
- Figure 5: North America Vertigo Treatment Industry Revenue Share (%), by Type 2025 & 2033
- Figure 6: North America Vertigo Treatment Industry Volume Share (%), by Type 2025 & 2033
- Figure 7: North America Vertigo Treatment Industry Revenue (billion), by Treatment Type 2025 & 2033
- Figure 8: North America Vertigo Treatment Industry Volume (K Unit), by Treatment Type 2025 & 2033
- Figure 9: North America Vertigo Treatment Industry Revenue Share (%), by Treatment Type 2025 & 2033
- Figure 10: North America Vertigo Treatment Industry Volume Share (%), by Treatment Type 2025 & 2033
- Figure 11: North America Vertigo Treatment Industry Revenue (billion), by End User 2025 & 2033
- Figure 12: North America Vertigo Treatment Industry Volume (K Unit), by End User 2025 & 2033
- Figure 13: North America Vertigo Treatment Industry Revenue Share (%), by End User 2025 & 2033
- Figure 14: North America Vertigo Treatment Industry Volume Share (%), by End User 2025 & 2033
- Figure 15: North America Vertigo Treatment Industry Revenue (billion), by Country 2025 & 2033
- Figure 16: North America Vertigo Treatment Industry Volume (K Unit), by Country 2025 & 2033
- Figure 17: North America Vertigo Treatment Industry Revenue Share (%), by Country 2025 & 2033
- Figure 18: North America Vertigo Treatment Industry Volume Share (%), by Country 2025 & 2033
- Figure 19: Europe Vertigo Treatment Industry Revenue (billion), by Type 2025 & 2033
- Figure 20: Europe Vertigo Treatment Industry Volume (K Unit), by Type 2025 & 2033
- Figure 21: Europe Vertigo Treatment Industry Revenue Share (%), by Type 2025 & 2033
- Figure 22: Europe Vertigo Treatment Industry Volume Share (%), by Type 2025 & 2033
- Figure 23: Europe Vertigo Treatment Industry Revenue (billion), by Treatment Type 2025 & 2033
- Figure 24: Europe Vertigo Treatment Industry Volume (K Unit), by Treatment Type 2025 & 2033
- Figure 25: Europe Vertigo Treatment Industry Revenue Share (%), by Treatment Type 2025 & 2033
- Figure 26: Europe Vertigo Treatment Industry Volume Share (%), by Treatment Type 2025 & 2033
- Figure 27: Europe Vertigo Treatment Industry Revenue (billion), by End User 2025 & 2033
- Figure 28: Europe Vertigo Treatment Industry Volume (K Unit), by End User 2025 & 2033
- Figure 29: Europe Vertigo Treatment Industry Revenue Share (%), by End User 2025 & 2033
- Figure 30: Europe Vertigo Treatment Industry Volume Share (%), by End User 2025 & 2033
- Figure 31: Europe Vertigo Treatment Industry Revenue (billion), by Country 2025 & 2033
- Figure 32: Europe Vertigo Treatment Industry Volume (K Unit), by Country 2025 & 2033
- Figure 33: Europe Vertigo Treatment Industry Revenue Share (%), by Country 2025 & 2033
- Figure 34: Europe Vertigo Treatment Industry Volume Share (%), by Country 2025 & 2033
- Figure 35: Asia Pacific Vertigo Treatment Industry Revenue (billion), by Type 2025 & 2033
- Figure 36: Asia Pacific Vertigo Treatment Industry Volume (K Unit), by Type 2025 & 2033
- Figure 37: Asia Pacific Vertigo Treatment Industry Revenue Share (%), by Type 2025 & 2033
- Figure 38: Asia Pacific Vertigo Treatment Industry Volume Share (%), by Type 2025 & 2033
- Figure 39: Asia Pacific Vertigo Treatment Industry Revenue (billion), by Treatment Type 2025 & 2033
- Figure 40: Asia Pacific Vertigo Treatment Industry Volume (K Unit), by Treatment Type 2025 & 2033
- Figure 41: Asia Pacific Vertigo Treatment Industry Revenue Share (%), by Treatment Type 2025 & 2033
- Figure 42: Asia Pacific Vertigo Treatment Industry Volume Share (%), by Treatment Type 2025 & 2033
- Figure 43: Asia Pacific Vertigo Treatment Industry Revenue (billion), by End User 2025 & 2033
- Figure 44: Asia Pacific Vertigo Treatment Industry Volume (K Unit), by End User 2025 & 2033
- Figure 45: Asia Pacific Vertigo Treatment Industry Revenue Share (%), by End User 2025 & 2033
- Figure 46: Asia Pacific Vertigo Treatment Industry Volume Share (%), by End User 2025 & 2033
- Figure 47: Asia Pacific Vertigo Treatment Industry Revenue (billion), by Country 2025 & 2033
- Figure 48: Asia Pacific Vertigo Treatment Industry Volume (K Unit), by Country 2025 & 2033
- Figure 49: Asia Pacific Vertigo Treatment Industry Revenue Share (%), by Country 2025 & 2033
- Figure 50: Asia Pacific Vertigo Treatment Industry Volume Share (%), by Country 2025 & 2033
- Figure 51: Middle East and Africa Vertigo Treatment Industry Revenue (billion), by Type 2025 & 2033
- Figure 52: Middle East and Africa Vertigo Treatment Industry Volume (K Unit), by Type 2025 & 2033
- Figure 53: Middle East and Africa Vertigo Treatment Industry Revenue Share (%), by Type 2025 & 2033
- Figure 54: Middle East and Africa Vertigo Treatment Industry Volume Share (%), by Type 2025 & 2033
- Figure 55: Middle East and Africa Vertigo Treatment Industry Revenue (billion), by Treatment Type 2025 & 2033
- Figure 56: Middle East and Africa Vertigo Treatment Industry Volume (K Unit), by Treatment Type 2025 & 2033
- Figure 57: Middle East and Africa Vertigo Treatment Industry Revenue Share (%), by Treatment Type 2025 & 2033
- Figure 58: Middle East and Africa Vertigo Treatment Industry Volume Share (%), by Treatment Type 2025 & 2033
- Figure 59: Middle East and Africa Vertigo Treatment Industry Revenue (billion), by End User 2025 & 2033
- Figure 60: Middle East and Africa Vertigo Treatment Industry Volume (K Unit), by End User 2025 & 2033
- Figure 61: Middle East and Africa Vertigo Treatment Industry Revenue Share (%), by End User 2025 & 2033
- Figure 62: Middle East and Africa Vertigo Treatment Industry Volume Share (%), by End User 2025 & 2033
- Figure 63: Middle East and Africa Vertigo Treatment Industry Revenue (billion), by Country 2025 & 2033
- Figure 64: Middle East and Africa Vertigo Treatment Industry Volume (K Unit), by Country 2025 & 2033
- Figure 65: Middle East and Africa Vertigo Treatment Industry Revenue Share (%), by Country 2025 & 2033
- Figure 66: Middle East and Africa Vertigo Treatment Industry Volume Share (%), by Country 2025 & 2033
- Figure 67: South America Vertigo Treatment Industry Revenue (billion), by Type 2025 & 2033
- Figure 68: South America Vertigo Treatment Industry Volume (K Unit), by Type 2025 & 2033
- Figure 69: South America Vertigo Treatment Industry Revenue Share (%), by Type 2025 & 2033
- Figure 70: South America Vertigo Treatment Industry Volume Share (%), by Type 2025 & 2033
- Figure 71: South America Vertigo Treatment Industry Revenue (billion), by Treatment Type 2025 & 2033
- Figure 72: South America Vertigo Treatment Industry Volume (K Unit), by Treatment Type 2025 & 2033
- Figure 73: South America Vertigo Treatment Industry Revenue Share (%), by Treatment Type 2025 & 2033
- Figure 74: South America Vertigo Treatment Industry Volume Share (%), by Treatment Type 2025 & 2033
- Figure 75: South America Vertigo Treatment Industry Revenue (billion), by End User 2025 & 2033
- Figure 76: South America Vertigo Treatment Industry Volume (K Unit), by End User 2025 & 2033
- Figure 77: South America Vertigo Treatment Industry Revenue Share (%), by End User 2025 & 2033
- Figure 78: South America Vertigo Treatment Industry Volume Share (%), by End User 2025 & 2033
- Figure 79: South America Vertigo Treatment Industry Revenue (billion), by Country 2025 & 2033
- Figure 80: South America Vertigo Treatment Industry Volume (K Unit), by Country 2025 & 2033
- Figure 81: South America Vertigo Treatment Industry Revenue Share (%), by Country 2025 & 2033
- Figure 82: South America Vertigo Treatment Industry Volume Share (%), by Country 2025 & 2033
List of Tables
- Table 1: Global Vertigo Treatment Industry Revenue billion Forecast, by Type 2020 & 2033
- Table 2: Global Vertigo Treatment Industry Volume K Unit Forecast, by Type 2020 & 2033
- Table 3: Global Vertigo Treatment Industry Revenue billion Forecast, by Treatment Type 2020 & 2033
- Table 4: Global Vertigo Treatment Industry Volume K Unit Forecast, by Treatment Type 2020 & 2033
- Table 5: Global Vertigo Treatment Industry Revenue billion Forecast, by End User 2020 & 2033
- Table 6: Global Vertigo Treatment Industry Volume K Unit Forecast, by End User 2020 & 2033
- Table 7: Global Vertigo Treatment Industry Revenue billion Forecast, by Region 2020 & 2033
- Table 8: Global Vertigo Treatment Industry Volume K Unit Forecast, by Region 2020 & 2033
- Table 9: Global Vertigo Treatment Industry Revenue billion Forecast, by Type 2020 & 2033
- Table 10: Global Vertigo Treatment Industry Volume K Unit Forecast, by Type 2020 & 2033
- Table 11: Global Vertigo Treatment Industry Revenue billion Forecast, by Treatment Type 2020 & 2033
- Table 12: Global Vertigo Treatment Industry Volume K Unit Forecast, by Treatment Type 2020 & 2033
- Table 13: Global Vertigo Treatment Industry Revenue billion Forecast, by End User 2020 & 2033
- Table 14: Global Vertigo Treatment Industry Volume K Unit Forecast, by End User 2020 & 2033
- Table 15: Global Vertigo Treatment Industry Revenue billion Forecast, by Country 2020 & 2033
- Table 16: Global Vertigo Treatment Industry Volume K Unit Forecast, by Country 2020 & 2033
- Table 17: United States Vertigo Treatment Industry Revenue (billion) Forecast, by Application 2020 & 2033
- Table 18: United States Vertigo Treatment Industry Volume (K Unit) Forecast, by Application 2020 & 2033
- Table 19: Canada Vertigo Treatment Industry Revenue (billion) Forecast, by Application 2020 & 2033
- Table 20: Canada Vertigo Treatment Industry Volume (K Unit) Forecast, by Application 2020 & 2033
- Table 21: Mexico Vertigo Treatment Industry Revenue (billion) Forecast, by Application 2020 & 2033
- Table 22: Mexico Vertigo Treatment Industry Volume (K Unit) Forecast, by Application 2020 & 2033
- Table 23: Global Vertigo Treatment Industry Revenue billion Forecast, by Type 2020 & 2033
- Table 24: Global Vertigo Treatment Industry Volume K Unit Forecast, by Type 2020 & 2033
- Table 25: Global Vertigo Treatment Industry Revenue billion Forecast, by Treatment Type 2020 & 2033
- Table 26: Global Vertigo Treatment Industry Volume K Unit Forecast, by Treatment Type 2020 & 2033
- Table 27: Global Vertigo Treatment Industry Revenue billion Forecast, by End User 2020 & 2033
- Table 28: Global Vertigo Treatment Industry Volume K Unit Forecast, by End User 2020 & 2033
- Table 29: Global Vertigo Treatment Industry Revenue billion Forecast, by Country 2020 & 2033
- Table 30: Global Vertigo Treatment Industry Volume K Unit Forecast, by Country 2020 & 2033
- Table 31: Germany Vertigo Treatment Industry Revenue (billion) Forecast, by Application 2020 & 2033
- Table 32: Germany Vertigo Treatment Industry Volume (K Unit) Forecast, by Application 2020 & 2033
- Table 33: United Kingdom Vertigo Treatment Industry Revenue (billion) Forecast, by Application 2020 & 2033
- Table 34: United Kingdom Vertigo Treatment Industry Volume (K Unit) Forecast, by Application 2020 & 2033
- Table 35: France Vertigo Treatment Industry Revenue (billion) Forecast, by Application 2020 & 2033
- Table 36: France Vertigo Treatment Industry Volume (K Unit) Forecast, by Application 2020 & 2033
- Table 37: Italy Vertigo Treatment Industry Revenue (billion) Forecast, by Application 2020 & 2033
- Table 38: Italy Vertigo Treatment Industry Volume (K Unit) Forecast, by Application 2020 & 2033
- Table 39: Spain Vertigo Treatment Industry Revenue (billion) Forecast, by Application 2020 & 2033
- Table 40: Spain Vertigo Treatment Industry Volume (K Unit) Forecast, by Application 2020 & 2033
- Table 41: Rest of Europe Vertigo Treatment Industry Revenue (billion) Forecast, by Application 2020 & 2033
- Table 42: Rest of Europe Vertigo Treatment Industry Volume (K Unit) Forecast, by Application 2020 & 2033
- Table 43: Global Vertigo Treatment Industry Revenue billion Forecast, by Type 2020 & 2033
- Table 44: Global Vertigo Treatment Industry Volume K Unit Forecast, by Type 2020 & 2033
- Table 45: Global Vertigo Treatment Industry Revenue billion Forecast, by Treatment Type 2020 & 2033
- Table 46: Global Vertigo Treatment Industry Volume K Unit Forecast, by Treatment Type 2020 & 2033
- Table 47: Global Vertigo Treatment Industry Revenue billion Forecast, by End User 2020 & 2033
- Table 48: Global Vertigo Treatment Industry Volume K Unit Forecast, by End User 2020 & 2033
- Table 49: Global Vertigo Treatment Industry Revenue billion Forecast, by Country 2020 & 2033
- Table 50: Global Vertigo Treatment Industry Volume K Unit Forecast, by Country 2020 & 2033
- Table 51: China Vertigo Treatment Industry Revenue (billion) Forecast, by Application 2020 & 2033
- Table 52: China Vertigo Treatment Industry Volume (K Unit) Forecast, by Application 2020 & 2033
- Table 53: Japan Vertigo Treatment Industry Revenue (billion) Forecast, by Application 2020 & 2033
- Table 54: Japan Vertigo Treatment Industry Volume (K Unit) Forecast, by Application 2020 & 2033
- Table 55: India Vertigo Treatment Industry Revenue (billion) Forecast, by Application 2020 & 2033
- Table 56: India Vertigo Treatment Industry Volume (K Unit) Forecast, by Application 2020 & 2033
- Table 57: Australia Vertigo Treatment Industry Revenue (billion) Forecast, by Application 2020 & 2033
- Table 58: Australia Vertigo Treatment Industry Volume (K Unit) Forecast, by Application 2020 & 2033
- Table 59: South Korea Vertigo Treatment Industry Revenue (billion) Forecast, by Application 2020 & 2033
- Table 60: South Korea Vertigo Treatment Industry Volume (K Unit) Forecast, by Application 2020 & 2033
- Table 61: Rest of Asia Pacific Vertigo Treatment Industry Revenue (billion) Forecast, by Application 2020 & 2033
- Table 62: Rest of Asia Pacific Vertigo Treatment Industry Volume (K Unit) Forecast, by Application 2020 & 2033
- Table 63: Global Vertigo Treatment Industry Revenue billion Forecast, by Type 2020 & 2033
- Table 64: Global Vertigo Treatment Industry Volume K Unit Forecast, by Type 2020 & 2033
- Table 65: Global Vertigo Treatment Industry Revenue billion Forecast, by Treatment Type 2020 & 2033
- Table 66: Global Vertigo Treatment Industry Volume K Unit Forecast, by Treatment Type 2020 & 2033
- Table 67: Global Vertigo Treatment Industry Revenue billion Forecast, by End User 2020 & 2033
- Table 68: Global Vertigo Treatment Industry Volume K Unit Forecast, by End User 2020 & 2033
- Table 69: Global Vertigo Treatment Industry Revenue billion Forecast, by Country 2020 & 2033
- Table 70: Global Vertigo Treatment Industry Volume K Unit Forecast, by Country 2020 & 2033
- Table 71: GCC Vertigo Treatment Industry Revenue (billion) Forecast, by Application 2020 & 2033
- Table 72: GCC Vertigo Treatment Industry Volume (K Unit) Forecast, by Application 2020 & 2033
- Table 73: South Africa Vertigo Treatment Industry Revenue (billion) Forecast, by Application 2020 & 2033
- Table 74: South Africa Vertigo Treatment Industry Volume (K Unit) Forecast, by Application 2020 & 2033
- Table 75: Rest of Middle East and Africa Vertigo Treatment Industry Revenue (billion) Forecast, by Application 2020 & 2033
- Table 76: Rest of Middle East and Africa Vertigo Treatment Industry Volume (K Unit) Forecast, by Application 2020 & 2033
- Table 77: Global Vertigo Treatment Industry Revenue billion Forecast, by Type 2020 & 2033
- Table 78: Global Vertigo Treatment Industry Volume K Unit Forecast, by Type 2020 & 2033
- Table 79: Global Vertigo Treatment Industry Revenue billion Forecast, by Treatment Type 2020 & 2033
- Table 80: Global Vertigo Treatment Industry Volume K Unit Forecast, by Treatment Type 2020 & 2033
- Table 81: Global Vertigo Treatment Industry Revenue billion Forecast, by End User 2020 & 2033
- Table 82: Global Vertigo Treatment Industry Volume K Unit Forecast, by End User 2020 & 2033
- Table 83: Global Vertigo Treatment Industry Revenue billion Forecast, by Country 2020 & 2033
- Table 84: Global Vertigo Treatment Industry Volume K Unit Forecast, by Country 2020 & 2033
- Table 85: Brazil Vertigo Treatment Industry Revenue (billion) Forecast, by Application 2020 & 2033
- Table 86: Brazil Vertigo Treatment Industry Volume (K Unit) Forecast, by Application 2020 & 2033
- Table 87: Argentina Vertigo Treatment Industry Revenue (billion) Forecast, by Application 2020 & 2033
- Table 88: Argentina Vertigo Treatment Industry Volume (K Unit) Forecast, by Application 2020 & 2033
- Table 89: Rest of South America Vertigo Treatment Industry Revenue (billion) Forecast, by Application 2020 & 2033
- Table 90: Rest of South America Vertigo Treatment Industry Volume (K Unit) Forecast, by Application 2020 & 2033
Frequently Asked Questions
1. What is the projected Compound Annual Growth Rate (CAGR) of the Vertigo Treatment Industry?
The projected CAGR is approximately 4.89%.
2. Which companies are prominent players in the Vertigo Treatment Industry?
Key companies in the market include AdvaCare Pharma, Viatris Inc, Cipla Inc, RPG Life Sciences Limited, Teva Pharmaceutical Industries Ltd, Epic Pharma LLC, Amneal Pharmaceuticals LLC, Sun Pharmaceutical Industries Limited, Zydus Cadila, Lupin, Prestige Consumer Healthcare Inc, Pfizer Inc.
3. What are the main segments of the Vertigo Treatment Industry?
The market segments include Type, Treatment Type, End User.
4. Can you provide details about the market size?
The market size is estimated to be USD 2.02 billion as of 2022.
5. What are some drivers contributing to market growth?
Rise In Prevalence Of Vertigo Coupled With Increase In Geriatric Population; Rise In Health Care Expenditure.
6. What are the notable trends driving market growth?
Peripheral Vertigo Segment is Expected to Hold Significant Market Share Over the Forecast Period.
7. Are there any restraints impacting market growth?
Ignorance Towards the Symptoms And Causes Of The Vertigo.
8. Can you provide examples of recent developments in the market?
In November 2022, Apollo launched a vertigo and balance disorder clinic in its hospital in Hyderabad, India. This is expected to grow the vertigo treatment in India.
9. What pricing options are available for accessing the report?
Pricing options include single-user, multi-user, and enterprise licenses priced at USD 4750, USD 5250, and USD 8750 respectively.
10. Is the market size provided in terms of value or volume?
The market size is provided in terms of value, measured in billion and volume, measured in K Unit.
11. Are there any specific market keywords associated with the report?
Yes, the market keyword associated with the report is "Vertigo Treatment Industry," which aids in identifying and referencing the specific market segment covered.
12. How do I determine which pricing option suits my needs best?
The pricing options vary based on user requirements and access needs. Individual users may opt for single-user licenses, while businesses requiring broader access may choose multi-user or enterprise licenses for cost-effective access to the report.
13. Are there any additional resources or data provided in the Vertigo Treatment Industry report?
While the report offers comprehensive insights, it's advisable to review the specific contents or supplementary materials provided to ascertain if additional resources or data are available.
14. How can I stay updated on further developments or reports in the Vertigo Treatment Industry?
To stay informed about further developments, trends, and reports in the Vertigo Treatment Industry, consider subscribing to industry newsletters, following relevant companies and organizations, or regularly checking reputable industry news sources and publications.
Methodology
Step 1 - Identification of Relevant Samples Size from Population Database


Step 2 - Approaches for Defining Global Market Size (Value, Volume* & Price*)

Note*: In applicable scenarios
Step 3 - Data Sources
Primary Research
- Web Analytics
- Survey Reports
- Research Institute
- Latest Research Reports
- Opinion Leaders
Secondary Research
- Annual Reports
- White Paper
- Latest Press Release
- Industry Association
- Paid Database
- Investor Presentations

Step 4 - Data Triangulation
Involves using different sources of information in order to increase the validity of a study
These sources are likely to be stakeholders in a program - participants, other researchers, program staff, other community members, and so on.
Then we put all data in single framework & apply various statistical tools to find out the dynamic on the market.
During the analysis stage, feedback from the stakeholder groups would be compared to determine areas of agreement as well as areas of divergence