

Key Insights
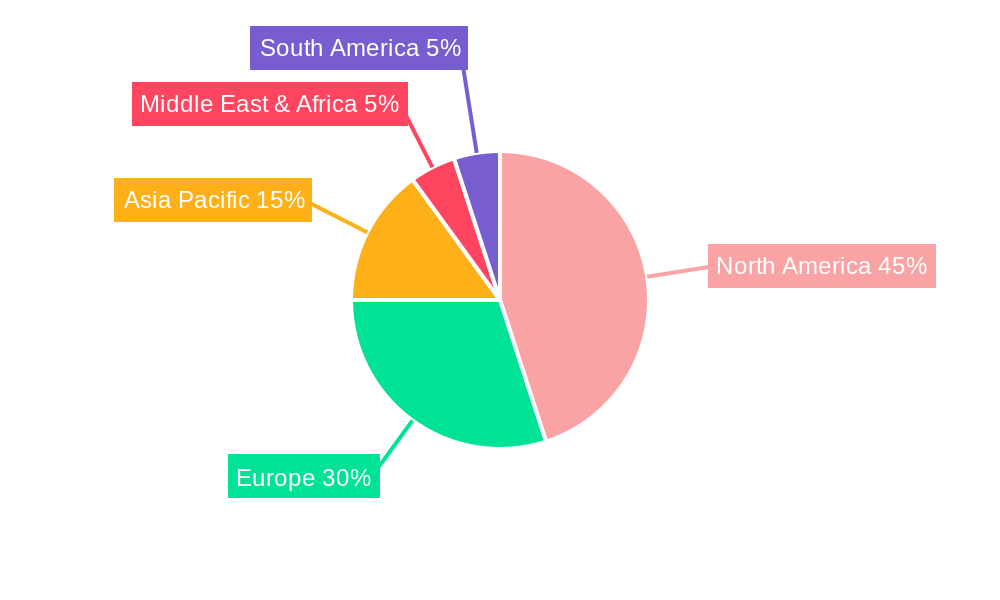
The global non-fusion spinal devices market, currently exhibiting robust growth, is projected to reach a substantial size driven by several key factors. The rising prevalence of degenerative spinal diseases, such as osteoarthritis and spondylolisthesis, coupled with an aging global population, fuels significant demand for less invasive spinal treatments. Technological advancements in minimally invasive surgical techniques and the development of innovative devices like artificial disc replacements and dynamic stabilization systems contribute significantly to market expansion. Furthermore, the increasing preference for non-fusion procedures offering improved patient outcomes, faster recovery times, and preservation of spinal motion is driving market growth. This preference is reinforced by the growing awareness among patients and surgeons regarding the potential long-term benefits of non-fusion compared to traditional fusion surgeries. The market is segmented by product type (artificial disc replacements, dynamic stabilization devices, annulus repair devices, nuclear disc prostheses, and others) and end-user (hospitals, orthopedic centers, and other end-users). Competition is fierce among established players like Zimmer Biomet, Medtronic, and Stryker, alongside emerging companies constantly innovating to capture market share. North America currently holds a dominant position due to high healthcare expenditure, technological advancements, and a significant patient pool. However, the Asia-Pacific region is anticipated to demonstrate rapid growth in the coming years due to increasing healthcare infrastructure development and rising disposable incomes. While regulatory hurdles and high device costs pose some challenges, the overall market outlook remains positive, driven by ongoing technological breakthroughs and increasing patient demand for less invasive spinal care.
The market's growth trajectory is expected to continue, propelled by several factors. Ongoing research and development efforts will likely result in the introduction of new and improved non-fusion spinal devices with enhanced functionality and biocompatibility. This, coupled with strategic partnerships and acquisitions within the industry, will further fuel market expansion. Furthermore, growing awareness campaigns educating patients about less invasive spinal surgery options are expected to positively impact market growth. Geographic expansion, particularly in emerging markets with growing healthcare infrastructure, presents significant opportunities for market players. A notable trend is the increasing adoption of personalized medicine approaches in spinal surgery, tailoring treatment strategies to individual patient needs and anatomical variations. This personalized approach is likely to further increase the demand for sophisticated non-fusion spinal devices in the years to come, contributing to a sustained market expansion across all major geographical regions.
Non Fusion Spinal Devices Industry: A Comprehensive Market Report (2019-2033)
This insightful report provides a detailed analysis of the Non Fusion Spinal Devices market, offering a comprehensive overview of its current state and future trajectory. With a focus on key market trends, leading players, and emerging opportunities, this report is an essential resource for stakeholders seeking to understand and capitalize on the growth potential within this dynamic sector. The study period covers 2019-2033, with a base year of 2025 and a forecast period of 2025-2033. The total market value in 2025 is estimated at $XX Million.
Non Fusion Spinal Devices Industry Market Composition & Trends
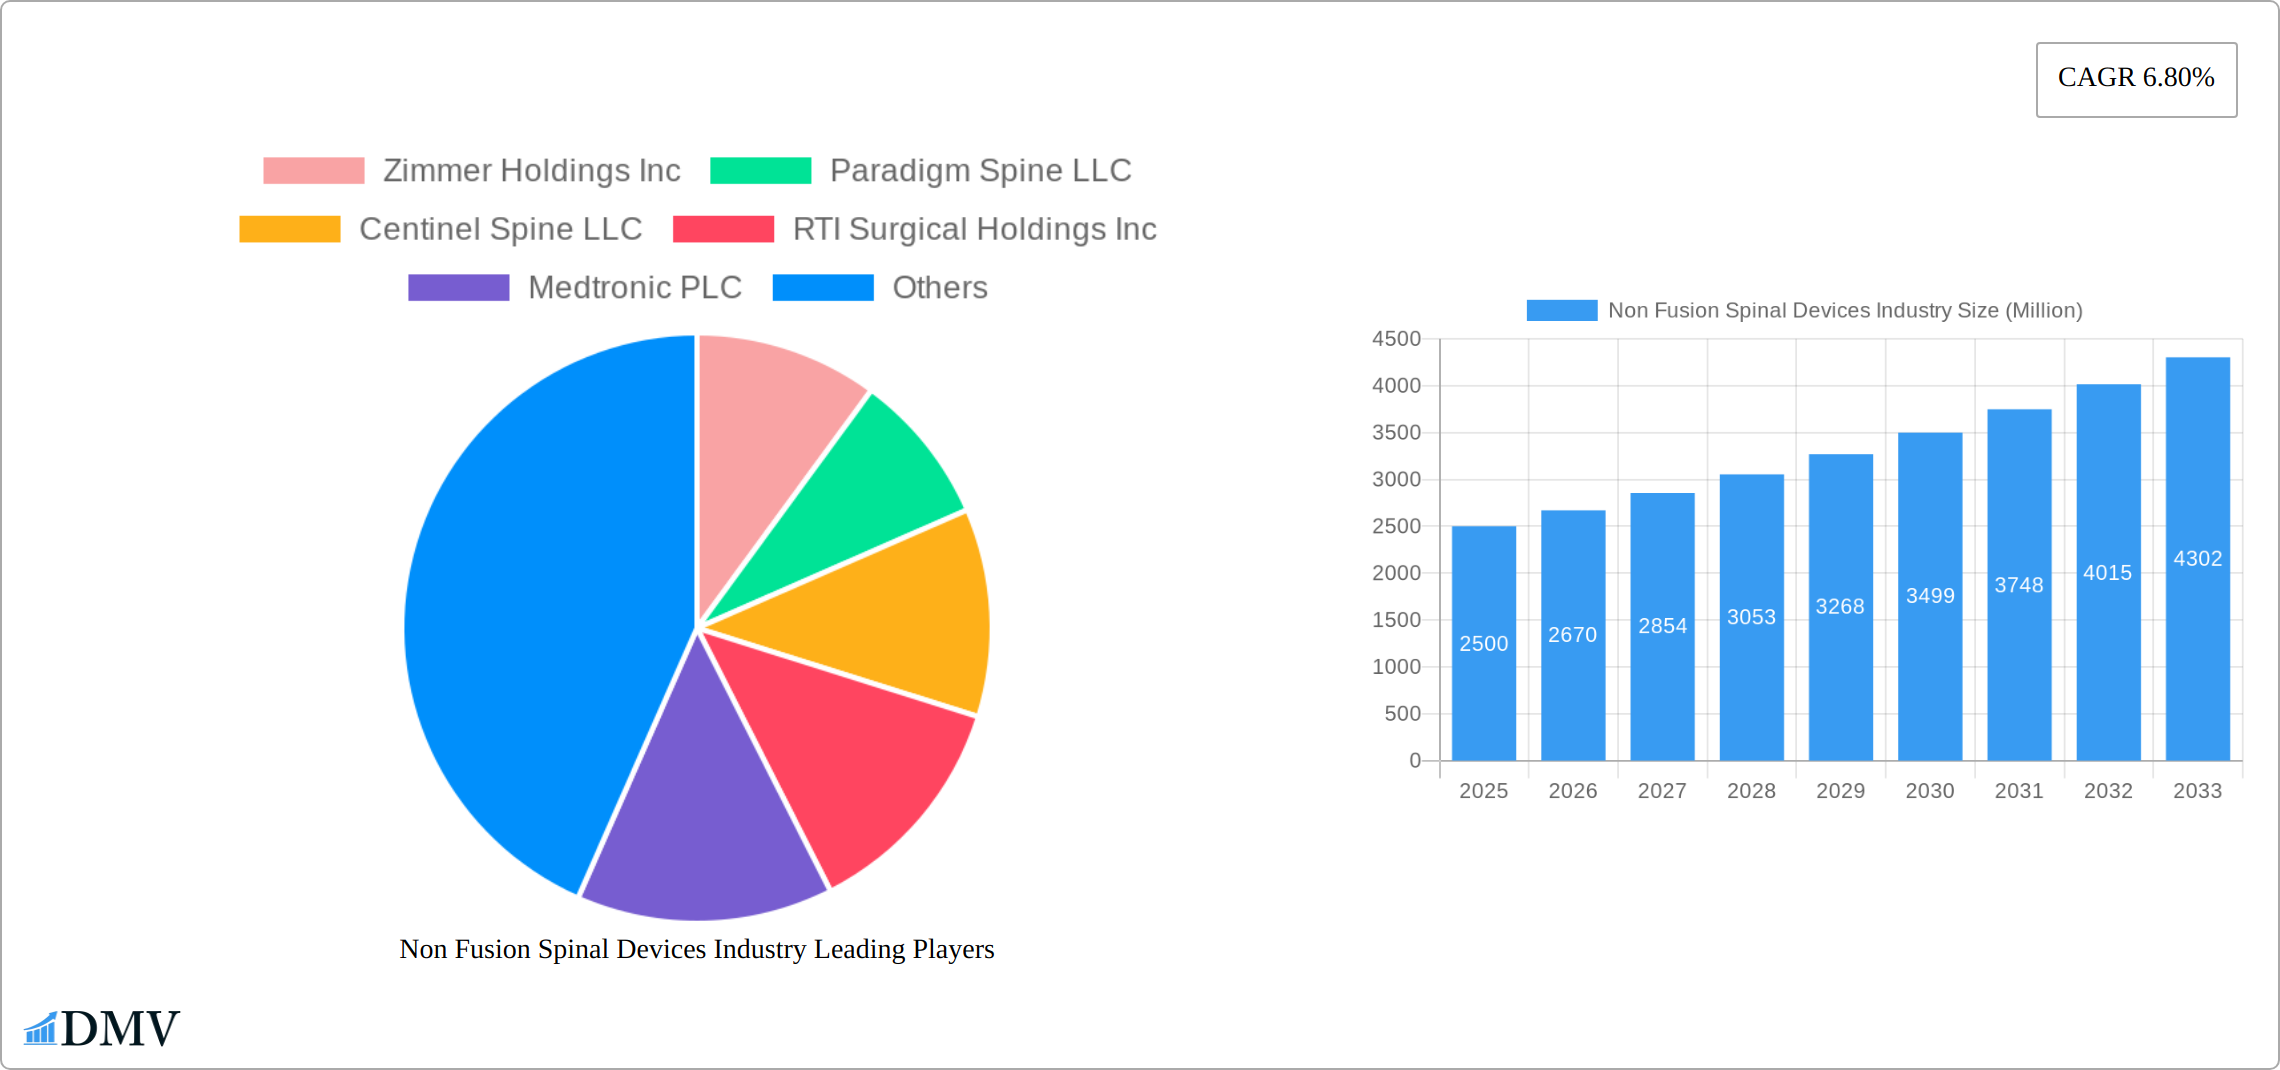
The Non-Fusion Spinal Devices market exhibits a moderately concentrated competitive landscape, with several key players vying for market dominance. This concentration is shaped by a confluence of factors including rapid technological advancements, stringent regulatory approvals, and strategic mergers and acquisitions (M&A) activity. Innovation serves as a primary growth driver, pushing companies to continuously develop cutting-edge devices that address evolving clinical needs and patient preferences. The regulatory environment plays a pivotal role, significantly influencing product approvals and market access. Traditional fusion surgeries remain a key competitive substitute. The primary end-users are hospitals and specialized orthopedic centers, with a notable and expanding segment of other healthcare providers. Significant M&A activity, characterized by several high-value transactions, continues to reshape market dynamics and competitive positioning.
- Market Share Distribution (2024): Medtronic PLC (XX%), Johnson & Johnson (XX%), Stryker Corporation (XX%), Zimmer Biomet (XX%), Others (XX%). (Note: Percentages are estimations and require specific data for accuracy.)
- Recent M&A Activity and Market Consolidation: The acquisition of Simplify Medical by NuVasive in February 2021, valued at $XX Million, exemplifies the strategic consolidation underway within the market. Similarly, IMPLANET's March 2021 offer to acquire a majority stake in Orthopedic & Spine Development (OSD) underscores this trend towards larger entities. The average deal value for M&A activities over the past 5 years is estimated at $XX Million. This consolidation is expected to continue, driven by the desire to achieve economies of scale, expand product portfolios, and enhance market reach.
Non Fusion Spinal Devices Industry Industry Evolution
The Non Fusion Spinal Devices market has experienced significant growth over the historical period (2019-2024), driven by factors such as the increasing prevalence of degenerative spine diseases, advancements in minimally invasive surgical techniques, and rising patient preference for less-invasive treatment options. Technological advancements, particularly in materials science and biomechanics, have led to the development of more effective and durable devices. This has resulted in improved clinical outcomes and increased patient satisfaction. Consumer demand is shifting towards personalized medicine and tailored treatment approaches, driving innovation in device design and surgical techniques. The market is expected to maintain a strong growth trajectory during the forecast period (2025-2033), with a Compound Annual Growth Rate (CAGR) estimated at XX%. Adoption of non-fusion devices is expected to increase by XX% annually during the forecast period. This growth is underpinned by increasing awareness and understanding of the benefits associated with non-fusion techniques, as well as ongoing technological improvements.
Leading Regions, Countries, or Segments in Non Fusion Spinal Devices Industry
North America currently holds the dominant position in the Non-Fusion Spinal Devices market. This leadership is attributed to several key factors: high healthcare expenditure, a substantial and aging population exhibiting a high prevalence of spine disorders, and a robust regulatory framework that actively supports medical innovation. Within the product segments, Artificial Disc Replacement commands the largest market share, followed closely by Dynamic Stabilization Devices. Hospitals constitute the largest end-user segment.
Key Drivers for North American Dominance:
- High healthcare spending and comprehensive insurance coverage.
- A large and aging population with a significantly high prevalence of spinal disorders.
- A supportive regulatory environment that fosters innovation and facilitates market access for new technologies.
- A strong presence of major industry players with well-established distribution networks and significant market penetration.
Other Regions and Segments: The European and Asian markets are projected to experience robust growth throughout the forecast period. This expansion will be fueled by rising healthcare expenditure in these regions, increasing awareness of less invasive non-fusion spinal techniques, and wider adoption of advanced technologies. The Artificial Disc Replacement segment is anticipated to maintain its leading market share due to its proven clinical efficacy and steadily increasing market acceptance. The dynamic stabilization devices segment also presents considerable growth potential, driven by ongoing technological advancements and improved surgical techniques.
Non Fusion Spinal Devices Industry Product Innovations
Recent breakthroughs in non-fusion spinal devices encompass the development of biocompatible materials designed to enhance osseointegration (bone-implant integration), extend device longevity, and minimize the risk of complications. Advanced imaging technologies and minimally invasive surgical procedures are significantly improving the precision and efficiency of spinal surgeries. Furthermore, the integration of smart technologies and data analytics is enabling the implementation of personalized treatment strategies, ultimately leading to better patient outcomes. These innovations are steadily strengthening the unique selling propositions of non-fusion devices compared to traditional fusion surgeries, thereby accelerating market adoption and driving overall market growth.
Propelling Factors for Non Fusion Spinal Devices Industry Growth
The Non Fusion Spinal Devices market is experiencing robust growth fueled by technological advancements leading to improved device performance and minimally invasive surgical techniques. Economic factors, including increasing healthcare spending and insurance coverage, are further contributing to market expansion. Favorable regulatory environments in key regions are also accelerating market growth by facilitating product approvals and market access.
Obstacles in the Non Fusion Spinal Devices Industry Market
Significant barriers to market growth include stringent regulatory hurdles for new device approvals, potentially delaying market entry and increasing development costs. Supply chain disruptions, particularly in the procurement of raw materials and components, can impact device availability and pricing. Intense competition amongst established players and emerging entrants adds pressure on pricing and profit margins.
Future Opportunities in Non Fusion Spinal Devices Industry
Future opportunities lie in expanding into emerging markets, particularly in Asia and Latin America, where the prevalence of spinal disorders is increasing. Developing innovative devices with advanced materials and functionalities holds substantial promise. Personalized medicine approaches tailored to individual patient needs represent a significant area of growth.
Major Players in the Non Fusion Spinal Devices Industry Ecosystem
- Zimmer Holdings Inc
- Paradigm Spine LLC
- Centinel Spine LLC
- RTI Surgical Holdings Inc
- Medtronic PLC
- Johnson & Johnson
- Stryker Corporation
- B Braun Melsungen
- Pioneer Surgical Technologies
- ATEC Spine Inc
- Invibio Ltd
- NuVasive Inc
Key Developments in Non Fusion Spinal Devices Industry Industry
- February 2021: NuVasive acquired Simplify Medical, expanding its cervical total disc replacement (cTDR) portfolio.
- March 2021: IMPLANET's bid to acquire a majority stake in Orthopedic & Spine Development (OSD) signaled increased consolidation within the market.
Strategic Non Fusion Spinal Devices Industry Market Forecast
The Non-Fusion Spinal Devices market is poised for sustained growth, propelled by ongoing technological advancements, the rising prevalence of spinal disorders globally, and increasing access to quality healthcare. Emerging markets and the continuous development of innovative devices will create significant opportunities for market expansion. The market is projected to reach $XX Million by 2033, representing considerable growth potential for all stakeholders. This forecast is contingent upon several factors, including continued innovation, regulatory approvals, and the overall economic climate.
Non Fusion Spinal Devices Industry Segmentation
-
1. Product
- 1.1. Artificial Discs Replacement
- 1.2. Dynamic Stabilization Devices
- 1.3. Annulus Repair Devices
- 1.4. Nuclear Disc Prostheses
- 1.5. Other Products
-
2. End User
- 2.1. Hospitals
- 2.2. Orthopedic Centers
- 2.3. Other End Users
Non Fusion Spinal Devices Industry Segmentation By Geography
-
1. North America
- 1.1. United States
- 1.2. Canada
- 1.3. Mexico
-
2. Europe
- 2.1. United Kingdom
- 2.2. Germany
- 2.3. France
- 2.4. Italy
- 2.5. Spain
- 2.6. Rest of Europe
-
3. Asia Pacific
- 3.1. China
- 3.2. Japan
- 3.3. India
- 3.4. Australia
- 3.5. South Korea
- 3.6. Rest of Asia Pacific
-
4. Middle East and Africa
- 4.1. GCC
- 4.2. South Africa
- 4.3. Rest of Middle East and Africa
-
5. South America
- 5.1. Brazil
- 5.2. Argentina
- 5.3. Rest of South America
Non Fusion Spinal Devices Industry REPORT HIGHLIGHTS
| Aspects | Details |
|---|---|
| Study Period | 2019-2033 |
| Base Year | 2024 |
| Estimated Year | 2025 |
| Forecast Period | 2025-2033 |
| Historical Period | 2019-2024 |
| Growth Rate | CAGR of 6.80% from 2019-2033 |
| Segmentation |
|
Table of Contents
- 1. Introduction
- 1.1. Research Scope
- 1.2. Market Segmentation
- 1.3. Research Methodology
- 1.4. Definitions and Assumptions
- 2. Executive Summary
- 2.1. Introduction
- 3. Market Dynamics
- 3.1. Introduction
- 3.2. Market Drivers
- 3.2.1. Increasing Cases of Degenerative Disc Disease (DDD); Acceptance of Minimally Invasive Surgeries such as Disc Arthroscopy; Advantages over Spinal Fusion Surgeries
- 3.3. Market Restrains
- 3.3.1. Reimbursement Challenges; Availability of Alternatives
- 3.4. Market Trends
- 3.4.1. Dynamic Stabilization Devices Segment Captured the Largest Market Share
- 4. Market Factor Analysis
- 4.1. Porters Five Forces
- 4.2. Supply/Value Chain
- 4.3. PESTEL analysis
- 4.4. Market Entropy
- 4.5. Patent/Trademark Analysis
- 5. Global Non Fusion Spinal Devices Industry Analysis, Insights and Forecast, 2019-2031
- 5.1. Market Analysis, Insights and Forecast - by Product
- 5.1.1. Artificial Discs Replacement
- 5.1.2. Dynamic Stabilization Devices
- 5.1.3. Annulus Repair Devices
- 5.1.4. Nuclear Disc Prostheses
- 5.1.5. Other Products
- 5.2. Market Analysis, Insights and Forecast - by End User
- 5.2.1. Hospitals
- 5.2.2. Orthopedic Centers
- 5.2.3. Other End Users
- 5.3. Market Analysis, Insights and Forecast - by Region
- 5.3.1. North America
- 5.3.2. Europe
- 5.3.3. Asia Pacific
- 5.3.4. Middle East and Africa
- 5.3.5. South America
- 5.1. Market Analysis, Insights and Forecast - by Product
- 6. North America Non Fusion Spinal Devices Industry Analysis, Insights and Forecast, 2019-2031
- 6.1. Market Analysis, Insights and Forecast - by Product
- 6.1.1. Artificial Discs Replacement
- 6.1.2. Dynamic Stabilization Devices
- 6.1.3. Annulus Repair Devices
- 6.1.4. Nuclear Disc Prostheses
- 6.1.5. Other Products
- 6.2. Market Analysis, Insights and Forecast - by End User
- 6.2.1. Hospitals
- 6.2.2. Orthopedic Centers
- 6.2.3. Other End Users
- 6.1. Market Analysis, Insights and Forecast - by Product
- 7. Europe Non Fusion Spinal Devices Industry Analysis, Insights and Forecast, 2019-2031
- 7.1. Market Analysis, Insights and Forecast - by Product
- 7.1.1. Artificial Discs Replacement
- 7.1.2. Dynamic Stabilization Devices
- 7.1.3. Annulus Repair Devices
- 7.1.4. Nuclear Disc Prostheses
- 7.1.5. Other Products
- 7.2. Market Analysis, Insights and Forecast - by End User
- 7.2.1. Hospitals
- 7.2.2. Orthopedic Centers
- 7.2.3. Other End Users
- 7.1. Market Analysis, Insights and Forecast - by Product
- 8. Asia Pacific Non Fusion Spinal Devices Industry Analysis, Insights and Forecast, 2019-2031
- 8.1. Market Analysis, Insights and Forecast - by Product
- 8.1.1. Artificial Discs Replacement
- 8.1.2. Dynamic Stabilization Devices
- 8.1.3. Annulus Repair Devices
- 8.1.4. Nuclear Disc Prostheses
- 8.1.5. Other Products
- 8.2. Market Analysis, Insights and Forecast - by End User
- 8.2.1. Hospitals
- 8.2.2. Orthopedic Centers
- 8.2.3. Other End Users
- 8.1. Market Analysis, Insights and Forecast - by Product
- 9. Middle East and Africa Non Fusion Spinal Devices Industry Analysis, Insights and Forecast, 2019-2031
- 9.1. Market Analysis, Insights and Forecast - by Product
- 9.1.1. Artificial Discs Replacement
- 9.1.2. Dynamic Stabilization Devices
- 9.1.3. Annulus Repair Devices
- 9.1.4. Nuclear Disc Prostheses
- 9.1.5. Other Products
- 9.2. Market Analysis, Insights and Forecast - by End User
- 9.2.1. Hospitals
- 9.2.2. Orthopedic Centers
- 9.2.3. Other End Users
- 9.1. Market Analysis, Insights and Forecast - by Product
- 10. South America Non Fusion Spinal Devices Industry Analysis, Insights and Forecast, 2019-2031
- 10.1. Market Analysis, Insights and Forecast - by Product
- 10.1.1. Artificial Discs Replacement
- 10.1.2. Dynamic Stabilization Devices
- 10.1.3. Annulus Repair Devices
- 10.1.4. Nuclear Disc Prostheses
- 10.1.5. Other Products
- 10.2. Market Analysis, Insights and Forecast - by End User
- 10.2.1. Hospitals
- 10.2.2. Orthopedic Centers
- 10.2.3. Other End Users
- 10.1. Market Analysis, Insights and Forecast - by Product
- 11. North America Non Fusion Spinal Devices Industry Analysis, Insights and Forecast, 2019-2031
- 11.1. Market Analysis, Insights and Forecast - By Country/Sub-region
- 11.1.1 United States
- 11.1.2 Canada
- 11.1.3 Mexico
- 12. Europe Non Fusion Spinal Devices Industry Analysis, Insights and Forecast, 2019-2031
- 12.1. Market Analysis, Insights and Forecast - By Country/Sub-region
- 12.1.1 United Kingdom
- 12.1.2 Germany
- 12.1.3 France
- 12.1.4 Italy
- 12.1.5 Spain
- 12.1.6 Rest of Europe
- 13. Asia Pacific Non Fusion Spinal Devices Industry Analysis, Insights and Forecast, 2019-2031
- 13.1. Market Analysis, Insights and Forecast - By Country/Sub-region
- 13.1.1 China
- 13.1.2 Japan
- 13.1.3 India
- 13.1.4 Australia
- 13.1.5 South Korea
- 13.1.6 Rest of Asia Pacific
- 14. Middle East and Africa Non Fusion Spinal Devices Industry Analysis, Insights and Forecast, 2019-2031
- 14.1. Market Analysis, Insights and Forecast - By Country/Sub-region
- 14.1.1 GCC
- 14.1.2 South Africa
- 14.1.3 Rest of Middle East and Africa
- 15. South America Non Fusion Spinal Devices Industry Analysis, Insights and Forecast, 2019-2031
- 15.1. Market Analysis, Insights and Forecast - By Country/Sub-region
- 15.1.1 Brazil
- 15.1.2 Argentina
- 15.1.3 Rest of South America
- 16. Competitive Analysis
- 16.1. Global Market Share Analysis 2024
- 16.2. Company Profiles
- 16.2.1 Zimmer Holdings Inc
- 16.2.1.1. Overview
- 16.2.1.2. Products
- 16.2.1.3. SWOT Analysis
- 16.2.1.4. Recent Developments
- 16.2.1.5. Financials (Based on Availability)
- 16.2.2 Paradigm Spine LLC
- 16.2.2.1. Overview
- 16.2.2.2. Products
- 16.2.2.3. SWOT Analysis
- 16.2.2.4. Recent Developments
- 16.2.2.5. Financials (Based on Availability)
- 16.2.3 Centinel Spine LLC
- 16.2.3.1. Overview
- 16.2.3.2. Products
- 16.2.3.3. SWOT Analysis
- 16.2.3.4. Recent Developments
- 16.2.3.5. Financials (Based on Availability)
- 16.2.4 RTI Surgical Holdings Inc
- 16.2.4.1. Overview
- 16.2.4.2. Products
- 16.2.4.3. SWOT Analysis
- 16.2.4.4. Recent Developments
- 16.2.4.5. Financials (Based on Availability)
- 16.2.5 Medtronic PLC
- 16.2.5.1. Overview
- 16.2.5.2. Products
- 16.2.5.3. SWOT Analysis
- 16.2.5.4. Recent Developments
- 16.2.5.5. Financials (Based on Availability)
- 16.2.6 Johnson & Johnson
- 16.2.6.1. Overview
- 16.2.6.2. Products
- 16.2.6.3. SWOT Analysis
- 16.2.6.4. Recent Developments
- 16.2.6.5. Financials (Based on Availability)
- 16.2.7 Stryker Corporation
- 16.2.7.1. Overview
- 16.2.7.2. Products
- 16.2.7.3. SWOT Analysis
- 16.2.7.4. Recent Developments
- 16.2.7.5. Financials (Based on Availability)
- 16.2.8 B Braun Melsungen
- 16.2.8.1. Overview
- 16.2.8.2. Products
- 16.2.8.3. SWOT Analysis
- 16.2.8.4. Recent Developments
- 16.2.8.5. Financials (Based on Availability)
- 16.2.9 Pioneer Surgical Technologies
- 16.2.9.1. Overview
- 16.2.9.2. Products
- 16.2.9.3. SWOT Analysis
- 16.2.9.4. Recent Developments
- 16.2.9.5. Financials (Based on Availability)
- 16.2.10 ATEC Spine Inc
- 16.2.10.1. Overview
- 16.2.10.2. Products
- 16.2.10.3. SWOT Analysis
- 16.2.10.4. Recent Developments
- 16.2.10.5. Financials (Based on Availability)
- 16.2.11 Invibio Ltd *List Not Exhaustive
- 16.2.11.1. Overview
- 16.2.11.2. Products
- 16.2.11.3. SWOT Analysis
- 16.2.11.4. Recent Developments
- 16.2.11.5. Financials (Based on Availability)
- 16.2.12 NuVasive Inc
- 16.2.12.1. Overview
- 16.2.12.2. Products
- 16.2.12.3. SWOT Analysis
- 16.2.12.4. Recent Developments
- 16.2.12.5. Financials (Based on Availability)
- 16.2.1 Zimmer Holdings Inc
List of Figures
- Figure 1: Global Non Fusion Spinal Devices Industry Revenue Breakdown (Million, %) by Region 2024 & 2032
- Figure 2: North America Non Fusion Spinal Devices Industry Revenue (Million), by Country 2024 & 2032
- Figure 3: North America Non Fusion Spinal Devices Industry Revenue Share (%), by Country 2024 & 2032
- Figure 4: Europe Non Fusion Spinal Devices Industry Revenue (Million), by Country 2024 & 2032
- Figure 5: Europe Non Fusion Spinal Devices Industry Revenue Share (%), by Country 2024 & 2032
- Figure 6: Asia Pacific Non Fusion Spinal Devices Industry Revenue (Million), by Country 2024 & 2032
- Figure 7: Asia Pacific Non Fusion Spinal Devices Industry Revenue Share (%), by Country 2024 & 2032
- Figure 8: Middle East and Africa Non Fusion Spinal Devices Industry Revenue (Million), by Country 2024 & 2032
- Figure 9: Middle East and Africa Non Fusion Spinal Devices Industry Revenue Share (%), by Country 2024 & 2032
- Figure 10: South America Non Fusion Spinal Devices Industry Revenue (Million), by Country 2024 & 2032
- Figure 11: South America Non Fusion Spinal Devices Industry Revenue Share (%), by Country 2024 & 2032
- Figure 12: North America Non Fusion Spinal Devices Industry Revenue (Million), by Product 2024 & 2032
- Figure 13: North America Non Fusion Spinal Devices Industry Revenue Share (%), by Product 2024 & 2032
- Figure 14: North America Non Fusion Spinal Devices Industry Revenue (Million), by End User 2024 & 2032
- Figure 15: North America Non Fusion Spinal Devices Industry Revenue Share (%), by End User 2024 & 2032
- Figure 16: North America Non Fusion Spinal Devices Industry Revenue (Million), by Country 2024 & 2032
- Figure 17: North America Non Fusion Spinal Devices Industry Revenue Share (%), by Country 2024 & 2032
- Figure 18: Europe Non Fusion Spinal Devices Industry Revenue (Million), by Product 2024 & 2032
- Figure 19: Europe Non Fusion Spinal Devices Industry Revenue Share (%), by Product 2024 & 2032
- Figure 20: Europe Non Fusion Spinal Devices Industry Revenue (Million), by End User 2024 & 2032
- Figure 21: Europe Non Fusion Spinal Devices Industry Revenue Share (%), by End User 2024 & 2032
- Figure 22: Europe Non Fusion Spinal Devices Industry Revenue (Million), by Country 2024 & 2032
- Figure 23: Europe Non Fusion Spinal Devices Industry Revenue Share (%), by Country 2024 & 2032
- Figure 24: Asia Pacific Non Fusion Spinal Devices Industry Revenue (Million), by Product 2024 & 2032
- Figure 25: Asia Pacific Non Fusion Spinal Devices Industry Revenue Share (%), by Product 2024 & 2032
- Figure 26: Asia Pacific Non Fusion Spinal Devices Industry Revenue (Million), by End User 2024 & 2032
- Figure 27: Asia Pacific Non Fusion Spinal Devices Industry Revenue Share (%), by End User 2024 & 2032
- Figure 28: Asia Pacific Non Fusion Spinal Devices Industry Revenue (Million), by Country 2024 & 2032
- Figure 29: Asia Pacific Non Fusion Spinal Devices Industry Revenue Share (%), by Country 2024 & 2032
- Figure 30: Middle East and Africa Non Fusion Spinal Devices Industry Revenue (Million), by Product 2024 & 2032
- Figure 31: Middle East and Africa Non Fusion Spinal Devices Industry Revenue Share (%), by Product 2024 & 2032
- Figure 32: Middle East and Africa Non Fusion Spinal Devices Industry Revenue (Million), by End User 2024 & 2032
- Figure 33: Middle East and Africa Non Fusion Spinal Devices Industry Revenue Share (%), by End User 2024 & 2032
- Figure 34: Middle East and Africa Non Fusion Spinal Devices Industry Revenue (Million), by Country 2024 & 2032
- Figure 35: Middle East and Africa Non Fusion Spinal Devices Industry Revenue Share (%), by Country 2024 & 2032
- Figure 36: South America Non Fusion Spinal Devices Industry Revenue (Million), by Product 2024 & 2032
- Figure 37: South America Non Fusion Spinal Devices Industry Revenue Share (%), by Product 2024 & 2032
- Figure 38: South America Non Fusion Spinal Devices Industry Revenue (Million), by End User 2024 & 2032
- Figure 39: South America Non Fusion Spinal Devices Industry Revenue Share (%), by End User 2024 & 2032
- Figure 40: South America Non Fusion Spinal Devices Industry Revenue (Million), by Country 2024 & 2032
- Figure 41: South America Non Fusion Spinal Devices Industry Revenue Share (%), by Country 2024 & 2032
List of Tables
- Table 1: Global Non Fusion Spinal Devices Industry Revenue Million Forecast, by Region 2019 & 2032
- Table 2: Global Non Fusion Spinal Devices Industry Revenue Million Forecast, by Product 2019 & 2032
- Table 3: Global Non Fusion Spinal Devices Industry Revenue Million Forecast, by End User 2019 & 2032
- Table 4: Global Non Fusion Spinal Devices Industry Revenue Million Forecast, by Region 2019 & 2032
- Table 5: Global Non Fusion Spinal Devices Industry Revenue Million Forecast, by Country 2019 & 2032
- Table 6: United States Non Fusion Spinal Devices Industry Revenue (Million) Forecast, by Application 2019 & 2032
- Table 7: Canada Non Fusion Spinal Devices Industry Revenue (Million) Forecast, by Application 2019 & 2032
- Table 8: Mexico Non Fusion Spinal Devices Industry Revenue (Million) Forecast, by Application 2019 & 2032
- Table 9: Global Non Fusion Spinal Devices Industry Revenue Million Forecast, by Country 2019 & 2032
- Table 10: United Kingdom Non Fusion Spinal Devices Industry Revenue (Million) Forecast, by Application 2019 & 2032
- Table 11: Germany Non Fusion Spinal Devices Industry Revenue (Million) Forecast, by Application 2019 & 2032
- Table 12: France Non Fusion Spinal Devices Industry Revenue (Million) Forecast, by Application 2019 & 2032
- Table 13: Italy Non Fusion Spinal Devices Industry Revenue (Million) Forecast, by Application 2019 & 2032
- Table 14: Spain Non Fusion Spinal Devices Industry Revenue (Million) Forecast, by Application 2019 & 2032
- Table 15: Rest of Europe Non Fusion Spinal Devices Industry Revenue (Million) Forecast, by Application 2019 & 2032
- Table 16: Global Non Fusion Spinal Devices Industry Revenue Million Forecast, by Country 2019 & 2032
- Table 17: China Non Fusion Spinal Devices Industry Revenue (Million) Forecast, by Application 2019 & 2032
- Table 18: Japan Non Fusion Spinal Devices Industry Revenue (Million) Forecast, by Application 2019 & 2032
- Table 19: India Non Fusion Spinal Devices Industry Revenue (Million) Forecast, by Application 2019 & 2032
- Table 20: Australia Non Fusion Spinal Devices Industry Revenue (Million) Forecast, by Application 2019 & 2032
- Table 21: South Korea Non Fusion Spinal Devices Industry Revenue (Million) Forecast, by Application 2019 & 2032
- Table 22: Rest of Asia Pacific Non Fusion Spinal Devices Industry Revenue (Million) Forecast, by Application 2019 & 2032
- Table 23: Global Non Fusion Spinal Devices Industry Revenue Million Forecast, by Country 2019 & 2032
- Table 24: GCC Non Fusion Spinal Devices Industry Revenue (Million) Forecast, by Application 2019 & 2032
- Table 25: South Africa Non Fusion Spinal Devices Industry Revenue (Million) Forecast, by Application 2019 & 2032
- Table 26: Rest of Middle East and Africa Non Fusion Spinal Devices Industry Revenue (Million) Forecast, by Application 2019 & 2032
- Table 27: Global Non Fusion Spinal Devices Industry Revenue Million Forecast, by Country 2019 & 2032
- Table 28: Brazil Non Fusion Spinal Devices Industry Revenue (Million) Forecast, by Application 2019 & 2032
- Table 29: Argentina Non Fusion Spinal Devices Industry Revenue (Million) Forecast, by Application 2019 & 2032
- Table 30: Rest of South America Non Fusion Spinal Devices Industry Revenue (Million) Forecast, by Application 2019 & 2032
- Table 31: Global Non Fusion Spinal Devices Industry Revenue Million Forecast, by Product 2019 & 2032
- Table 32: Global Non Fusion Spinal Devices Industry Revenue Million Forecast, by End User 2019 & 2032
- Table 33: Global Non Fusion Spinal Devices Industry Revenue Million Forecast, by Country 2019 & 2032
- Table 34: United States Non Fusion Spinal Devices Industry Revenue (Million) Forecast, by Application 2019 & 2032
- Table 35: Canada Non Fusion Spinal Devices Industry Revenue (Million) Forecast, by Application 2019 & 2032
- Table 36: Mexico Non Fusion Spinal Devices Industry Revenue (Million) Forecast, by Application 2019 & 2032
- Table 37: Global Non Fusion Spinal Devices Industry Revenue Million Forecast, by Product 2019 & 2032
- Table 38: Global Non Fusion Spinal Devices Industry Revenue Million Forecast, by End User 2019 & 2032
- Table 39: Global Non Fusion Spinal Devices Industry Revenue Million Forecast, by Country 2019 & 2032
- Table 40: United Kingdom Non Fusion Spinal Devices Industry Revenue (Million) Forecast, by Application 2019 & 2032
- Table 41: Germany Non Fusion Spinal Devices Industry Revenue (Million) Forecast, by Application 2019 & 2032
- Table 42: France Non Fusion Spinal Devices Industry Revenue (Million) Forecast, by Application 2019 & 2032
- Table 43: Italy Non Fusion Spinal Devices Industry Revenue (Million) Forecast, by Application 2019 & 2032
- Table 44: Spain Non Fusion Spinal Devices Industry Revenue (Million) Forecast, by Application 2019 & 2032
- Table 45: Rest of Europe Non Fusion Spinal Devices Industry Revenue (Million) Forecast, by Application 2019 & 2032
- Table 46: Global Non Fusion Spinal Devices Industry Revenue Million Forecast, by Product 2019 & 2032
- Table 47: Global Non Fusion Spinal Devices Industry Revenue Million Forecast, by End User 2019 & 2032
- Table 48: Global Non Fusion Spinal Devices Industry Revenue Million Forecast, by Country 2019 & 2032
- Table 49: China Non Fusion Spinal Devices Industry Revenue (Million) Forecast, by Application 2019 & 2032
- Table 50: Japan Non Fusion Spinal Devices Industry Revenue (Million) Forecast, by Application 2019 & 2032
- Table 51: India Non Fusion Spinal Devices Industry Revenue (Million) Forecast, by Application 2019 & 2032
- Table 52: Australia Non Fusion Spinal Devices Industry Revenue (Million) Forecast, by Application 2019 & 2032
- Table 53: South Korea Non Fusion Spinal Devices Industry Revenue (Million) Forecast, by Application 2019 & 2032
- Table 54: Rest of Asia Pacific Non Fusion Spinal Devices Industry Revenue (Million) Forecast, by Application 2019 & 2032
- Table 55: Global Non Fusion Spinal Devices Industry Revenue Million Forecast, by Product 2019 & 2032
- Table 56: Global Non Fusion Spinal Devices Industry Revenue Million Forecast, by End User 2019 & 2032
- Table 57: Global Non Fusion Spinal Devices Industry Revenue Million Forecast, by Country 2019 & 2032
- Table 58: GCC Non Fusion Spinal Devices Industry Revenue (Million) Forecast, by Application 2019 & 2032
- Table 59: South Africa Non Fusion Spinal Devices Industry Revenue (Million) Forecast, by Application 2019 & 2032
- Table 60: Rest of Middle East and Africa Non Fusion Spinal Devices Industry Revenue (Million) Forecast, by Application 2019 & 2032
- Table 61: Global Non Fusion Spinal Devices Industry Revenue Million Forecast, by Product 2019 & 2032
- Table 62: Global Non Fusion Spinal Devices Industry Revenue Million Forecast, by End User 2019 & 2032
- Table 63: Global Non Fusion Spinal Devices Industry Revenue Million Forecast, by Country 2019 & 2032
- Table 64: Brazil Non Fusion Spinal Devices Industry Revenue (Million) Forecast, by Application 2019 & 2032
- Table 65: Argentina Non Fusion Spinal Devices Industry Revenue (Million) Forecast, by Application 2019 & 2032
- Table 66: Rest of South America Non Fusion Spinal Devices Industry Revenue (Million) Forecast, by Application 2019 & 2032
Frequently Asked Questions
1. What is the projected Compound Annual Growth Rate (CAGR) of the Non Fusion Spinal Devices Industry?
The projected CAGR is approximately 6.80%.
2. Which companies are prominent players in the Non Fusion Spinal Devices Industry?
Key companies in the market include Zimmer Holdings Inc, Paradigm Spine LLC, Centinel Spine LLC, RTI Surgical Holdings Inc, Medtronic PLC, Johnson & Johnson, Stryker Corporation, B Braun Melsungen, Pioneer Surgical Technologies, ATEC Spine Inc, Invibio Ltd *List Not Exhaustive, NuVasive Inc.
3. What are the main segments of the Non Fusion Spinal Devices Industry?
The market segments include Product, End User.
4. Can you provide details about the market size?
The market size is estimated to be USD XX Million as of 2022.
5. What are some drivers contributing to market growth?
Increasing Cases of Degenerative Disc Disease (DDD); Acceptance of Minimally Invasive Surgeries such as Disc Arthroscopy; Advantages over Spinal Fusion Surgeries.
6. What are the notable trends driving market growth?
Dynamic Stabilization Devices Segment Captured the Largest Market Share.
7. Are there any restraints impacting market growth?
Reimbursement Challenges; Availability of Alternatives.
8. Can you provide examples of recent developments in the market?
In February 2021, NuVasive acquired Simplify Medical, a privately held company and developer of the Simplify Cervical Artificial Disc for cervical total disc replacement (cTDR).
9. What pricing options are available for accessing the report?
Pricing options include single-user, multi-user, and enterprise licenses priced at USD 4750, USD 5250, and USD 8750 respectively.
10. Is the market size provided in terms of value or volume?
The market size is provided in terms of value, measured in Million.
11. Are there any specific market keywords associated with the report?
Yes, the market keyword associated with the report is "Non Fusion Spinal Devices Industry," which aids in identifying and referencing the specific market segment covered.
12. How do I determine which pricing option suits my needs best?
The pricing options vary based on user requirements and access needs. Individual users may opt for single-user licenses, while businesses requiring broader access may choose multi-user or enterprise licenses for cost-effective access to the report.
13. Are there any additional resources or data provided in the Non Fusion Spinal Devices Industry report?
While the report offers comprehensive insights, it's advisable to review the specific contents or supplementary materials provided to ascertain if additional resources or data are available.
14. How can I stay updated on further developments or reports in the Non Fusion Spinal Devices Industry?
To stay informed about further developments, trends, and reports in the Non Fusion Spinal Devices Industry, consider subscribing to industry newsletters, following relevant companies and organizations, or regularly checking reputable industry news sources and publications.
Methodology
Step 1 - Identification of Relevant Samples Size from Population Database


Step 2 - Approaches for Defining Global Market Size (Value, Volume* & Price*)

Note*: In applicable scenarios
Step 3 - Data Sources
Primary Research
- Web Analytics
- Survey Reports
- Research Institute
- Latest Research Reports
- Opinion Leaders
Secondary Research
- Annual Reports
- White Paper
- Latest Press Release
- Industry Association
- Paid Database
- Investor Presentations

Step 4 - Data Triangulation
Involves using different sources of information in order to increase the validity of a study
These sources are likely to be stakeholders in a program - participants, other researchers, program staff, other community members, and so on.
Then we put all data in single framework & apply various statistical tools to find out the dynamic on the market.
During the analysis stage, feedback from the stakeholder groups would be compared to determine areas of agreement as well as areas of divergence
