

Key Insights
The global Bromobenzene market is poised for robust growth, with an estimated market size of $1.4 billion in 2024, projecting a Compound Annual Growth Rate (CAGR) of 4.4% through 2033. This expansion is driven by the increasing demand for bromobenzene as a crucial Grignard reagent in organic synthesis, particularly within the pharmaceutical and agrochemical sectors. Its utility as a versatile chemical intermediate for producing a wide array of specialty chemicals, dyes, and flame retardants further fuels market momentum. The expanding research and development activities in these industries, coupled with a growing emphasis on novel drug discovery and advanced material development, are creating significant opportunities for bromobenzene consumption. Furthermore, the solvent applications of bromobenzene, though a smaller segment, are also contributing to its sustained demand.
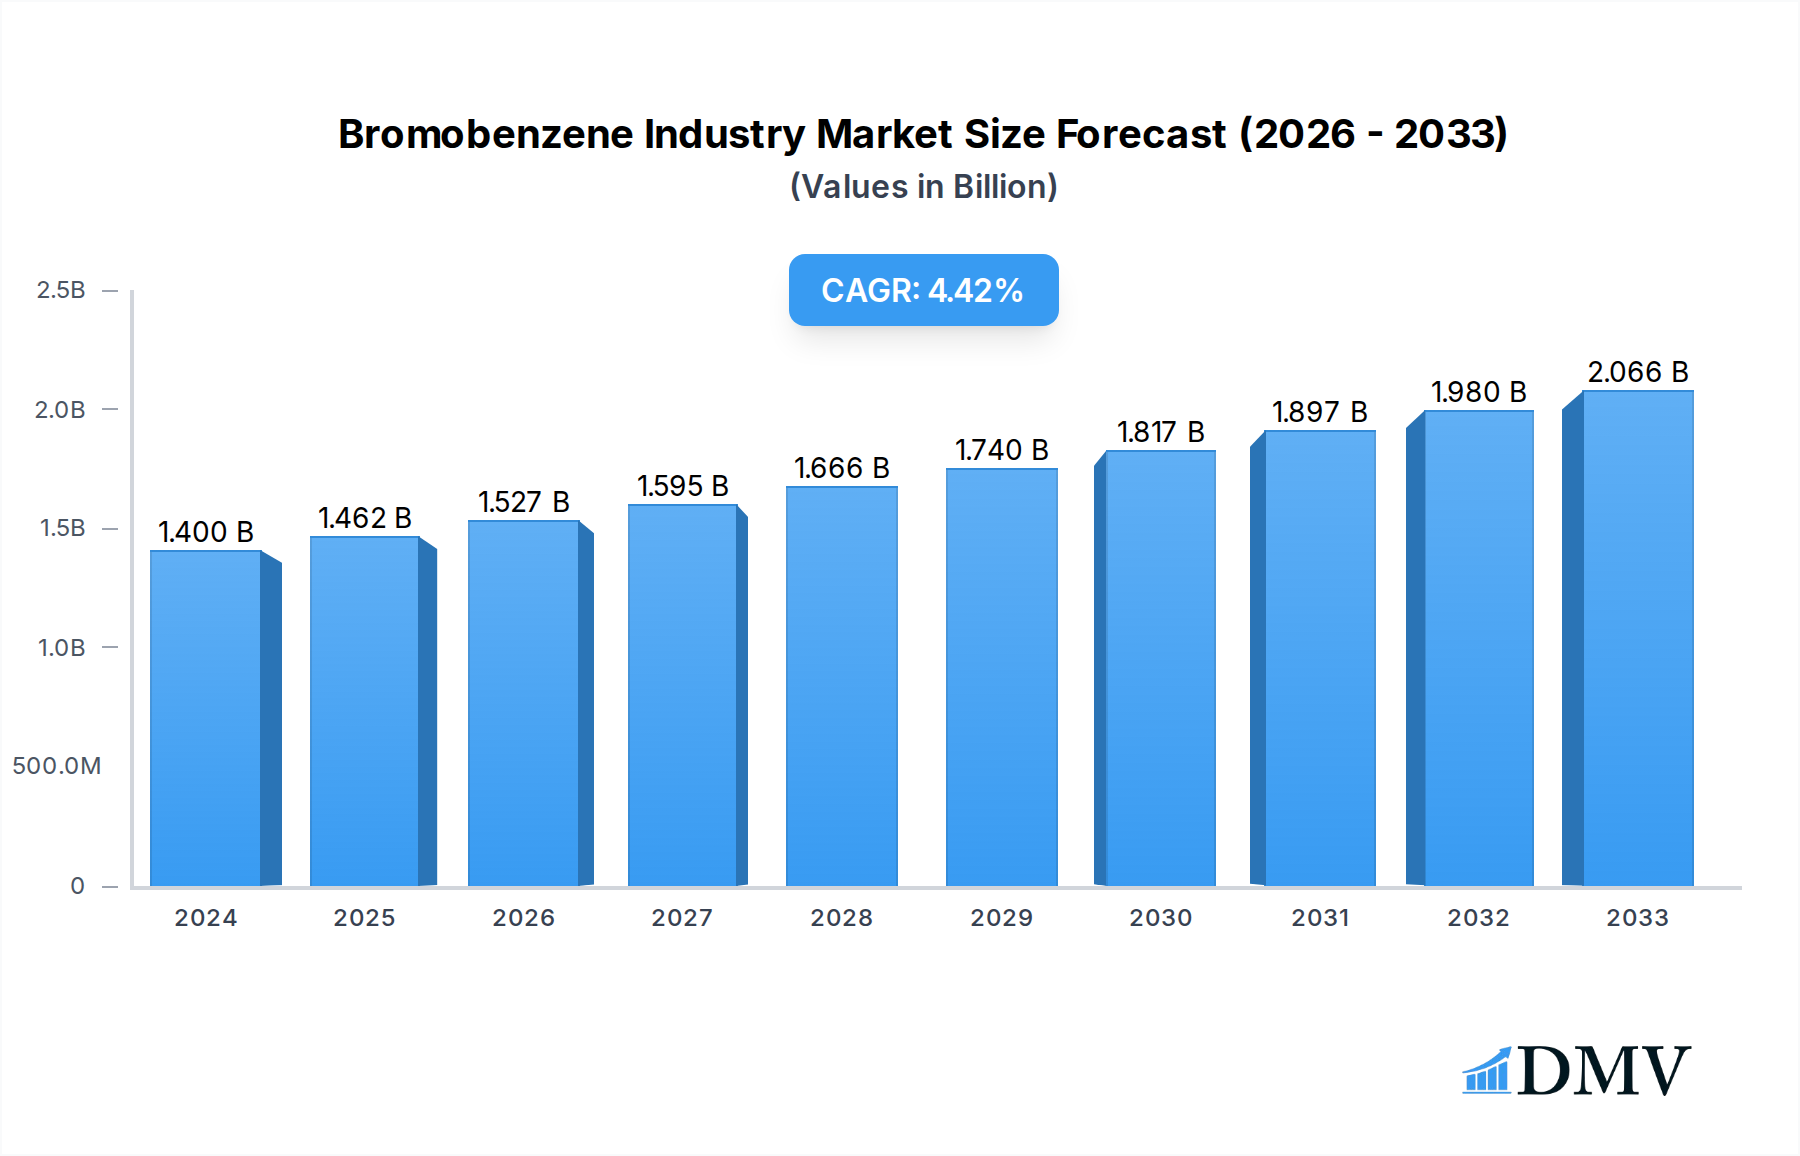
Bromobenzene Industry Market Size (In Billion)
Several key trends are shaping the bromobenzene landscape. The development of more efficient and environmentally friendly synthesis processes for bromobenzene is a notable trend, driven by stringent regulatory requirements and a growing focus on sustainable chemical manufacturing. Geographically, the Asia Pacific region, led by China and India, is emerging as a dominant force due to its rapidly expanding industrial base, burgeoning pharmaceutical manufacturing capabilities, and increasing investments in chemical R&D. North America and Europe, with their well-established chemical industries and advanced research infrastructure, continue to be significant markets. However, challenges such as the volatility in raw material prices and the increasing scrutiny over the environmental impact of certain chemical processes present potential restraints that market players will need to navigate effectively.

Bromobenzene Industry Company Market Share
Bromobenzene Industry Market Composition & Trends
The global Bromobenzene industry is characterized by a moderately concentrated market, with key players like Merck KGaA, Exxon Mobil Corporation, and Tokyo Chemical Industry Co Ltd holding significant market share. Innovation is primarily driven by advancements in synthesis techniques and the discovery of novel applications, particularly in the pharmaceutical and agrochemical sectors. The regulatory landscape is evolving, with increasing scrutiny on chemical production processes and environmental impact, influencing manufacturing standards and product development. Substitute products, while present, often lack the specific reactivity and cost-effectiveness of bromobenzene for critical applications, particularly as a precursor for Grignard reagents. End-user profiles are diverse, ranging from large-scale chemical manufacturers to specialized research laboratories. Merger and acquisition (M&A) activities are expected to remain strategic, focusing on market consolidation and expansion into high-growth application areas. The total market value is projected to reach USD 9.8 billion by 2033, with a compound annual growth rate (CAGR) of 5.2% from 2025 to 2033. M&A deal values are estimated to aggregate USD 1.2 billion over the forecast period.
- Market Concentration: Moderate, with top companies dominating production.
- Innovation Catalysts: Synthesis efficiency, novel chemical intermediates, and pharmaceutical applications.
- Regulatory Landscape: Increasing environmental and safety compliance.
- Substitute Products: Limited in terms of reactivity and cost for key uses.
- End-User Profiles: Pharmaceutical, agrochemical, research, and specialty chemical sectors.
- M&A Activities: Strategic consolidation and technology acquisition.
- Market Share Distribution (2025): Merck KGaA (12.5%), Exxon Mobil Corporation (10.2%), Tokyo Chemical Industry Co Ltd (9.8%), Weifang Yonhop Chemical Co Ltd (7.1%), Heranba Industries Ltd (6.5%), Alpha Aesar (5.9%), ChemSampCo Inc (5.2%), Shanghai Wescco Chemical Co Ltd (4.8%), SONTARA ORGANO INDUSTRIES (4.1%), Shandong Henglian Chemical Co Ltd (3.9%), Hawks Chemical Company (3.5%), Others (27.5%).
Bromobenzene Industry Industry Evolution
The bromobenzene industry has witnessed a consistent upward trajectory in market growth over the historical period of 2019–2024, driven by its indispensable role as a foundational chemical intermediate and reagent. The estimated market value in the base year of 2025 stands at USD 6.7 billion, reflecting a healthy CAGR of 5.2% anticipated for the forecast period of 2025–2033. Technological advancements have played a pivotal role in shaping this evolution. Innovations in greener synthesis routes, such as the development of more efficient catalytic processes for bromination, have not only improved yield and reduced waste but also addressed growing environmental concerns. This focus on sustainability is a significant trend that will continue to define the industry's progress. Furthermore, advancements in purification techniques have led to higher purity bromobenzene grades, essential for demanding applications in the pharmaceutical sector, particularly for the synthesis of active pharmaceutical ingredients (APIs). The adoption of these advanced manufacturing processes is a key metric, with an estimated 85% of leading manufacturers now employing sophisticated process control systems to ensure consistent quality and safety. Consumer demand has also shifted, with an increasing emphasis on high-purity chemicals and a preference for suppliers with robust environmental, social, and governance (ESG) credentials. This has spurred greater investment in research and development to meet these evolving expectations. The market's growth has been further bolstered by the increasing complexity of molecules being synthesized in the pharmaceutical and agrochemical industries, where bromobenzene serves as a crucial building block. For instance, the demand for novel crop protection agents and advanced medicinal compounds directly translates into a higher requirement for bromobenzene. Historical data indicates a steady increase in the utilization of bromobenzene in pharmaceutical synthesis, with a 7.8% year-over-year growth observed in this segment during the historical period. The increasing global population and rising healthcare expenditures further fuel the demand for pharmaceuticals, consequently benefiting the bromobenzene market. The industry's evolution is therefore a story of technological adaptation, growing environmental consciousness, and a direct correlation with the progress in life sciences and agriculture.
Leading Regions, Countries, or Segments in Bromobenzene Industry
The Bromobenzene industry's dominance is significantly shaped by key regions, countries, and product segments, with Asia Pacific emerging as the leading market. This region's supremacy is underpinned by a robust chemical manufacturing infrastructure, burgeoning pharmaceutical and agrochemical industries, and favorable government policies promoting industrial growth. Countries like China and India are major production hubs, benefiting from lower manufacturing costs and a large domestic market. The product segment of Phenylmagnesium Bromide is also a critical driver of growth, owing to its widespread application as a Grignard reagent in organic synthesis, particularly in the pharmaceutical industry for the creation of complex molecules and active pharmaceutical ingredients (APIs).
Dominant Region: Asia Pacific
- Key Drivers:
- Strong Manufacturing Base: Extensive chemical production facilities in China and India.
- Growing Pharmaceutical & Agrochemical Sectors: High demand for intermediates and reagents.
- Favorable Government Policies: Incentives for chemical manufacturing and R&D.
- Cost-Effectiveness: Competitive production costs attract global investment.
- Expanding Domestic Consumption: Large and growing populations drive demand for end products.
- Investment Trends: Significant foreign direct investment in chemical manufacturing.
- Regulatory Support: Initiatives to streamline approvals and promote industrial zones.
- In-depth Analysis: Asia Pacific's dominance is a multifaceted phenomenon. China, in particular, has become the world's largest producer of many chemicals, including bromobenzene, due to its vast industrial capacity and government support for the chemical sector. India is also a significant player, with a rapidly expanding pharmaceutical industry that requires substantial quantities of bromobenzene for API synthesis. The agrochemical sector in both countries is also a major consumer, driven by the need to enhance crop yields and protect against pests and diseases. The availability of skilled labor and a robust supply chain network further solidify Asia Pacific's leading position.
- Key Drivers:
Dominant Product Segment: Phenylmagnesium Bromide
- Key Drivers:
- Versatile Grignard Reagent: Essential for carbon-carbon bond formation.
- Pharmaceutical Synthesis: Crucial for complex API manufacturing.
- Agrochemical Production: Used in the synthesis of pesticides and herbicides.
- Research & Development: Widely employed in academic and industrial labs.
- High Purity Requirements: Demand for pharmaceutical-grade reagents.
- Technological Advancements: Improved synthesis of Phenylmagnesium Bromide.
- In-depth Analysis: Phenylmagnesium Bromide is the cornerstone of many organic synthesis pathways. Its ability to form new carbon-carbon bonds makes it indispensable in the creation of intricate molecular structures. The pharmaceutical industry's relentless pursuit of new drugs and therapies directly fuels the demand for high-purity Phenylmagnesium Bromide. Similarly, the agrochemical sector relies on it for the development of effective and targeted crop protection chemicals. The market value for Phenylmagnesium Bromide is estimated to reach USD 4.2 billion by 2033, with a CAGR of 5.5% from 2025–2033.
- Key Drivers:
Dominant Application: Grignard Reagent
- Key Drivers:
- Fundamental Organic Synthesis Tool: Widely taught and utilized in chemistry.
- Enables Complex Molecule Construction: Critical for pharmaceuticals and fine chemicals.
- Versatility in Reactions: Formation of alcohols, carboxylic acids, and ketones.
- Growing Demand for Specialty Chemicals: Drives Grignard reagent usage.
- In-depth Analysis: As a Grignard reagent, bromobenzene is a workhorse in synthetic organic chemistry. Its reactivity and the relative ease with which it can be handled (compared to some other organometallic reagents) make it a preferred choice for a wide array of transformations. The continued innovation in drug discovery and material science necessitates the synthesis of increasingly complex organic molecules, thereby sustaining and growing the demand for bromobenzene as a Grignard reagent.
- Key Drivers:
Bromobenzene Industry Product Innovations
Product innovation in the bromobenzene industry is largely centered on enhancing synthesis efficiency and developing higher purity grades. Novel catalytic systems are being explored to improve yields and reduce by-product formation, leading to more sustainable and cost-effective production. Advanced purification techniques are yielding ultra-high purity bromobenzene, critical for sensitive applications in pharmaceuticals and advanced electronics. For instance, developments in fractional distillation and chromatography have enabled the production of bromobenzene with purity levels exceeding 99.9%, meeting stringent industry standards and enabling breakthroughs in drug development where even trace impurities can have significant implications. These innovations directly translate to improved performance in end-use applications, such as more efficient Grignard reactions and cleaner synthesis of complex organic molecules.
Propelling Factors for Bromobenzene Industry Growth
The bromobenzene industry's growth is propelled by several key factors. The burgeoning pharmaceutical sector, driven by an aging global population and increased healthcare spending, necessitates a steady supply of bromobenzene as a crucial intermediate for API synthesis. Similarly, the demand for advanced agrochemicals to ensure food security for a growing world population directly fuels its consumption. Technological advancements in synthetic chemistry, leading to more efficient and cost-effective production methods for bromobenzene and its derivatives, are also significant growth drivers. Furthermore, ongoing research into novel applications in materials science and specialty chemicals continues to expand the market's reach. The projected market growth of 5.2% CAGR underscores the robust demand and innovation within the industry.
Obstacles in the Bromobenzene Industry Market
Despite its growth, the bromobenzene industry faces several obstacles. Stringent environmental regulations concerning the production and handling of halogenated organic compounds can increase compliance costs and necessitate significant investment in cleaner technologies. Fluctuations in raw material prices, particularly for bromine, can impact production costs and profit margins. Furthermore, the potential for supply chain disruptions, as witnessed in recent global events, poses a risk to consistent product availability. Competition from alternative synthesis routes or substitute chemicals, although currently limited for critical applications, remains a factor to monitor. The estimated impact of regulatory compliance on production costs is an average increase of 3-5%.
Future Opportunities in Bromobenzene Industry
The bromobenzene industry is poised for significant future opportunities. The increasing complexity of pharmaceutical molecules being developed presents a continuous demand for specialized chemical intermediates like bromobenzene. The growing focus on sustainable chemistry is driving innovation in greener production methods, opening avenues for companies investing in eco-friendly technologies. Emerging markets in developing economies, with their expanding healthcare and agricultural sectors, offer substantial growth potential. Furthermore, the exploration of bromobenzene derivatives in novel applications, such as advanced polymers and electronic materials, could unlock new revenue streams and market segments. The development of bio-based bromobenzene production methods is also an emerging opportunity.
Major Players in the Bromobenzene Industry Ecosystem
- Merck KGaA
- Exxon Mobil Corporation
- Tokyo Chemical Industry Co Ltd
- Weifang Yonhop Chemical Co Ltd
- Heranba Industries Ltd
- Alpha Aesar
- ChemSampCo Inc
- Shanghai Wescco Chemical Co Ltd
- SONTARA ORGANO INDUSTRIES
- Shandong Henglian Chemical Co Ltd
- Hawks Chemical Company
Key Developments in Bromobenzene Industry Industry
- 2023: Launch of a new, highly efficient catalytic process for bromobenzene synthesis by a leading European chemical manufacturer, aiming to reduce energy consumption by 15%.
- 2024 (Q1): Acquisition of a specialty chemical producer focused on brominated intermediates by a major North American player, expanding its product portfolio and market reach.
- 2024 (Q2): Introduction of ultra-high purity bromobenzene grades by a Japanese chemical company, targeting the advanced pharmaceutical synthesis market.
- 2024 (Q3): Significant investment by an Indian chemical firm in expanding its bromobenzene production capacity to meet the growing domestic and export demand.
- 2024 (Q4): Collaborative research agreement established between a university and a global chemical conglomerate to explore novel applications of bromobenzene derivatives in material science.
Strategic Bromobenzene Industry Market Forecast
The strategic outlook for the bromobenzene industry is one of sustained and robust growth, driven by innovation and expanding end-user markets. The increasing demand from the pharmaceutical and agrochemical sectors, coupled with advancements in green chemistry and synthesis technologies, will continue to fuel market expansion. Emerging applications in materials science and specialty chemicals present significant avenues for diversification and revenue generation. Companies that focus on high-purity product offerings, sustainable manufacturing practices, and strategic expansions into high-growth regions are well-positioned to capitalize on the projected 5.2% CAGR. The market is expected to reach USD 9.8 billion by 2033, reflecting a promising future for this vital chemical intermediate.
Bromobenzene Industry Segmentation
-
1. Product
- 1.1. Phenylmagnesium Bromide
- 1.2. Phencyclidine
- 1.3. Other Products
-
2. Application
- 2.1. Grignard Reagent
- 2.2. Solvent
- 2.3. Chemical Intermediate
- 2.4. Other Applications
Bromobenzene Industry Segmentation By Geography
-
1. Asia Pacific
- 1.1. China
- 1.2. India
- 1.3. Japan
- 1.4. South Korea
- 1.5. Rest of Asia Pacific
-
2. North America
- 2.1. United States
- 2.2. Canada
- 2.3. Rest of the North America
-
3. Europe
- 3.1. Germany
- 3.2. France
- 3.3. United Kingdom
- 3.4. Italy
- 3.5. Rest of the Europe
-
4. Rest of the World
- 4.1. South America
- 4.2. Middle East and Africa
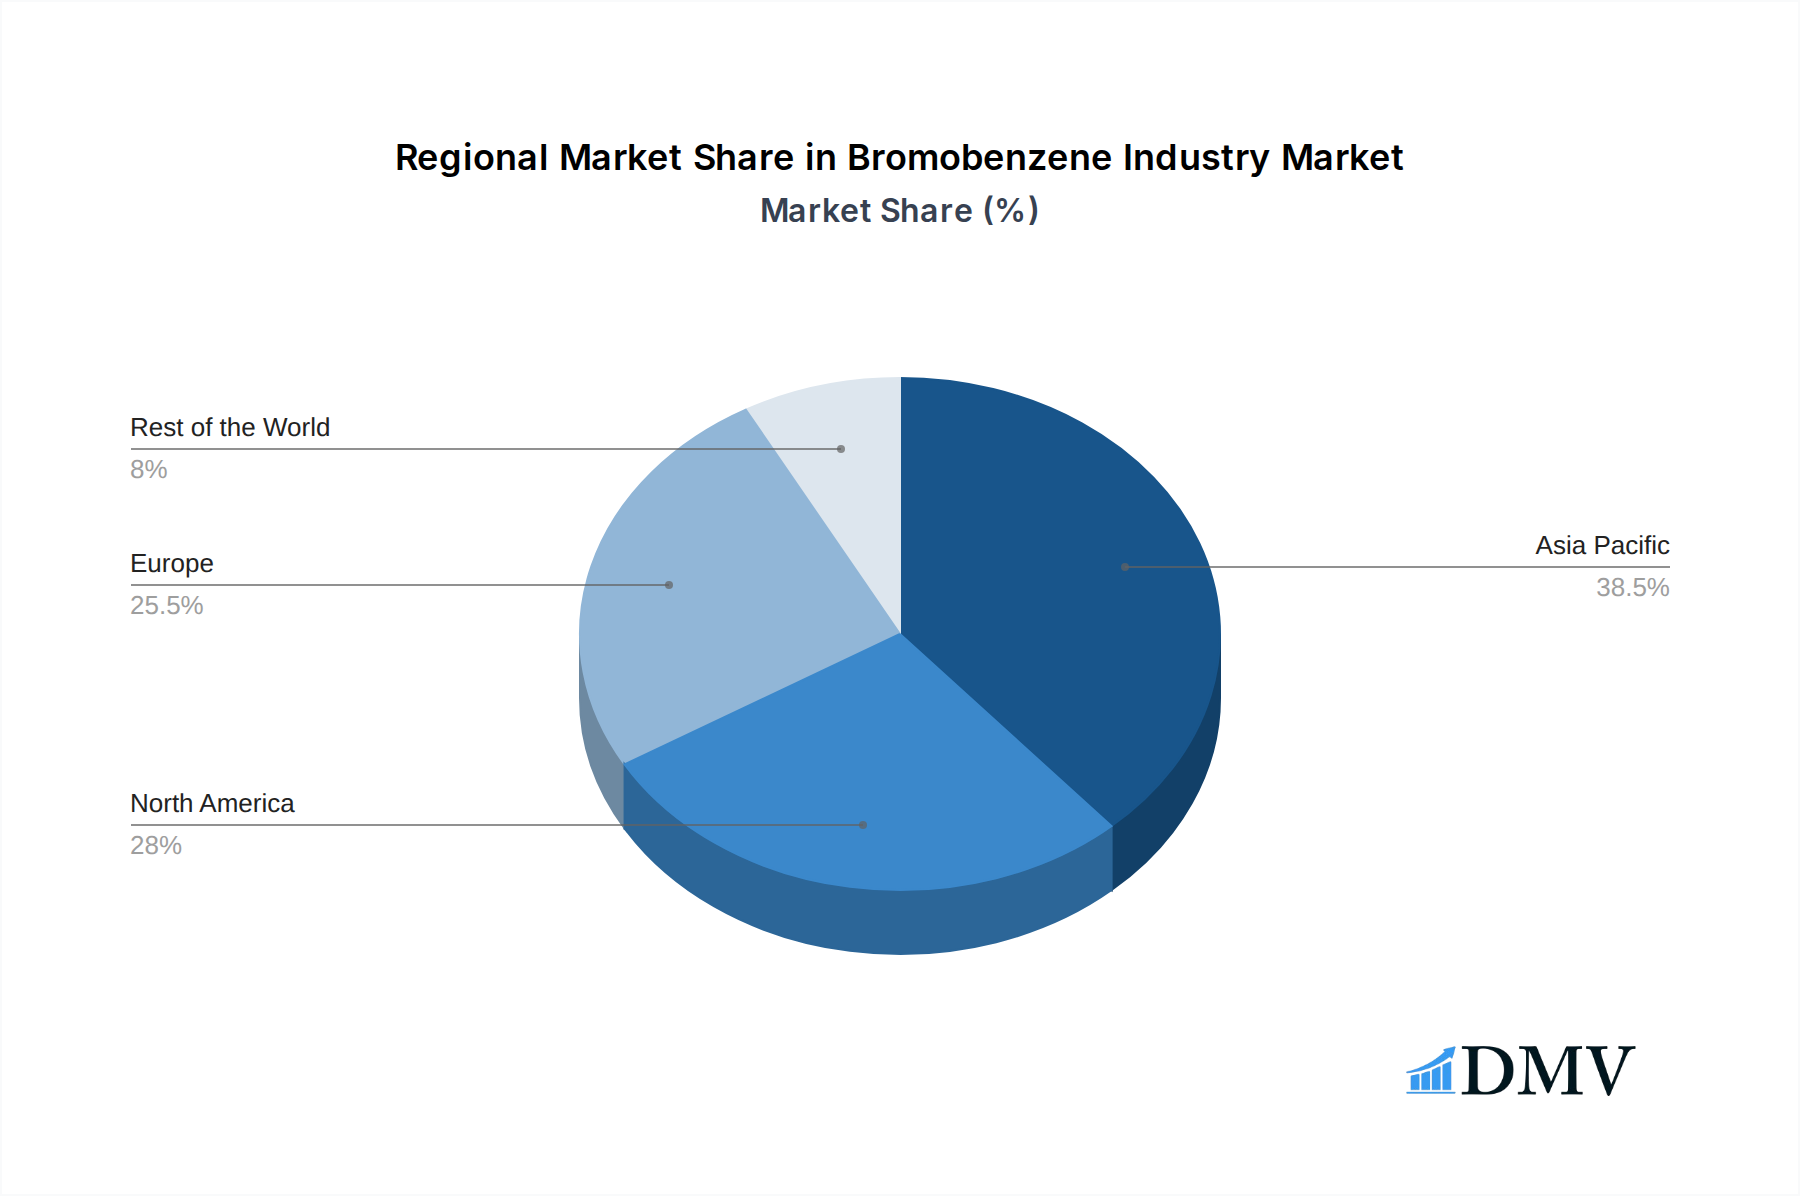
Bromobenzene Industry Regional Market Share
Geographic Coverage of Bromobenzene Industry
Bromobenzene Industry REPORT HIGHLIGHTS
| Aspects | Details |
|---|---|
| Study Period | 2020-2034 |
| Base Year | 2025 |
| Estimated Year | 2026 |
| Forecast Period | 2026-2034 |
| Historical Period | 2020-2025 |
| Growth Rate | CAGR of 4.4% from 2020-2034 |
| Segmentation |
|
Table of Contents
- 1. Introduction
- 1.1. Research Scope
- 1.2. Market Segmentation
- 1.3. Research Objective
- 1.4. Definitions and Assumptions
- 2. Executive Summary
- 2.1. Market Snapshot
- 3. Market Dynamics
- 3.1. Market Drivers
- 3.2. Market Restrains
- 3.3. Market Trends
- 3.4. Market Opportunities
- 4. Market Factor Analysis
- 4.1. Porters Five Forces
- 4.1.1. Bargaining Power of Suppliers
- 4.1.2. Bargaining Power of Buyers
- 4.1.3. Threat of New Entrants
- 4.1.4. Threat of Substitutes
- 4.1.5. Competitive Rivalry
- 4.2. PESTEL analysis
- 4.3. BCG Analysis
- 4.3.1. Stars (High Growth, High Market Share)
- 4.3.2. Cash Cows (Low Growth, High Market Share)
- 4.3.3. Question Mark (High Growth, Low Market Share)
- 4.3.4. Dogs (Low Growth, Low Market Share)
- 4.4. Ansoff Matrix Analysis
- 4.5. Supply Chain Analysis
- 4.6. Regulatory Landscape
- 4.7. Current Market Potential and Opportunity Assessment (TAM–SAM–SOM Framework)
- 4.8. DMV Analyst Note
- 4.1. Porters Five Forces
- 5. Market Analysis, Insights and Forecast 2021-2033
- 5.1. Market Analysis, Insights and Forecast - by Product
- 5.1.1. Phenylmagnesium Bromide
- 5.1.2. Phencyclidine
- 5.1.3. Other Products
- 5.2. Market Analysis, Insights and Forecast - by Application
- 5.2.1. Grignard Reagent
- 5.2.2. Solvent
- 5.2.3. Chemical Intermediate
- 5.2.4. Other Applications
- 5.3. Market Analysis, Insights and Forecast - by Region
- 5.3.1. Asia Pacific
- 5.3.2. North America
- 5.3.3. Europe
- 5.3.4. Rest of the World
- 5.1. Market Analysis, Insights and Forecast - by Product
- 6. Global Bromobenzene Industry Analysis, Insights and Forecast, 2021-2033
- 6.1. Market Analysis, Insights and Forecast - by Product
- 6.1.1. Phenylmagnesium Bromide
- 6.1.2. Phencyclidine
- 6.1.3. Other Products
- 6.2. Market Analysis, Insights and Forecast - by Application
- 6.2.1. Grignard Reagent
- 6.2.2. Solvent
- 6.2.3. Chemical Intermediate
- 6.2.4. Other Applications
- 6.1. Market Analysis, Insights and Forecast - by Product
- 7. Asia Pacific Bromobenzene Industry Analysis, Insights and Forecast, 2020-2032
- 7.1. Market Analysis, Insights and Forecast - by Product
- 7.1.1. Phenylmagnesium Bromide
- 7.1.2. Phencyclidine
- 7.1.3. Other Products
- 7.2. Market Analysis, Insights and Forecast - by Application
- 7.2.1. Grignard Reagent
- 7.2.2. Solvent
- 7.2.3. Chemical Intermediate
- 7.2.4. Other Applications
- 7.1. Market Analysis, Insights and Forecast - by Product
- 8. North America Bromobenzene Industry Analysis, Insights and Forecast, 2020-2032
- 8.1. Market Analysis, Insights and Forecast - by Product
- 8.1.1. Phenylmagnesium Bromide
- 8.1.2. Phencyclidine
- 8.1.3. Other Products
- 8.2. Market Analysis, Insights and Forecast - by Application
- 8.2.1. Grignard Reagent
- 8.2.2. Solvent
- 8.2.3. Chemical Intermediate
- 8.2.4. Other Applications
- 8.1. Market Analysis, Insights and Forecast - by Product
- 9. Europe Bromobenzene Industry Analysis, Insights and Forecast, 2020-2032
- 9.1. Market Analysis, Insights and Forecast - by Product
- 9.1.1. Phenylmagnesium Bromide
- 9.1.2. Phencyclidine
- 9.1.3. Other Products
- 9.2. Market Analysis, Insights and Forecast - by Application
- 9.2.1. Grignard Reagent
- 9.2.2. Solvent
- 9.2.3. Chemical Intermediate
- 9.2.4. Other Applications
- 9.1. Market Analysis, Insights and Forecast - by Product
- 10. Rest of the World Bromobenzene Industry Analysis, Insights and Forecast, 2020-2032
- 10.1. Market Analysis, Insights and Forecast - by Product
- 10.1.1. Phenylmagnesium Bromide
- 10.1.2. Phencyclidine
- 10.1.3. Other Products
- 10.2. Market Analysis, Insights and Forecast - by Application
- 10.2.1. Grignard Reagent
- 10.2.2. Solvent
- 10.2.3. Chemical Intermediate
- 10.2.4. Other Applications
- 10.1. Market Analysis, Insights and Forecast - by Product
- 11. Competitive Analysis
- 11.1. Company Profiles
- 11.1.1 Merck KGaA
- 11.1.1.1. Company Overview
- 11.1.1.2. Products
- 11.1.1.3. Company Financials
- 11.1.1.4. SWOT Analysis
- 11.1.2 Exxon Mobil Corporation
- 11.1.2.1. Company Overview
- 11.1.2.2. Products
- 11.1.2.3. Company Financials
- 11.1.2.4. SWOT Analysis
- 11.1.3 Tokyo Chemical Industry Co Ltd
- 11.1.3.1. Company Overview
- 11.1.3.2. Products
- 11.1.3.3. Company Financials
- 11.1.3.4. SWOT Analysis
- 11.1.4 Weifang Yonhop Chemical Co Ltd
- 11.1.4.1. Company Overview
- 11.1.4.2. Products
- 11.1.4.3. Company Financials
- 11.1.4.4. SWOT Analysis
- 11.1.5 Heranba Industries Ltd
- 11.1.5.1. Company Overview
- 11.1.5.2. Products
- 11.1.5.3. Company Financials
- 11.1.5.4. SWOT Analysis
- 11.1.6 Alpha Aesar
- 11.1.6.1. Company Overview
- 11.1.6.2. Products
- 11.1.6.3. Company Financials
- 11.1.6.4. SWOT Analysis
- 11.1.7 ChemSampCo Inc
- 11.1.7.1. Company Overview
- 11.1.7.2. Products
- 11.1.7.3. Company Financials
- 11.1.7.4. SWOT Analysis
- 11.1.8 Shanghai Wescco Chemical Co Ltd
- 11.1.8.1. Company Overview
- 11.1.8.2. Products
- 11.1.8.3. Company Financials
- 11.1.8.4. SWOT Analysis
- 11.1.9 SONTARA ORGANO INDUSTRIES
- 11.1.9.1. Company Overview
- 11.1.9.2. Products
- 11.1.9.3. Company Financials
- 11.1.9.4. SWOT Analysis
- 11.1.10 Shandong Henglian Chemical Co Ltd
- 11.1.10.1. Company Overview
- 11.1.10.2. Products
- 11.1.10.3. Company Financials
- 11.1.10.4. SWOT Analysis
- 11.1.11 Hawks Chemical Company
- 11.1.11.1. Company Overview
- 11.1.11.2. Products
- 11.1.11.3. Company Financials
- 11.1.11.4. SWOT Analysis
- 11.1.1 Merck KGaA
- 11.2. Market Entropy
- 11.2.1 Company's Key Areas Served
- 11.2.2 Recent Developments
- 11.3. Company Market Share Analysis 2025
- 11.3.1 Top 5 Companies Market Share Analysis
- 11.3.2 Top 3 Companies Market Share Analysis
- 11.4. List of Potential Customers
- 12. Research Methodology
List of Figures
- Figure 1: Global Bromobenzene Industry Revenue Breakdown (billion, %) by Region 2025 & 2033
- Figure 2: Global Bromobenzene Industry Volume Breakdown (K Tons, %) by Region 2025 & 2033
- Figure 3: Asia Pacific Bromobenzene Industry Revenue (billion), by Product 2025 & 2033
- Figure 4: Asia Pacific Bromobenzene Industry Volume (K Tons), by Product 2025 & 2033
- Figure 5: Asia Pacific Bromobenzene Industry Revenue Share (%), by Product 2025 & 2033
- Figure 6: Asia Pacific Bromobenzene Industry Volume Share (%), by Product 2025 & 2033
- Figure 7: Asia Pacific Bromobenzene Industry Revenue (billion), by Application 2025 & 2033
- Figure 8: Asia Pacific Bromobenzene Industry Volume (K Tons), by Application 2025 & 2033
- Figure 9: Asia Pacific Bromobenzene Industry Revenue Share (%), by Application 2025 & 2033
- Figure 10: Asia Pacific Bromobenzene Industry Volume Share (%), by Application 2025 & 2033
- Figure 11: Asia Pacific Bromobenzene Industry Revenue (billion), by Country 2025 & 2033
- Figure 12: Asia Pacific Bromobenzene Industry Volume (K Tons), by Country 2025 & 2033
- Figure 13: Asia Pacific Bromobenzene Industry Revenue Share (%), by Country 2025 & 2033
- Figure 14: Asia Pacific Bromobenzene Industry Volume Share (%), by Country 2025 & 2033
- Figure 15: North America Bromobenzene Industry Revenue (billion), by Product 2025 & 2033
- Figure 16: North America Bromobenzene Industry Volume (K Tons), by Product 2025 & 2033
- Figure 17: North America Bromobenzene Industry Revenue Share (%), by Product 2025 & 2033
- Figure 18: North America Bromobenzene Industry Volume Share (%), by Product 2025 & 2033
- Figure 19: North America Bromobenzene Industry Revenue (billion), by Application 2025 & 2033
- Figure 20: North America Bromobenzene Industry Volume (K Tons), by Application 2025 & 2033
- Figure 21: North America Bromobenzene Industry Revenue Share (%), by Application 2025 & 2033
- Figure 22: North America Bromobenzene Industry Volume Share (%), by Application 2025 & 2033
- Figure 23: North America Bromobenzene Industry Revenue (billion), by Country 2025 & 2033
- Figure 24: North America Bromobenzene Industry Volume (K Tons), by Country 2025 & 2033
- Figure 25: North America Bromobenzene Industry Revenue Share (%), by Country 2025 & 2033
- Figure 26: North America Bromobenzene Industry Volume Share (%), by Country 2025 & 2033
- Figure 27: Europe Bromobenzene Industry Revenue (billion), by Product 2025 & 2033
- Figure 28: Europe Bromobenzene Industry Volume (K Tons), by Product 2025 & 2033
- Figure 29: Europe Bromobenzene Industry Revenue Share (%), by Product 2025 & 2033
- Figure 30: Europe Bromobenzene Industry Volume Share (%), by Product 2025 & 2033
- Figure 31: Europe Bromobenzene Industry Revenue (billion), by Application 2025 & 2033
- Figure 32: Europe Bromobenzene Industry Volume (K Tons), by Application 2025 & 2033
- Figure 33: Europe Bromobenzene Industry Revenue Share (%), by Application 2025 & 2033
- Figure 34: Europe Bromobenzene Industry Volume Share (%), by Application 2025 & 2033
- Figure 35: Europe Bromobenzene Industry Revenue (billion), by Country 2025 & 2033
- Figure 36: Europe Bromobenzene Industry Volume (K Tons), by Country 2025 & 2033
- Figure 37: Europe Bromobenzene Industry Revenue Share (%), by Country 2025 & 2033
- Figure 38: Europe Bromobenzene Industry Volume Share (%), by Country 2025 & 2033
- Figure 39: Rest of the World Bromobenzene Industry Revenue (billion), by Product 2025 & 2033
- Figure 40: Rest of the World Bromobenzene Industry Volume (K Tons), by Product 2025 & 2033
- Figure 41: Rest of the World Bromobenzene Industry Revenue Share (%), by Product 2025 & 2033
- Figure 42: Rest of the World Bromobenzene Industry Volume Share (%), by Product 2025 & 2033
- Figure 43: Rest of the World Bromobenzene Industry Revenue (billion), by Application 2025 & 2033
- Figure 44: Rest of the World Bromobenzene Industry Volume (K Tons), by Application 2025 & 2033
- Figure 45: Rest of the World Bromobenzene Industry Revenue Share (%), by Application 2025 & 2033
- Figure 46: Rest of the World Bromobenzene Industry Volume Share (%), by Application 2025 & 2033
- Figure 47: Rest of the World Bromobenzene Industry Revenue (billion), by Country 2025 & 2033
- Figure 48: Rest of the World Bromobenzene Industry Volume (K Tons), by Country 2025 & 2033
- Figure 49: Rest of the World Bromobenzene Industry Revenue Share (%), by Country 2025 & 2033
- Figure 50: Rest of the World Bromobenzene Industry Volume Share (%), by Country 2025 & 2033
List of Tables
- Table 1: Global Bromobenzene Industry Revenue billion Forecast, by Product 2020 & 2033
- Table 2: Global Bromobenzene Industry Volume K Tons Forecast, by Product 2020 & 2033
- Table 3: Global Bromobenzene Industry Revenue billion Forecast, by Application 2020 & 2033
- Table 4: Global Bromobenzene Industry Volume K Tons Forecast, by Application 2020 & 2033
- Table 5: Global Bromobenzene Industry Revenue billion Forecast, by Region 2020 & 2033
- Table 6: Global Bromobenzene Industry Volume K Tons Forecast, by Region 2020 & 2033
- Table 7: Global Bromobenzene Industry Revenue billion Forecast, by Product 2020 & 2033
- Table 8: Global Bromobenzene Industry Volume K Tons Forecast, by Product 2020 & 2033
- Table 9: Global Bromobenzene Industry Revenue billion Forecast, by Application 2020 & 2033
- Table 10: Global Bromobenzene Industry Volume K Tons Forecast, by Application 2020 & 2033
- Table 11: Global Bromobenzene Industry Revenue billion Forecast, by Country 2020 & 2033
- Table 12: Global Bromobenzene Industry Volume K Tons Forecast, by Country 2020 & 2033
- Table 13: China Bromobenzene Industry Revenue (billion) Forecast, by Application 2020 & 2033
- Table 14: China Bromobenzene Industry Volume (K Tons) Forecast, by Application 2020 & 2033
- Table 15: India Bromobenzene Industry Revenue (billion) Forecast, by Application 2020 & 2033
- Table 16: India Bromobenzene Industry Volume (K Tons) Forecast, by Application 2020 & 2033
- Table 17: Japan Bromobenzene Industry Revenue (billion) Forecast, by Application 2020 & 2033
- Table 18: Japan Bromobenzene Industry Volume (K Tons) Forecast, by Application 2020 & 2033
- Table 19: South Korea Bromobenzene Industry Revenue (billion) Forecast, by Application 2020 & 2033
- Table 20: South Korea Bromobenzene Industry Volume (K Tons) Forecast, by Application 2020 & 2033
- Table 21: Rest of Asia Pacific Bromobenzene Industry Revenue (billion) Forecast, by Application 2020 & 2033
- Table 22: Rest of Asia Pacific Bromobenzene Industry Volume (K Tons) Forecast, by Application 2020 & 2033
- Table 23: Global Bromobenzene Industry Revenue billion Forecast, by Product 2020 & 2033
- Table 24: Global Bromobenzene Industry Volume K Tons Forecast, by Product 2020 & 2033
- Table 25: Global Bromobenzene Industry Revenue billion Forecast, by Application 2020 & 2033
- Table 26: Global Bromobenzene Industry Volume K Tons Forecast, by Application 2020 & 2033
- Table 27: Global Bromobenzene Industry Revenue billion Forecast, by Country 2020 & 2033
- Table 28: Global Bromobenzene Industry Volume K Tons Forecast, by Country 2020 & 2033
- Table 29: United States Bromobenzene Industry Revenue (billion) Forecast, by Application 2020 & 2033
- Table 30: United States Bromobenzene Industry Volume (K Tons) Forecast, by Application 2020 & 2033
- Table 31: Canada Bromobenzene Industry Revenue (billion) Forecast, by Application 2020 & 2033
- Table 32: Canada Bromobenzene Industry Volume (K Tons) Forecast, by Application 2020 & 2033
- Table 33: Rest of the North America Bromobenzene Industry Revenue (billion) Forecast, by Application 2020 & 2033
- Table 34: Rest of the North America Bromobenzene Industry Volume (K Tons) Forecast, by Application 2020 & 2033
- Table 35: Global Bromobenzene Industry Revenue billion Forecast, by Product 2020 & 2033
- Table 36: Global Bromobenzene Industry Volume K Tons Forecast, by Product 2020 & 2033
- Table 37: Global Bromobenzene Industry Revenue billion Forecast, by Application 2020 & 2033
- Table 38: Global Bromobenzene Industry Volume K Tons Forecast, by Application 2020 & 2033
- Table 39: Global Bromobenzene Industry Revenue billion Forecast, by Country 2020 & 2033
- Table 40: Global Bromobenzene Industry Volume K Tons Forecast, by Country 2020 & 2033
- Table 41: Germany Bromobenzene Industry Revenue (billion) Forecast, by Application 2020 & 2033
- Table 42: Germany Bromobenzene Industry Volume (K Tons) Forecast, by Application 2020 & 2033
- Table 43: France Bromobenzene Industry Revenue (billion) Forecast, by Application 2020 & 2033
- Table 44: France Bromobenzene Industry Volume (K Tons) Forecast, by Application 2020 & 2033
- Table 45: United Kingdom Bromobenzene Industry Revenue (billion) Forecast, by Application 2020 & 2033
- Table 46: United Kingdom Bromobenzene Industry Volume (K Tons) Forecast, by Application 2020 & 2033
- Table 47: Italy Bromobenzene Industry Revenue (billion) Forecast, by Application 2020 & 2033
- Table 48: Italy Bromobenzene Industry Volume (K Tons) Forecast, by Application 2020 & 2033
- Table 49: Rest of the Europe Bromobenzene Industry Revenue (billion) Forecast, by Application 2020 & 2033
- Table 50: Rest of the Europe Bromobenzene Industry Volume (K Tons) Forecast, by Application 2020 & 2033
- Table 51: Global Bromobenzene Industry Revenue billion Forecast, by Product 2020 & 2033
- Table 52: Global Bromobenzene Industry Volume K Tons Forecast, by Product 2020 & 2033
- Table 53: Global Bromobenzene Industry Revenue billion Forecast, by Application 2020 & 2033
- Table 54: Global Bromobenzene Industry Volume K Tons Forecast, by Application 2020 & 2033
- Table 55: Global Bromobenzene Industry Revenue billion Forecast, by Country 2020 & 2033
- Table 56: Global Bromobenzene Industry Volume K Tons Forecast, by Country 2020 & 2033
- Table 57: South America Bromobenzene Industry Revenue (billion) Forecast, by Application 2020 & 2033
- Table 58: South America Bromobenzene Industry Volume (K Tons) Forecast, by Application 2020 & 2033
- Table 59: Middle East and Africa Bromobenzene Industry Revenue (billion) Forecast, by Application 2020 & 2033
- Table 60: Middle East and Africa Bromobenzene Industry Volume (K Tons) Forecast, by Application 2020 & 2033
Frequently Asked Questions
1. What is the projected Compound Annual Growth Rate (CAGR) of the Bromobenzene Industry?
The projected CAGR is approximately 4.4%.
2. Which companies are prominent players in the Bromobenzene Industry?
Key companies in the market include Merck KGaA, Exxon Mobil Corporation, Tokyo Chemical Industry Co Ltd, Weifang Yonhop Chemical Co Ltd, Heranba Industries Ltd, Alpha Aesar, ChemSampCo Inc, Shanghai Wescco Chemical Co Ltd, SONTARA ORGANO INDUSTRIES, Shandong Henglian Chemical Co Ltd, Hawks Chemical Company.
3. What are the main segments of the Bromobenzene Industry?
The market segments include Product, Application.
4. Can you provide details about the market size?
The market size is estimated to be USD 1.4 billion as of 2022.
5. What are some drivers contributing to market growth?
; Growing Pharmaceutical Industry in Asia-Pacific; Growing Demand for Co-polymers and Bi-phenyls.
6. What are the notable trends driving market growth?
Phenylmagnesium bromide to Dominate the Market.
7. Are there any restraints impacting market growth?
; Low-cost Chlorine-substituted Compounds.
8. Can you provide examples of recent developments in the market?
N/A
9. What pricing options are available for accessing the report?
Pricing options include single-user, multi-user, and enterprise licenses priced at USD 4750, USD 5250, and USD 8750 respectively.
10. Is the market size provided in terms of value or volume?
The market size is provided in terms of value, measured in billion and volume, measured in K Tons.
11. Are there any specific market keywords associated with the report?
Yes, the market keyword associated with the report is "Bromobenzene Industry," which aids in identifying and referencing the specific market segment covered.
12. How do I determine which pricing option suits my needs best?
The pricing options vary based on user requirements and access needs. Individual users may opt for single-user licenses, while businesses requiring broader access may choose multi-user or enterprise licenses for cost-effective access to the report.
13. Are there any additional resources or data provided in the Bromobenzene Industry report?
While the report offers comprehensive insights, it's advisable to review the specific contents or supplementary materials provided to ascertain if additional resources or data are available.
14. How can I stay updated on further developments or reports in the Bromobenzene Industry?
To stay informed about further developments, trends, and reports in the Bromobenzene Industry, consider subscribing to industry newsletters, following relevant companies and organizations, or regularly checking reputable industry news sources and publications.
Methodology
Step 1 - Identification of Relevant Samples Size from Population Database


Step 2 - Approaches for Defining Global Market Size (Value, Volume* & Price*)

Note*: In applicable scenarios
Step 3 - Data Sources
Primary Research
- Web Analytics
- Survey Reports
- Research Institute
- Latest Research Reports
- Opinion Leaders
Secondary Research
- Annual Reports
- White Paper
- Latest Press Release
- Industry Association
- Paid Database
- Investor Presentations

Step 4 - Data Triangulation
Involves using different sources of information in order to increase the validity of a study
These sources are likely to be stakeholders in a program - participants, other researchers, program staff, other community members, and so on.
Then we put all data in single framework & apply various statistical tools to find out the dynamic on the market.
During the analysis stage, feedback from the stakeholder groups would be compared to determine areas of agreement as well as areas of divergence