

Key Insights
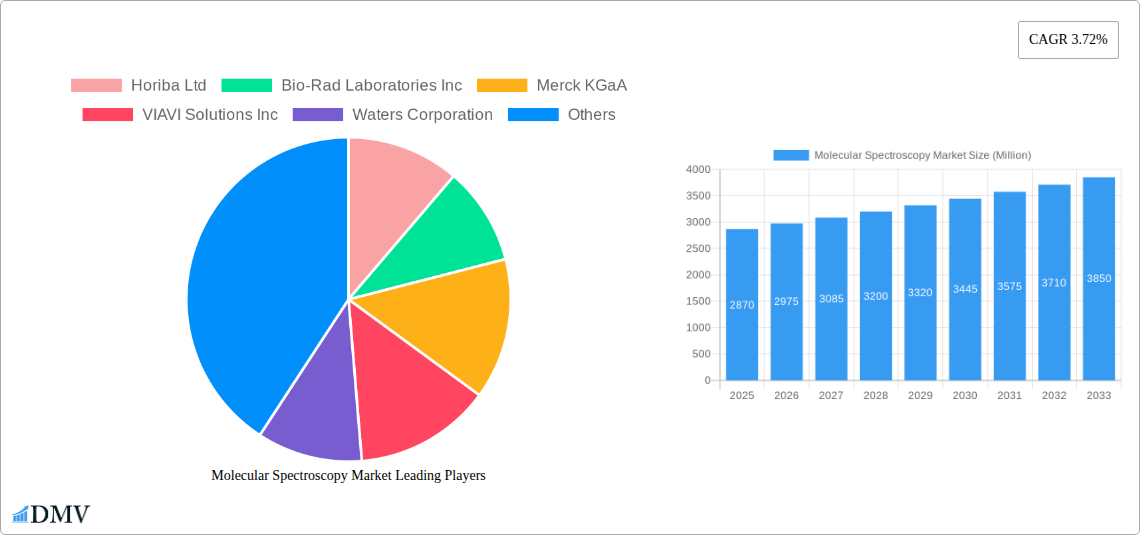
The global molecular spectroscopy market, valued at $2.87 billion in 2025, is projected to experience robust growth, driven by escalating demand across diverse sectors. A compound annual growth rate (CAGR) of 3.72% from 2025 to 2033 indicates a significant expansion, propelled by several key factors. The pharmaceutical industry's increasing reliance on advanced analytical techniques for drug discovery and quality control is a major contributor. Similarly, the burgeoning food and beverage industry, with its growing emphasis on safety and quality assurance, fuels market demand for accurate and rapid spectroscopic analyses. Biotechnology and biopharmaceutical applications, encompassing protein characterization and genomic sequencing, further contribute to market growth. Environmental monitoring and academic research also significantly utilize molecular spectroscopy techniques, leading to a broad-based market expansion. Technological advancements, such as miniaturization of instruments and the development of portable spectrometers, are expected to enhance accessibility and broaden application areas, further stimulating market growth.
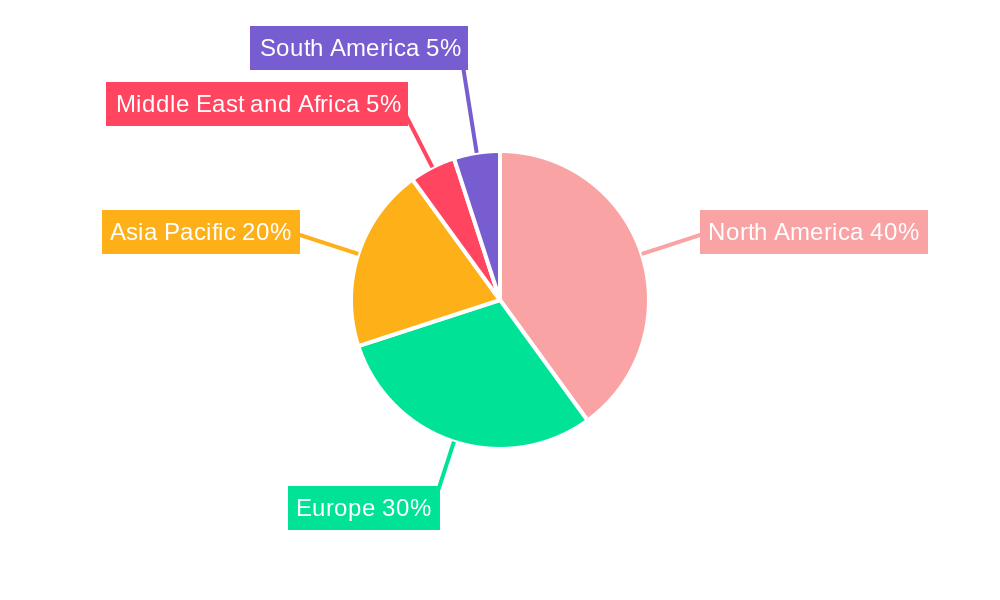
However, market growth may face some challenges. High initial investment costs associated with sophisticated spectroscopy equipment could hinder market penetration, particularly among smaller enterprises. The need for skilled personnel to operate and interpret complex spectroscopic data might also restrict market expansion in certain regions. Nonetheless, the ongoing development of user-friendly software and the availability of training programs could mitigate these restraints. The market is segmented by spectroscopy type (NMR, Raman, UV-Vis, Mass, IR, NIR, and others) and application (pharmaceutical, food & beverage, biotechnology, environmental, academic, and others). North America currently holds a significant market share due to strong technological advancements and a robust research infrastructure. However, Asia-Pacific is expected to show significant growth in the forecast period owing to rapid industrialization and expanding research activities in developing economies. Competition among major players like Horiba, Bio-Rad, Merck, and Agilent drives innovation and price optimization in the molecular spectroscopy market.
Molecular Spectroscopy Market: A Comprehensive Market Report (2019-2033)
This insightful report provides a detailed analysis of the global Molecular Spectroscopy Market, offering a comprehensive overview of its current state, future trajectory, and key players. Spanning the study period from 2019 to 2033, with a base year of 2025 and a forecast period from 2025 to 2033, this report is an invaluable resource for stakeholders seeking to understand and capitalize on the opportunities within this dynamic market. The market is projected to reach xx Million by 2033, exhibiting a CAGR of xx% during the forecast period.
Molecular Spectroscopy Market Market Composition & Trends
This section delves into the intricate landscape of the Molecular Spectroscopy Market, examining its competitive dynamics, technological advancements, and regulatory influences. We analyze market concentration, revealing the market share distribution among key players such as Horiba Ltd, Bio-Rad Laboratories Inc, Merck KGaA, and others. The report also assesses the impact of innovation catalysts, including the development of novel spectroscopic techniques and miniaturized instruments. Regulatory landscapes across various regions are scrutinized, focusing on their influence on market growth and adoption. The presence of substitute products and their competitive impact is also evaluated. The report profiles key end-users across diverse sectors, analyzing their specific needs and preferences, including pharmaceutical companies, academic research institutions and environmental testing labs. Finally, we examine M&A activities within the industry, providing insights into deal values and their strategic implications. Key metrics include:
- Market concentration: High, with top 5 players holding approximately xx% market share in 2025.
- Average M&A deal value (2019-2024): xx Million
- Number of M&A deals (2019-2024): xx
- Regulatory landscape analysis: Includes detailed assessments of FDA, EMA, and other relevant regulatory bodies' impact.
Molecular Spectroscopy Market Industry Evolution
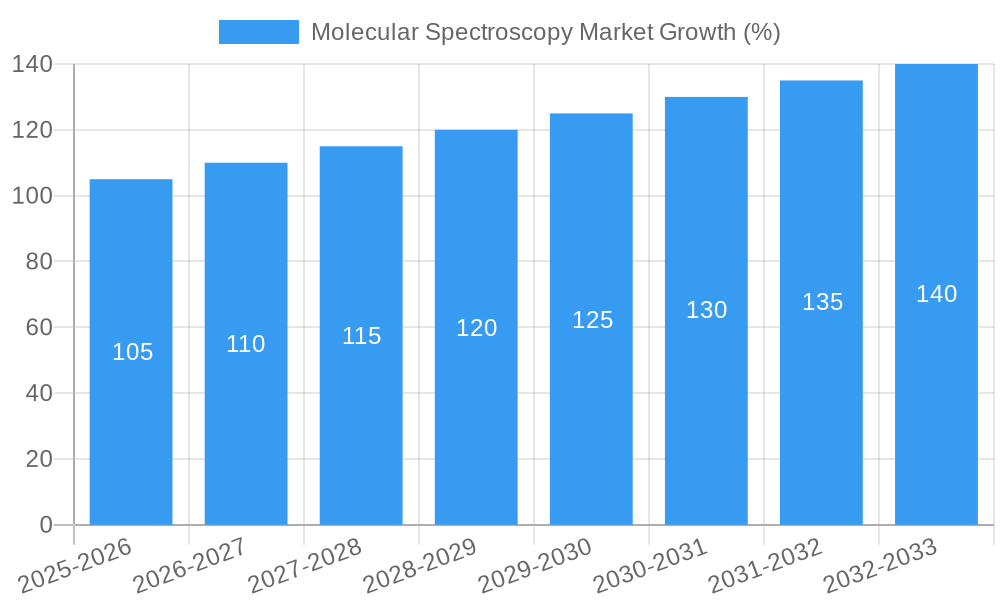
This section charts the evolutionary journey of the Molecular Spectroscopy Market, analyzing its growth trajectory from 2019 to 2024 and forecasting its future progress until 2033. We explore the technological advancements driving market expansion, including the development of higher-resolution spectrometers, improved data analysis software, and the integration of AI and machine learning. Shifting consumer demands, particularly the increasing need for faster, more accurate, and cost-effective analytical solutions, are thoroughly examined. The report also addresses the impact of emerging technologies, such as miniaturization and portable instruments. The significant growth in the pharmaceutical and biotechnology sectors has significantly fueled the adoption of molecular spectroscopy techniques. Specific data points, such as year-on-year growth rates and adoption metrics across various segments, are provided to illustrate the market’s dynamic nature. The integration of molecular spectroscopy with other analytical techniques has accelerated market growth and broadened its application.
Leading Regions, Countries, or Segments in Molecular Spectroscopy Market
This section identifies the leading regions, countries, and segments within the Molecular Spectroscopy Market. Based on our analysis, North America currently holds a significant market share, driven by robust R&D investments and a strong presence of key players. However, regions like Asia-Pacific are expected to exhibit significant growth in the coming years, propelled by economic expansion and increasing healthcare spending.
Dominant Segments:
- Type of Spectroscopy: NMR Spectroscopy and Mass Spectrometry dominate the market due to their widespread applications in various industries.
- Application: Pharmaceutical Applications and Biotechnology and Biopharmaceutical Applications are the leading application segments due to their high demand for precise and efficient analysis.
Key Drivers:
- Pharmaceutical Applications: Stringent regulatory requirements for drug quality control drive adoption.
- Biotechnology & Biopharmaceutical Applications: Rising investments in research and development of biopharmaceuticals increase demand.
- Government funding and research grants: Significant funding boosts research and development in the field.
- Technological advancements: Continuous innovation in instrument design and data analysis methods improve efficacy and efficiency.
Molecular Spectroscopy Market Product Innovations
Recent years have witnessed significant advancements in molecular spectroscopy technology. New instruments boast enhanced sensitivity, resolution, and speed, leading to improved analytical capabilities and faster turnaround times. The integration of automation features streamlines workflows, reducing human error and increasing efficiency. Innovations in data analysis software enhance interpretation and simplify complex datasets. Miniaturization efforts have led to the development of portable and handheld spectrometers, expanding application opportunities in diverse settings. These advancements provide unique selling propositions, including improved accuracy, reduced analysis time, and ease of use, driving market growth.
Propelling Factors for Molecular Spectroscopy Market Growth
The Molecular Spectroscopy Market is propelled by several factors. Technological advancements, such as increased sensitivity and resolution of instruments, contribute significantly to market growth. Rising demand from key application areas, especially in the pharmaceutical and biotechnology sectors, further boosts the market. Stringent regulatory requirements for quality control and safety testing drive adoption in various industries. Finally, increasing government investments in research and development, particularly in life sciences, fuel market expansion.
Obstacles in the Molecular Spectroscopy Market Market
Despite its growth potential, the Molecular Spectroscopy Market faces several challenges. High initial investment costs associated with purchasing sophisticated instruments can limit adoption, particularly among smaller companies and research institutions. The complexity of some techniques and the need for specialized expertise can also pose a barrier to entry. Competitive pressures from existing players and the emergence of new technologies create a dynamic market environment. Furthermore, fluctuations in the global economy and supply chain disruptions can impact market growth.
Future Opportunities in Molecular Spectroscopy Market
The future of the Molecular Spectroscopy Market holds significant opportunities. The increasing demand for faster, more accurate, and cost-effective analytical solutions across various industries creates substantial growth potential. The integration of molecular spectroscopy with other analytical techniques and the development of new applications in fields like environmental monitoring and food safety are expanding the market scope. Advances in portable and miniaturized instrumentation open new opportunities in diverse settings.
Major Players in the Molecular Spectroscopy Market Ecosystem
- Horiba Ltd
- Bio-Rad Laboratories Inc
- Merck KGaA
- VIAVI Solutions Inc
- Waters Corporation
- Danaher Corporation
- Agilent Technologies Inc
- Thermo Fischer Scientific Inc
- Jeol Ltd
- Keit Ltd
- PerkinElmer Inc
- Thorlabs Inc
- Bruker Corporation
- Shimadzu Corporation
Key Developments in Molecular Spectroscopy Market Industry
- 2023: Agilent Technologies launches a new high-resolution mass spectrometer, increasing market competition and setting a new benchmark for performance.
- 2022: Thermo Fisher Scientific and Danaher Corporation announce a strategic partnership to develop advanced spectroscopic solutions for pharmaceutical applications.
- 2021: Bio-Rad Laboratories releases new Raman spectroscopy software with enhanced data analysis capabilities, improving user experience and efficiency.
- (Add further developments with specific dates as available)
Strategic Molecular Spectroscopy Market Market Forecast
The Molecular Spectroscopy Market is poised for sustained growth in the coming years, driven by technological advancements, increasing demand from key application segments, and ongoing investments in R&D. The market is expected to benefit from the integration of novel analytical techniques and the development of new applications across diverse industries. This growth will be further propelled by increased government funding for research initiatives, leading to the continuous improvement of instrumentation and analytical capabilities. The market’s future prospects are optimistic, indicating significant opportunities for stakeholders and industry participants alike.
Molecular Spectroscopy Market Segmentation
-
1. Type of Spectroscopy
- 1.1. NMR Spectroscopy
- 1.2. Raman Spectroscopy
- 1.3. UV-visible Spectroscopy
- 1.4. Mass Spectroscopy
- 1.5. Infrared Spectroscopy
- 1.6. Near-infrared Spectroscopy
- 1.7. Other Types of Spectroscopy
-
2. Application
- 2.1. Pharmaceutical Applications
- 2.2. Food and Beverage Testing
- 2.3. Biotechnology and Biopharmaceutical Applications
- 2.4. Environmental Testing
- 2.5. Academic Research
- 2.6. Other Applications
Molecular Spectroscopy Market Segmentation By Geography
-
1. North America
- 1.1. United States
- 1.2. Canada
- 1.3. Mexico
-
2. Europe
- 2.1. Germany
- 2.2. United Kingdom
- 2.3. France
- 2.4. Italy
- 2.5. Spain
- 2.6. Rest of Europe
-
3. Asia Pacific
- 3.1. China
- 3.2. Japan
- 3.3. India
- 3.4. Australia
- 3.5. South Korea
- 3.6. Rest of Asia Pacific
-
4. Middle East and Africa
- 4.1. GCC
- 4.2. South Africa
- 4.3. Rest of Middle East and Africa
-
5. South America
- 5.1. Brazil
- 5.2. Argentina
- 5.3. Rest of South America
Molecular Spectroscopy Market REPORT HIGHLIGHTS
| Aspects | Details |
|---|---|
| Study Period | 2019-2033 |
| Base Year | 2024 |
| Estimated Year | 2025 |
| Forecast Period | 2025-2033 |
| Historical Period | 2019-2024 |
| Growth Rate | CAGR of 3.72% from 2019-2033 |
| Segmentation |
|
Table of Contents
- 1. Introduction
- 1.1. Research Scope
- 1.2. Market Segmentation
- 1.3. Research Methodology
- 1.4. Definitions and Assumptions
- 2. Executive Summary
- 2.1. Introduction
- 3. Market Dynamics
- 3.1. Introduction
- 3.2. Market Drivers
- 3.2.1. Rapid Adoption in the Pharmaceutical Industry; Penetration of MS Technology in Various Verticals; Increased Emphasis for Discovery of Newer Molecules by Pharmaceuticals
- 3.3. Market Restrains
- 3.3.1. High Cost of Maintenance and Installation Charges; Need of Technically Skilled Personnel
- 3.4. Market Trends
- 3.4.1. The NMR Spectroscopy Segment is Expected to Observe Good Growth Over the Forecast Period
- 4. Market Factor Analysis
- 4.1. Porters Five Forces
- 4.2. Supply/Value Chain
- 4.3. PESTEL analysis
- 4.4. Market Entropy
- 4.5. Patent/Trademark Analysis
- 5. Global Molecular Spectroscopy Market Analysis, Insights and Forecast, 2019-2031
- 5.1. Market Analysis, Insights and Forecast - by Type of Spectroscopy
- 5.1.1. NMR Spectroscopy
- 5.1.2. Raman Spectroscopy
- 5.1.3. UV-visible Spectroscopy
- 5.1.4. Mass Spectroscopy
- 5.1.5. Infrared Spectroscopy
- 5.1.6. Near-infrared Spectroscopy
- 5.1.7. Other Types of Spectroscopy
- 5.2. Market Analysis, Insights and Forecast - by Application
- 5.2.1. Pharmaceutical Applications
- 5.2.2. Food and Beverage Testing
- 5.2.3. Biotechnology and Biopharmaceutical Applications
- 5.2.4. Environmental Testing
- 5.2.5. Academic Research
- 5.2.6. Other Applications
- 5.3. Market Analysis, Insights and Forecast - by Region
- 5.3.1. North America
- 5.3.2. Europe
- 5.3.3. Asia Pacific
- 5.3.4. Middle East and Africa
- 5.3.5. South America
- 5.1. Market Analysis, Insights and Forecast - by Type of Spectroscopy
- 6. North America Molecular Spectroscopy Market Analysis, Insights and Forecast, 2019-2031
- 6.1. Market Analysis, Insights and Forecast - by Type of Spectroscopy
- 6.1.1. NMR Spectroscopy
- 6.1.2. Raman Spectroscopy
- 6.1.3. UV-visible Spectroscopy
- 6.1.4. Mass Spectroscopy
- 6.1.5. Infrared Spectroscopy
- 6.1.6. Near-infrared Spectroscopy
- 6.1.7. Other Types of Spectroscopy
- 6.2. Market Analysis, Insights and Forecast - by Application
- 6.2.1. Pharmaceutical Applications
- 6.2.2. Food and Beverage Testing
- 6.2.3. Biotechnology and Biopharmaceutical Applications
- 6.2.4. Environmental Testing
- 6.2.5. Academic Research
- 6.2.6. Other Applications
- 6.1. Market Analysis, Insights and Forecast - by Type of Spectroscopy
- 7. Europe Molecular Spectroscopy Market Analysis, Insights and Forecast, 2019-2031
- 7.1. Market Analysis, Insights and Forecast - by Type of Spectroscopy
- 7.1.1. NMR Spectroscopy
- 7.1.2. Raman Spectroscopy
- 7.1.3. UV-visible Spectroscopy
- 7.1.4. Mass Spectroscopy
- 7.1.5. Infrared Spectroscopy
- 7.1.6. Near-infrared Spectroscopy
- 7.1.7. Other Types of Spectroscopy
- 7.2. Market Analysis, Insights and Forecast - by Application
- 7.2.1. Pharmaceutical Applications
- 7.2.2. Food and Beverage Testing
- 7.2.3. Biotechnology and Biopharmaceutical Applications
- 7.2.4. Environmental Testing
- 7.2.5. Academic Research
- 7.2.6. Other Applications
- 7.1. Market Analysis, Insights and Forecast - by Type of Spectroscopy
- 8. Asia Pacific Molecular Spectroscopy Market Analysis, Insights and Forecast, 2019-2031
- 8.1. Market Analysis, Insights and Forecast - by Type of Spectroscopy
- 8.1.1. NMR Spectroscopy
- 8.1.2. Raman Spectroscopy
- 8.1.3. UV-visible Spectroscopy
- 8.1.4. Mass Spectroscopy
- 8.1.5. Infrared Spectroscopy
- 8.1.6. Near-infrared Spectroscopy
- 8.1.7. Other Types of Spectroscopy
- 8.2. Market Analysis, Insights and Forecast - by Application
- 8.2.1. Pharmaceutical Applications
- 8.2.2. Food and Beverage Testing
- 8.2.3. Biotechnology and Biopharmaceutical Applications
- 8.2.4. Environmental Testing
- 8.2.5. Academic Research
- 8.2.6. Other Applications
- 8.1. Market Analysis, Insights and Forecast - by Type of Spectroscopy
- 9. Middle East and Africa Molecular Spectroscopy Market Analysis, Insights and Forecast, 2019-2031
- 9.1. Market Analysis, Insights and Forecast - by Type of Spectroscopy
- 9.1.1. NMR Spectroscopy
- 9.1.2. Raman Spectroscopy
- 9.1.3. UV-visible Spectroscopy
- 9.1.4. Mass Spectroscopy
- 9.1.5. Infrared Spectroscopy
- 9.1.6. Near-infrared Spectroscopy
- 9.1.7. Other Types of Spectroscopy
- 9.2. Market Analysis, Insights and Forecast - by Application
- 9.2.1. Pharmaceutical Applications
- 9.2.2. Food and Beverage Testing
- 9.2.3. Biotechnology and Biopharmaceutical Applications
- 9.2.4. Environmental Testing
- 9.2.5. Academic Research
- 9.2.6. Other Applications
- 9.1. Market Analysis, Insights and Forecast - by Type of Spectroscopy
- 10. South America Molecular Spectroscopy Market Analysis, Insights and Forecast, 2019-2031
- 10.1. Market Analysis, Insights and Forecast - by Type of Spectroscopy
- 10.1.1. NMR Spectroscopy
- 10.1.2. Raman Spectroscopy
- 10.1.3. UV-visible Spectroscopy
- 10.1.4. Mass Spectroscopy
- 10.1.5. Infrared Spectroscopy
- 10.1.6. Near-infrared Spectroscopy
- 10.1.7. Other Types of Spectroscopy
- 10.2. Market Analysis, Insights and Forecast - by Application
- 10.2.1. Pharmaceutical Applications
- 10.2.2. Food and Beverage Testing
- 10.2.3. Biotechnology and Biopharmaceutical Applications
- 10.2.4. Environmental Testing
- 10.2.5. Academic Research
- 10.2.6. Other Applications
- 10.1. Market Analysis, Insights and Forecast - by Type of Spectroscopy
- 11. North America Molecular Spectroscopy Market Analysis, Insights and Forecast, 2019-2031
- 11.1. Market Analysis, Insights and Forecast - By Country/Sub-region
- 11.1.1 United States
- 11.1.2 Canada
- 11.1.3 Mexico
- 12. Europe Molecular Spectroscopy Market Analysis, Insights and Forecast, 2019-2031
- 12.1. Market Analysis, Insights and Forecast - By Country/Sub-region
- 12.1.1 Germany
- 12.1.2 United Kingdom
- 12.1.3 France
- 12.1.4 Italy
- 12.1.5 Spain
- 12.1.6 Rest of Europe
- 13. Asia Pacific Molecular Spectroscopy Market Analysis, Insights and Forecast, 2019-2031
- 13.1. Market Analysis, Insights and Forecast - By Country/Sub-region
- 13.1.1 China
- 13.1.2 Japan
- 13.1.3 India
- 13.1.4 Australia
- 13.1.5 South Korea
- 13.1.6 Rest of Asia Pacific
- 14. Middle East and Africa Molecular Spectroscopy Market Analysis, Insights and Forecast, 2019-2031
- 14.1. Market Analysis, Insights and Forecast - By Country/Sub-region
- 14.1.1 GCC
- 14.1.2 South Africa
- 14.1.3 Rest of Middle East and Africa
- 15. South America Molecular Spectroscopy Market Analysis, Insights and Forecast, 2019-2031
- 15.1. Market Analysis, Insights and Forecast - By Country/Sub-region
- 15.1.1 Brazil
- 15.1.2 Argentina
- 15.1.3 Rest of South America
- 16. Competitive Analysis
- 16.1. Global Market Share Analysis 2024
- 16.2. Company Profiles
- 16.2.1 Horiba Ltd
- 16.2.1.1. Overview
- 16.2.1.2. Products
- 16.2.1.3. SWOT Analysis
- 16.2.1.4. Recent Developments
- 16.2.1.5. Financials (Based on Availability)
- 16.2.2 Bio-Rad Laboratories Inc
- 16.2.2.1. Overview
- 16.2.2.2. Products
- 16.2.2.3. SWOT Analysis
- 16.2.2.4. Recent Developments
- 16.2.2.5. Financials (Based on Availability)
- 16.2.3 Merck KGaA
- 16.2.3.1. Overview
- 16.2.3.2. Products
- 16.2.3.3. SWOT Analysis
- 16.2.3.4. Recent Developments
- 16.2.3.5. Financials (Based on Availability)
- 16.2.4 VIAVI Solutions Inc
- 16.2.4.1. Overview
- 16.2.4.2. Products
- 16.2.4.3. SWOT Analysis
- 16.2.4.4. Recent Developments
- 16.2.4.5. Financials (Based on Availability)
- 16.2.5 Waters Corporation
- 16.2.5.1. Overview
- 16.2.5.2. Products
- 16.2.5.3. SWOT Analysis
- 16.2.5.4. Recent Developments
- 16.2.5.5. Financials (Based on Availability)
- 16.2.6 Danaher Corporation
- 16.2.6.1. Overview
- 16.2.6.2. Products
- 16.2.6.3. SWOT Analysis
- 16.2.6.4. Recent Developments
- 16.2.6.5. Financials (Based on Availability)
- 16.2.7 Agilent Technologies Inc
- 16.2.7.1. Overview
- 16.2.7.2. Products
- 16.2.7.3. SWOT Analysis
- 16.2.7.4. Recent Developments
- 16.2.7.5. Financials (Based on Availability)
- 16.2.8 Thermo Fischer Scientific Inc
- 16.2.8.1. Overview
- 16.2.8.2. Products
- 16.2.8.3. SWOT Analysis
- 16.2.8.4. Recent Developments
- 16.2.8.5. Financials (Based on Availability)
- 16.2.9 Jeol Ltd
- 16.2.9.1. Overview
- 16.2.9.2. Products
- 16.2.9.3. SWOT Analysis
- 16.2.9.4. Recent Developments
- 16.2.9.5. Financials (Based on Availability)
- 16.2.10 Keit Ltd
- 16.2.10.1. Overview
- 16.2.10.2. Products
- 16.2.10.3. SWOT Analysis
- 16.2.10.4. Recent Developments
- 16.2.10.5. Financials (Based on Availability)
- 16.2.11 PerkinElmer Inc
- 16.2.11.1. Overview
- 16.2.11.2. Products
- 16.2.11.3. SWOT Analysis
- 16.2.11.4. Recent Developments
- 16.2.11.5. Financials (Based on Availability)
- 16.2.12 Thorlabs Inc
- 16.2.12.1. Overview
- 16.2.12.2. Products
- 16.2.12.3. SWOT Analysis
- 16.2.12.4. Recent Developments
- 16.2.12.5. Financials (Based on Availability)
- 16.2.13 Bruker Corporation
- 16.2.13.1. Overview
- 16.2.13.2. Products
- 16.2.13.3. SWOT Analysis
- 16.2.13.4. Recent Developments
- 16.2.13.5. Financials (Based on Availability)
- 16.2.14 Shimadzu Corporation
- 16.2.14.1. Overview
- 16.2.14.2. Products
- 16.2.14.3. SWOT Analysis
- 16.2.14.4. Recent Developments
- 16.2.14.5. Financials (Based on Availability)
- 16.2.1 Horiba Ltd
List of Figures
- Figure 1: Global Molecular Spectroscopy Market Revenue Breakdown (Million, %) by Region 2024 & 2032
- Figure 2: Global Molecular Spectroscopy Market Volume Breakdown (K Unit, %) by Region 2024 & 2032
- Figure 3: North America Molecular Spectroscopy Market Revenue (Million), by Country 2024 & 2032
- Figure 4: North America Molecular Spectroscopy Market Volume (K Unit), by Country 2024 & 2032
- Figure 5: North America Molecular Spectroscopy Market Revenue Share (%), by Country 2024 & 2032
- Figure 6: North America Molecular Spectroscopy Market Volume Share (%), by Country 2024 & 2032
- Figure 7: Europe Molecular Spectroscopy Market Revenue (Million), by Country 2024 & 2032
- Figure 8: Europe Molecular Spectroscopy Market Volume (K Unit), by Country 2024 & 2032
- Figure 9: Europe Molecular Spectroscopy Market Revenue Share (%), by Country 2024 & 2032
- Figure 10: Europe Molecular Spectroscopy Market Volume Share (%), by Country 2024 & 2032
- Figure 11: Asia Pacific Molecular Spectroscopy Market Revenue (Million), by Country 2024 & 2032
- Figure 12: Asia Pacific Molecular Spectroscopy Market Volume (K Unit), by Country 2024 & 2032
- Figure 13: Asia Pacific Molecular Spectroscopy Market Revenue Share (%), by Country 2024 & 2032
- Figure 14: Asia Pacific Molecular Spectroscopy Market Volume Share (%), by Country 2024 & 2032
- Figure 15: Middle East and Africa Molecular Spectroscopy Market Revenue (Million), by Country 2024 & 2032
- Figure 16: Middle East and Africa Molecular Spectroscopy Market Volume (K Unit), by Country 2024 & 2032
- Figure 17: Middle East and Africa Molecular Spectroscopy Market Revenue Share (%), by Country 2024 & 2032
- Figure 18: Middle East and Africa Molecular Spectroscopy Market Volume Share (%), by Country 2024 & 2032
- Figure 19: South America Molecular Spectroscopy Market Revenue (Million), by Country 2024 & 2032
- Figure 20: South America Molecular Spectroscopy Market Volume (K Unit), by Country 2024 & 2032
- Figure 21: South America Molecular Spectroscopy Market Revenue Share (%), by Country 2024 & 2032
- Figure 22: South America Molecular Spectroscopy Market Volume Share (%), by Country 2024 & 2032
- Figure 23: North America Molecular Spectroscopy Market Revenue (Million), by Type of Spectroscopy 2024 & 2032
- Figure 24: North America Molecular Spectroscopy Market Volume (K Unit), by Type of Spectroscopy 2024 & 2032
- Figure 25: North America Molecular Spectroscopy Market Revenue Share (%), by Type of Spectroscopy 2024 & 2032
- Figure 26: North America Molecular Spectroscopy Market Volume Share (%), by Type of Spectroscopy 2024 & 2032
- Figure 27: North America Molecular Spectroscopy Market Revenue (Million), by Application 2024 & 2032
- Figure 28: North America Molecular Spectroscopy Market Volume (K Unit), by Application 2024 & 2032
- Figure 29: North America Molecular Spectroscopy Market Revenue Share (%), by Application 2024 & 2032
- Figure 30: North America Molecular Spectroscopy Market Volume Share (%), by Application 2024 & 2032
- Figure 31: North America Molecular Spectroscopy Market Revenue (Million), by Country 2024 & 2032
- Figure 32: North America Molecular Spectroscopy Market Volume (K Unit), by Country 2024 & 2032
- Figure 33: North America Molecular Spectroscopy Market Revenue Share (%), by Country 2024 & 2032
- Figure 34: North America Molecular Spectroscopy Market Volume Share (%), by Country 2024 & 2032
- Figure 35: Europe Molecular Spectroscopy Market Revenue (Million), by Type of Spectroscopy 2024 & 2032
- Figure 36: Europe Molecular Spectroscopy Market Volume (K Unit), by Type of Spectroscopy 2024 & 2032
- Figure 37: Europe Molecular Spectroscopy Market Revenue Share (%), by Type of Spectroscopy 2024 & 2032
- Figure 38: Europe Molecular Spectroscopy Market Volume Share (%), by Type of Spectroscopy 2024 & 2032
- Figure 39: Europe Molecular Spectroscopy Market Revenue (Million), by Application 2024 & 2032
- Figure 40: Europe Molecular Spectroscopy Market Volume (K Unit), by Application 2024 & 2032
- Figure 41: Europe Molecular Spectroscopy Market Revenue Share (%), by Application 2024 & 2032
- Figure 42: Europe Molecular Spectroscopy Market Volume Share (%), by Application 2024 & 2032
- Figure 43: Europe Molecular Spectroscopy Market Revenue (Million), by Country 2024 & 2032
- Figure 44: Europe Molecular Spectroscopy Market Volume (K Unit), by Country 2024 & 2032
- Figure 45: Europe Molecular Spectroscopy Market Revenue Share (%), by Country 2024 & 2032
- Figure 46: Europe Molecular Spectroscopy Market Volume Share (%), by Country 2024 & 2032
- Figure 47: Asia Pacific Molecular Spectroscopy Market Revenue (Million), by Type of Spectroscopy 2024 & 2032
- Figure 48: Asia Pacific Molecular Spectroscopy Market Volume (K Unit), by Type of Spectroscopy 2024 & 2032
- Figure 49: Asia Pacific Molecular Spectroscopy Market Revenue Share (%), by Type of Spectroscopy 2024 & 2032
- Figure 50: Asia Pacific Molecular Spectroscopy Market Volume Share (%), by Type of Spectroscopy 2024 & 2032
- Figure 51: Asia Pacific Molecular Spectroscopy Market Revenue (Million), by Application 2024 & 2032
- Figure 52: Asia Pacific Molecular Spectroscopy Market Volume (K Unit), by Application 2024 & 2032
- Figure 53: Asia Pacific Molecular Spectroscopy Market Revenue Share (%), by Application 2024 & 2032
- Figure 54: Asia Pacific Molecular Spectroscopy Market Volume Share (%), by Application 2024 & 2032
- Figure 55: Asia Pacific Molecular Spectroscopy Market Revenue (Million), by Country 2024 & 2032
- Figure 56: Asia Pacific Molecular Spectroscopy Market Volume (K Unit), by Country 2024 & 2032
- Figure 57: Asia Pacific Molecular Spectroscopy Market Revenue Share (%), by Country 2024 & 2032
- Figure 58: Asia Pacific Molecular Spectroscopy Market Volume Share (%), by Country 2024 & 2032
- Figure 59: Middle East and Africa Molecular Spectroscopy Market Revenue (Million), by Type of Spectroscopy 2024 & 2032
- Figure 60: Middle East and Africa Molecular Spectroscopy Market Volume (K Unit), by Type of Spectroscopy 2024 & 2032
- Figure 61: Middle East and Africa Molecular Spectroscopy Market Revenue Share (%), by Type of Spectroscopy 2024 & 2032
- Figure 62: Middle East and Africa Molecular Spectroscopy Market Volume Share (%), by Type of Spectroscopy 2024 & 2032
- Figure 63: Middle East and Africa Molecular Spectroscopy Market Revenue (Million), by Application 2024 & 2032
- Figure 64: Middle East and Africa Molecular Spectroscopy Market Volume (K Unit), by Application 2024 & 2032
- Figure 65: Middle East and Africa Molecular Spectroscopy Market Revenue Share (%), by Application 2024 & 2032
- Figure 66: Middle East and Africa Molecular Spectroscopy Market Volume Share (%), by Application 2024 & 2032
- Figure 67: Middle East and Africa Molecular Spectroscopy Market Revenue (Million), by Country 2024 & 2032
- Figure 68: Middle East and Africa Molecular Spectroscopy Market Volume (K Unit), by Country 2024 & 2032
- Figure 69: Middle East and Africa Molecular Spectroscopy Market Revenue Share (%), by Country 2024 & 2032
- Figure 70: Middle East and Africa Molecular Spectroscopy Market Volume Share (%), by Country 2024 & 2032
- Figure 71: South America Molecular Spectroscopy Market Revenue (Million), by Type of Spectroscopy 2024 & 2032
- Figure 72: South America Molecular Spectroscopy Market Volume (K Unit), by Type of Spectroscopy 2024 & 2032
- Figure 73: South America Molecular Spectroscopy Market Revenue Share (%), by Type of Spectroscopy 2024 & 2032
- Figure 74: South America Molecular Spectroscopy Market Volume Share (%), by Type of Spectroscopy 2024 & 2032
- Figure 75: South America Molecular Spectroscopy Market Revenue (Million), by Application 2024 & 2032
- Figure 76: South America Molecular Spectroscopy Market Volume (K Unit), by Application 2024 & 2032
- Figure 77: South America Molecular Spectroscopy Market Revenue Share (%), by Application 2024 & 2032
- Figure 78: South America Molecular Spectroscopy Market Volume Share (%), by Application 2024 & 2032
- Figure 79: South America Molecular Spectroscopy Market Revenue (Million), by Country 2024 & 2032
- Figure 80: South America Molecular Spectroscopy Market Volume (K Unit), by Country 2024 & 2032
- Figure 81: South America Molecular Spectroscopy Market Revenue Share (%), by Country 2024 & 2032
- Figure 82: South America Molecular Spectroscopy Market Volume Share (%), by Country 2024 & 2032
List of Tables
- Table 1: Global Molecular Spectroscopy Market Revenue Million Forecast, by Region 2019 & 2032
- Table 2: Global Molecular Spectroscopy Market Volume K Unit Forecast, by Region 2019 & 2032
- Table 3: Global Molecular Spectroscopy Market Revenue Million Forecast, by Type of Spectroscopy 2019 & 2032
- Table 4: Global Molecular Spectroscopy Market Volume K Unit Forecast, by Type of Spectroscopy 2019 & 2032
- Table 5: Global Molecular Spectroscopy Market Revenue Million Forecast, by Application 2019 & 2032
- Table 6: Global Molecular Spectroscopy Market Volume K Unit Forecast, by Application 2019 & 2032
- Table 7: Global Molecular Spectroscopy Market Revenue Million Forecast, by Region 2019 & 2032
- Table 8: Global Molecular Spectroscopy Market Volume K Unit Forecast, by Region 2019 & 2032
- Table 9: Global Molecular Spectroscopy Market Revenue Million Forecast, by Country 2019 & 2032
- Table 10: Global Molecular Spectroscopy Market Volume K Unit Forecast, by Country 2019 & 2032
- Table 11: United States Molecular Spectroscopy Market Revenue (Million) Forecast, by Application 2019 & 2032
- Table 12: United States Molecular Spectroscopy Market Volume (K Unit) Forecast, by Application 2019 & 2032
- Table 13: Canada Molecular Spectroscopy Market Revenue (Million) Forecast, by Application 2019 & 2032
- Table 14: Canada Molecular Spectroscopy Market Volume (K Unit) Forecast, by Application 2019 & 2032
- Table 15: Mexico Molecular Spectroscopy Market Revenue (Million) Forecast, by Application 2019 & 2032
- Table 16: Mexico Molecular Spectroscopy Market Volume (K Unit) Forecast, by Application 2019 & 2032
- Table 17: Global Molecular Spectroscopy Market Revenue Million Forecast, by Country 2019 & 2032
- Table 18: Global Molecular Spectroscopy Market Volume K Unit Forecast, by Country 2019 & 2032
- Table 19: Germany Molecular Spectroscopy Market Revenue (Million) Forecast, by Application 2019 & 2032
- Table 20: Germany Molecular Spectroscopy Market Volume (K Unit) Forecast, by Application 2019 & 2032
- Table 21: United Kingdom Molecular Spectroscopy Market Revenue (Million) Forecast, by Application 2019 & 2032
- Table 22: United Kingdom Molecular Spectroscopy Market Volume (K Unit) Forecast, by Application 2019 & 2032
- Table 23: France Molecular Spectroscopy Market Revenue (Million) Forecast, by Application 2019 & 2032
- Table 24: France Molecular Spectroscopy Market Volume (K Unit) Forecast, by Application 2019 & 2032
- Table 25: Italy Molecular Spectroscopy Market Revenue (Million) Forecast, by Application 2019 & 2032
- Table 26: Italy Molecular Spectroscopy Market Volume (K Unit) Forecast, by Application 2019 & 2032
- Table 27: Spain Molecular Spectroscopy Market Revenue (Million) Forecast, by Application 2019 & 2032
- Table 28: Spain Molecular Spectroscopy Market Volume (K Unit) Forecast, by Application 2019 & 2032
- Table 29: Rest of Europe Molecular Spectroscopy Market Revenue (Million) Forecast, by Application 2019 & 2032
- Table 30: Rest of Europe Molecular Spectroscopy Market Volume (K Unit) Forecast, by Application 2019 & 2032
- Table 31: Global Molecular Spectroscopy Market Revenue Million Forecast, by Country 2019 & 2032
- Table 32: Global Molecular Spectroscopy Market Volume K Unit Forecast, by Country 2019 & 2032
- Table 33: China Molecular Spectroscopy Market Revenue (Million) Forecast, by Application 2019 & 2032
- Table 34: China Molecular Spectroscopy Market Volume (K Unit) Forecast, by Application 2019 & 2032
- Table 35: Japan Molecular Spectroscopy Market Revenue (Million) Forecast, by Application 2019 & 2032
- Table 36: Japan Molecular Spectroscopy Market Volume (K Unit) Forecast, by Application 2019 & 2032
- Table 37: India Molecular Spectroscopy Market Revenue (Million) Forecast, by Application 2019 & 2032
- Table 38: India Molecular Spectroscopy Market Volume (K Unit) Forecast, by Application 2019 & 2032
- Table 39: Australia Molecular Spectroscopy Market Revenue (Million) Forecast, by Application 2019 & 2032
- Table 40: Australia Molecular Spectroscopy Market Volume (K Unit) Forecast, by Application 2019 & 2032
- Table 41: South Korea Molecular Spectroscopy Market Revenue (Million) Forecast, by Application 2019 & 2032
- Table 42: South Korea Molecular Spectroscopy Market Volume (K Unit) Forecast, by Application 2019 & 2032
- Table 43: Rest of Asia Pacific Molecular Spectroscopy Market Revenue (Million) Forecast, by Application 2019 & 2032
- Table 44: Rest of Asia Pacific Molecular Spectroscopy Market Volume (K Unit) Forecast, by Application 2019 & 2032
- Table 45: Global Molecular Spectroscopy Market Revenue Million Forecast, by Country 2019 & 2032
- Table 46: Global Molecular Spectroscopy Market Volume K Unit Forecast, by Country 2019 & 2032
- Table 47: GCC Molecular Spectroscopy Market Revenue (Million) Forecast, by Application 2019 & 2032
- Table 48: GCC Molecular Spectroscopy Market Volume (K Unit) Forecast, by Application 2019 & 2032
- Table 49: South Africa Molecular Spectroscopy Market Revenue (Million) Forecast, by Application 2019 & 2032
- Table 50: South Africa Molecular Spectroscopy Market Volume (K Unit) Forecast, by Application 2019 & 2032
- Table 51: Rest of Middle East and Africa Molecular Spectroscopy Market Revenue (Million) Forecast, by Application 2019 & 2032
- Table 52: Rest of Middle East and Africa Molecular Spectroscopy Market Volume (K Unit) Forecast, by Application 2019 & 2032
- Table 53: Global Molecular Spectroscopy Market Revenue Million Forecast, by Country 2019 & 2032
- Table 54: Global Molecular Spectroscopy Market Volume K Unit Forecast, by Country 2019 & 2032
- Table 55: Brazil Molecular Spectroscopy Market Revenue (Million) Forecast, by Application 2019 & 2032
- Table 56: Brazil Molecular Spectroscopy Market Volume (K Unit) Forecast, by Application 2019 & 2032
- Table 57: Argentina Molecular Spectroscopy Market Revenue (Million) Forecast, by Application 2019 & 2032
- Table 58: Argentina Molecular Spectroscopy Market Volume (K Unit) Forecast, by Application 2019 & 2032
- Table 59: Rest of South America Molecular Spectroscopy Market Revenue (Million) Forecast, by Application 2019 & 2032
- Table 60: Rest of South America Molecular Spectroscopy Market Volume (K Unit) Forecast, by Application 2019 & 2032
- Table 61: Global Molecular Spectroscopy Market Revenue Million Forecast, by Type of Spectroscopy 2019 & 2032
- Table 62: Global Molecular Spectroscopy Market Volume K Unit Forecast, by Type of Spectroscopy 2019 & 2032
- Table 63: Global Molecular Spectroscopy Market Revenue Million Forecast, by Application 2019 & 2032
- Table 64: Global Molecular Spectroscopy Market Volume K Unit Forecast, by Application 2019 & 2032
- Table 65: Global Molecular Spectroscopy Market Revenue Million Forecast, by Country 2019 & 2032
- Table 66: Global Molecular Spectroscopy Market Volume K Unit Forecast, by Country 2019 & 2032
- Table 67: United States Molecular Spectroscopy Market Revenue (Million) Forecast, by Application 2019 & 2032
- Table 68: United States Molecular Spectroscopy Market Volume (K Unit) Forecast, by Application 2019 & 2032
- Table 69: Canada Molecular Spectroscopy Market Revenue (Million) Forecast, by Application 2019 & 2032
- Table 70: Canada Molecular Spectroscopy Market Volume (K Unit) Forecast, by Application 2019 & 2032
- Table 71: Mexico Molecular Spectroscopy Market Revenue (Million) Forecast, by Application 2019 & 2032
- Table 72: Mexico Molecular Spectroscopy Market Volume (K Unit) Forecast, by Application 2019 & 2032
- Table 73: Global Molecular Spectroscopy Market Revenue Million Forecast, by Type of Spectroscopy 2019 & 2032
- Table 74: Global Molecular Spectroscopy Market Volume K Unit Forecast, by Type of Spectroscopy 2019 & 2032
- Table 75: Global Molecular Spectroscopy Market Revenue Million Forecast, by Application 2019 & 2032
- Table 76: Global Molecular Spectroscopy Market Volume K Unit Forecast, by Application 2019 & 2032
- Table 77: Global Molecular Spectroscopy Market Revenue Million Forecast, by Country 2019 & 2032
- Table 78: Global Molecular Spectroscopy Market Volume K Unit Forecast, by Country 2019 & 2032
- Table 79: Germany Molecular Spectroscopy Market Revenue (Million) Forecast, by Application 2019 & 2032
- Table 80: Germany Molecular Spectroscopy Market Volume (K Unit) Forecast, by Application 2019 & 2032
- Table 81: United Kingdom Molecular Spectroscopy Market Revenue (Million) Forecast, by Application 2019 & 2032
- Table 82: United Kingdom Molecular Spectroscopy Market Volume (K Unit) Forecast, by Application 2019 & 2032
- Table 83: France Molecular Spectroscopy Market Revenue (Million) Forecast, by Application 2019 & 2032
- Table 84: France Molecular Spectroscopy Market Volume (K Unit) Forecast, by Application 2019 & 2032
- Table 85: Italy Molecular Spectroscopy Market Revenue (Million) Forecast, by Application 2019 & 2032
- Table 86: Italy Molecular Spectroscopy Market Volume (K Unit) Forecast, by Application 2019 & 2032
- Table 87: Spain Molecular Spectroscopy Market Revenue (Million) Forecast, by Application 2019 & 2032
- Table 88: Spain Molecular Spectroscopy Market Volume (K Unit) Forecast, by Application 2019 & 2032
- Table 89: Rest of Europe Molecular Spectroscopy Market Revenue (Million) Forecast, by Application 2019 & 2032
- Table 90: Rest of Europe Molecular Spectroscopy Market Volume (K Unit) Forecast, by Application 2019 & 2032
- Table 91: Global Molecular Spectroscopy Market Revenue Million Forecast, by Type of Spectroscopy 2019 & 2032
- Table 92: Global Molecular Spectroscopy Market Volume K Unit Forecast, by Type of Spectroscopy 2019 & 2032
- Table 93: Global Molecular Spectroscopy Market Revenue Million Forecast, by Application 2019 & 2032
- Table 94: Global Molecular Spectroscopy Market Volume K Unit Forecast, by Application 2019 & 2032
- Table 95: Global Molecular Spectroscopy Market Revenue Million Forecast, by Country 2019 & 2032
- Table 96: Global Molecular Spectroscopy Market Volume K Unit Forecast, by Country 2019 & 2032
- Table 97: China Molecular Spectroscopy Market Revenue (Million) Forecast, by Application 2019 & 2032
- Table 98: China Molecular Spectroscopy Market Volume (K Unit) Forecast, by Application 2019 & 2032
- Table 99: Japan Molecular Spectroscopy Market Revenue (Million) Forecast, by Application 2019 & 2032
- Table 100: Japan Molecular Spectroscopy Market Volume (K Unit) Forecast, by Application 2019 & 2032
- Table 101: India Molecular Spectroscopy Market Revenue (Million) Forecast, by Application 2019 & 2032
- Table 102: India Molecular Spectroscopy Market Volume (K Unit) Forecast, by Application 2019 & 2032
- Table 103: Australia Molecular Spectroscopy Market Revenue (Million) Forecast, by Application 2019 & 2032
- Table 104: Australia Molecular Spectroscopy Market Volume (K Unit) Forecast, by Application 2019 & 2032
- Table 105: South Korea Molecular Spectroscopy Market Revenue (Million) Forecast, by Application 2019 & 2032
- Table 106: South Korea Molecular Spectroscopy Market Volume (K Unit) Forecast, by Application 2019 & 2032
- Table 107: Rest of Asia Pacific Molecular Spectroscopy Market Revenue (Million) Forecast, by Application 2019 & 2032
- Table 108: Rest of Asia Pacific Molecular Spectroscopy Market Volume (K Unit) Forecast, by Application 2019 & 2032
- Table 109: Global Molecular Spectroscopy Market Revenue Million Forecast, by Type of Spectroscopy 2019 & 2032
- Table 110: Global Molecular Spectroscopy Market Volume K Unit Forecast, by Type of Spectroscopy 2019 & 2032
- Table 111: Global Molecular Spectroscopy Market Revenue Million Forecast, by Application 2019 & 2032
- Table 112: Global Molecular Spectroscopy Market Volume K Unit Forecast, by Application 2019 & 2032
- Table 113: Global Molecular Spectroscopy Market Revenue Million Forecast, by Country 2019 & 2032
- Table 114: Global Molecular Spectroscopy Market Volume K Unit Forecast, by Country 2019 & 2032
- Table 115: GCC Molecular Spectroscopy Market Revenue (Million) Forecast, by Application 2019 & 2032
- Table 116: GCC Molecular Spectroscopy Market Volume (K Unit) Forecast, by Application 2019 & 2032
- Table 117: South Africa Molecular Spectroscopy Market Revenue (Million) Forecast, by Application 2019 & 2032
- Table 118: South Africa Molecular Spectroscopy Market Volume (K Unit) Forecast, by Application 2019 & 2032
- Table 119: Rest of Middle East and Africa Molecular Spectroscopy Market Revenue (Million) Forecast, by Application 2019 & 2032
- Table 120: Rest of Middle East and Africa Molecular Spectroscopy Market Volume (K Unit) Forecast, by Application 2019 & 2032
- Table 121: Global Molecular Spectroscopy Market Revenue Million Forecast, by Type of Spectroscopy 2019 & 2032
- Table 122: Global Molecular Spectroscopy Market Volume K Unit Forecast, by Type of Spectroscopy 2019 & 2032
- Table 123: Global Molecular Spectroscopy Market Revenue Million Forecast, by Application 2019 & 2032
- Table 124: Global Molecular Spectroscopy Market Volume K Unit Forecast, by Application 2019 & 2032
- Table 125: Global Molecular Spectroscopy Market Revenue Million Forecast, by Country 2019 & 2032
- Table 126: Global Molecular Spectroscopy Market Volume K Unit Forecast, by Country 2019 & 2032
- Table 127: Brazil Molecular Spectroscopy Market Revenue (Million) Forecast, by Application 2019 & 2032
- Table 128: Brazil Molecular Spectroscopy Market Volume (K Unit) Forecast, by Application 2019 & 2032
- Table 129: Argentina Molecular Spectroscopy Market Revenue (Million) Forecast, by Application 2019 & 2032
- Table 130: Argentina Molecular Spectroscopy Market Volume (K Unit) Forecast, by Application 2019 & 2032
- Table 131: Rest of South America Molecular Spectroscopy Market Revenue (Million) Forecast, by Application 2019 & 2032
- Table 132: Rest of South America Molecular Spectroscopy Market Volume (K Unit) Forecast, by Application 2019 & 2032
Frequently Asked Questions
1. What is the projected Compound Annual Growth Rate (CAGR) of the Molecular Spectroscopy Market?
The projected CAGR is approximately 3.72%.
2. Which companies are prominent players in the Molecular Spectroscopy Market?
Key companies in the market include Horiba Ltd, Bio-Rad Laboratories Inc, Merck KGaA, VIAVI Solutions Inc, Waters Corporation, Danaher Corporation, Agilent Technologies Inc, Thermo Fischer Scientific Inc, Jeol Ltd, Keit Ltd, PerkinElmer Inc, Thorlabs Inc, Bruker Corporation, Shimadzu Corporation.
3. What are the main segments of the Molecular Spectroscopy Market?
The market segments include Type of Spectroscopy, Application.
4. Can you provide details about the market size?
The market size is estimated to be USD 2.87 Million as of 2022.
5. What are some drivers contributing to market growth?
Rapid Adoption in the Pharmaceutical Industry; Penetration of MS Technology in Various Verticals; Increased Emphasis for Discovery of Newer Molecules by Pharmaceuticals.
6. What are the notable trends driving market growth?
The NMR Spectroscopy Segment is Expected to Observe Good Growth Over the Forecast Period.
7. Are there any restraints impacting market growth?
High Cost of Maintenance and Installation Charges; Need of Technically Skilled Personnel.
8. Can you provide examples of recent developments in the market?
N/A
9. What pricing options are available for accessing the report?
Pricing options include single-user, multi-user, and enterprise licenses priced at USD 4750, USD 5250, and USD 8750 respectively.
10. Is the market size provided in terms of value or volume?
The market size is provided in terms of value, measured in Million and volume, measured in K Unit.
11. Are there any specific market keywords associated with the report?
Yes, the market keyword associated with the report is "Molecular Spectroscopy Market," which aids in identifying and referencing the specific market segment covered.
12. How do I determine which pricing option suits my needs best?
The pricing options vary based on user requirements and access needs. Individual users may opt for single-user licenses, while businesses requiring broader access may choose multi-user or enterprise licenses for cost-effective access to the report.
13. Are there any additional resources or data provided in the Molecular Spectroscopy Market report?
While the report offers comprehensive insights, it's advisable to review the specific contents or supplementary materials provided to ascertain if additional resources or data are available.
14. How can I stay updated on further developments or reports in the Molecular Spectroscopy Market?
To stay informed about further developments, trends, and reports in the Molecular Spectroscopy Market, consider subscribing to industry newsletters, following relevant companies and organizations, or regularly checking reputable industry news sources and publications.
Methodology
Step 1 - Identification of Relevant Samples Size from Population Database


Step 2 - Approaches for Defining Global Market Size (Value, Volume* & Price*)

Note*: In applicable scenarios
Step 3 - Data Sources
Primary Research
- Web Analytics
- Survey Reports
- Research Institute
- Latest Research Reports
- Opinion Leaders
Secondary Research
- Annual Reports
- White Paper
- Latest Press Release
- Industry Association
- Paid Database
- Investor Presentations

Step 4 - Data Triangulation
Involves using different sources of information in order to increase the validity of a study
These sources are likely to be stakeholders in a program - participants, other researchers, program staff, other community members, and so on.
Then we put all data in single framework & apply various statistical tools to find out the dynamic on the market.
During the analysis stage, feedback from the stakeholder groups would be compared to determine areas of agreement as well as areas of divergence
