

Key Insights
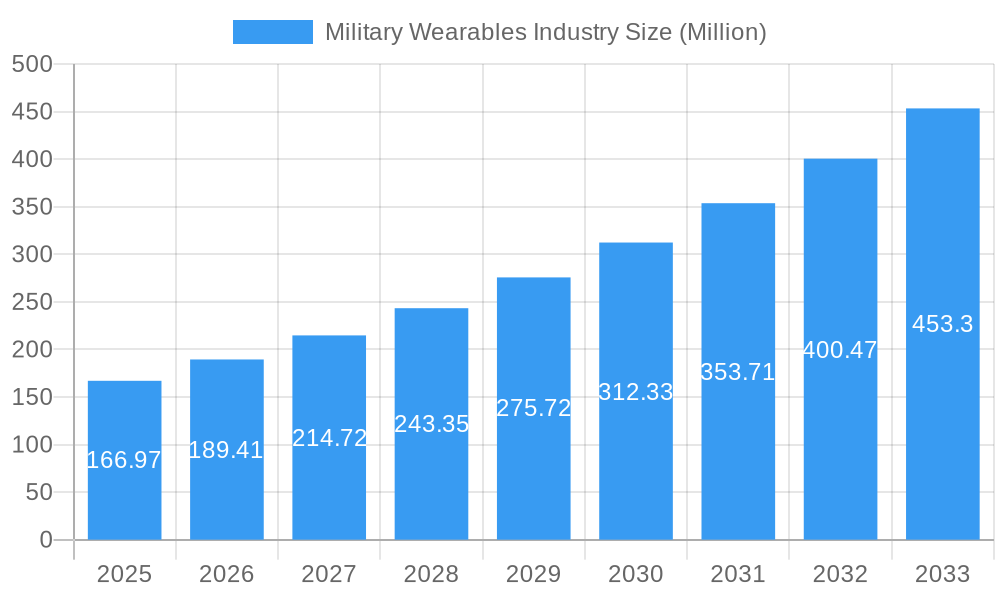
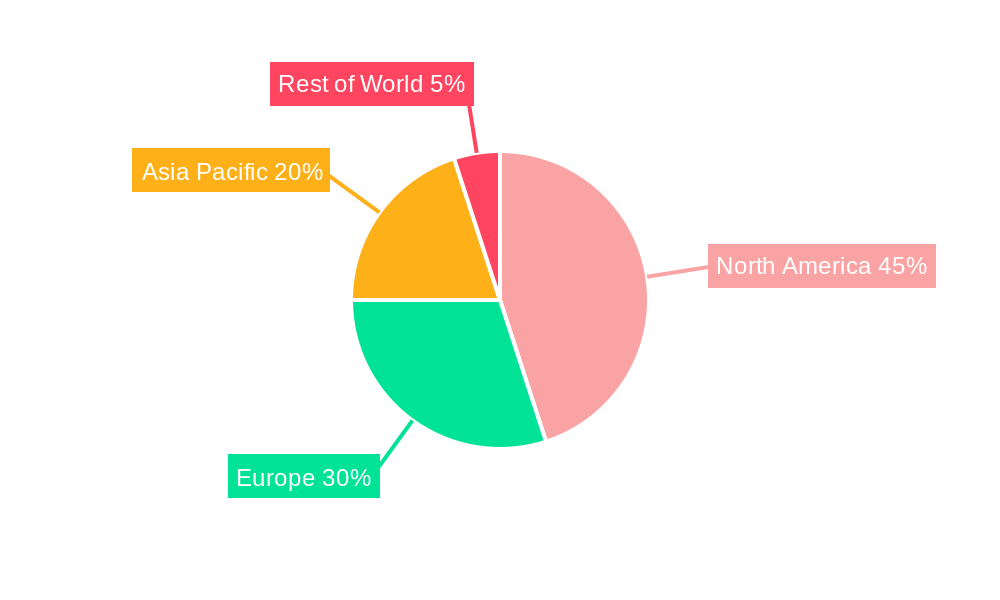
The military wearables market, valued at $166.97 million in 2025, is experiencing robust growth, projected to expand at a compound annual growth rate (CAGR) of 13.58% from 2025 to 2033. This surge is driven by several key factors. Firstly, the increasing demand for enhanced soldier capabilities, including improved situational awareness, communication, and physical protection, is fueling the adoption of advanced wearable technologies. Secondly, technological advancements in areas like miniaturization, power efficiency, and sensor integration are leading to more sophisticated and versatile military wearable devices. Furthermore, government investments in research and development, coupled with a growing focus on enhancing military readiness and effectiveness, are significantly contributing to market expansion. The market is segmented by type (full-body and partial-body exoskeletons) and power source (active and passive exoskeletons). Full-body exoskeletons, offering comprehensive physical augmentation, command a larger market share compared to partial-body alternatives. Similarly, active exoskeletons, utilizing power sources for enhanced performance, are experiencing greater adoption than passive exoskeletons. North America currently holds a dominant market position due to significant technological advancements and substantial defense spending. However, the Asia-Pacific region is expected to witness considerable growth in the coming years, driven by increasing military modernization efforts in countries like China and India.
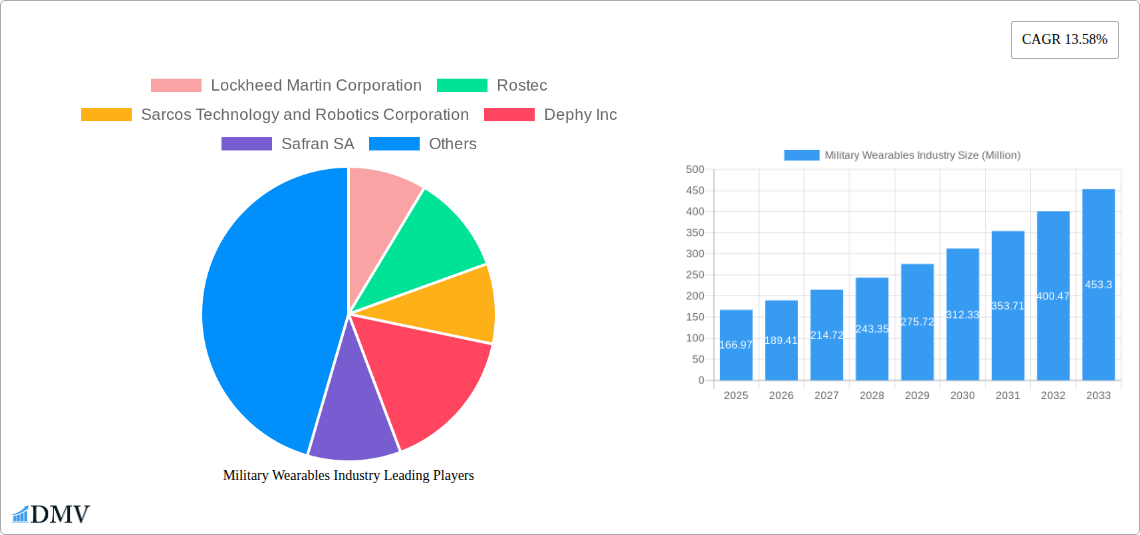
Military Wearables Industry Market Size (In Million)
Market restraints include high initial investment costs associated with developing and deploying advanced wearable technologies, concerns regarding the potential for system failures, and the need for robust cybersecurity measures to prevent data breaches and system vulnerabilities. Nevertheless, ongoing technological progress addressing these challenges and sustained government support should continue to propel market expansion. Key players like Lockheed Martin, Rostec, and Sarcos Technology are driving innovation and shaping the competitive landscape through continuous product development and strategic partnerships. The market's future growth will likely be influenced by factors such as evolving military strategies, emerging technological breakthroughs, and evolving geopolitical dynamics. The continued focus on enhancing soldier performance and operational effectiveness will ensure sustained demand for military wearable technologies throughout the forecast period.
Military Wearables Industry Company Market Share
Military Wearables Industry Market Report: 2019-2033
This comprehensive report provides a detailed analysis of the Military Wearables market, encompassing historical data (2019-2024), the base year (2025), and a robust forecast extending to 2033. We delve into market segmentation, key players, technological advancements, and future growth projections, offering invaluable insights for stakeholders across the defense and technology sectors. The market is projected to reach xx Million by 2033, presenting significant opportunities for investors and industry players alike.
Military Wearables Industry Market Composition & Trends
This section evaluates the competitive landscape, innovation drivers, regulatory frameworks, and market dynamics within the Military Wearables industry. We analyze market concentration, highlighting the share held by key players like Lockheed Martin Corporation, Rostec, and BAE Systems plc. M&A activity is examined, with estimated deal values reaching xx Million in the past five years. The report also explores the impact of substitute products and evolving end-user needs on market growth and future trajectories.
- Market Concentration: A detailed breakdown of market share distribution among leading players, including Lockheed Martin Corporation, Rostec, and BAE Systems plc, revealing the level of competition and market dominance.
- Innovation Catalysts: Analysis of technological advancements, research & development spending, and the influence of government initiatives on driving innovation within the military wearables sector. This includes advancements in materials science, power sources, and sensor technology.
- Regulatory Landscape: An assessment of the regulatory environment across key regions, including considerations for safety, security, and export controls, as well as their influence on market growth and product development.
- Substitute Products: An examination of alternative technologies or solutions that could potentially compete with or replace military wearables, and their potential impact on market share.
- End-User Profiles: A deep dive into the characteristics and needs of end-users (military branches, special forces, etc.), informing manufacturers about their specific requirements and preferences.
- M&A Activities: A comprehensive review of recent mergers and acquisitions in the military wearables industry, analyzing deal values (estimated at xx Million in total for the period 2019-2024) and their impact on market consolidation.
Military Wearables Industry Industry Evolution
This section provides a comprehensive analysis of the Military Wearables market's evolution from 2019 to 2033. We examine growth trajectories, noting a Compound Annual Growth Rate (CAGR) of xx% during the historical period (2019-2024), and projecting a CAGR of xx% for the forecast period (2025-2033). Technological advancements, such as improvements in power efficiency, miniaturization, and enhanced sensor integration, are explored in detail. The report further analyzes the shifting demands of military personnel, focusing on the increasing need for lightweight, durable, and adaptable wearable technology. This includes a discussion on the adoption of various exoskeleton types and the impact on soldier performance and readiness. The increasing focus on human-machine interface optimization and the integration of artificial intelligence (AI) are also analyzed.
Leading Regions, Countries, or Segments in Military Wearables Industry
This section identifies the leading regions and segments within the Military Wearables market. We examine both Type (Full-body Exoskeleton, Partial-body Exoskeleton) and Power (Active Exoskeleton, Passive Exoskeleton) segments, determining which dominates based on market size and growth potential. North America and Europe are expected to remain key regions.
- Key Drivers:
- High levels of military spending in North America and Europe.
- Stringent regulatory frameworks focused on safety and performance.
- Significant investments in R&D and technological innovation.
- Growing adoption of advanced materials and manufacturing techniques.
- Dominance Factors: This section provides a detailed analysis of the factors contributing to the dominance of a particular region or segment, including, but not limited to: government support, technological advancements, and market maturity. The analysis explores the impact of geopolitical events and evolving military doctrines on market trends.
Military Wearables Industry Product Innovations
Recent innovations focus on enhancing soldier mobility, strength, and endurance. Lightweight materials, improved power management systems, and advanced sensor integration are key advancements. For example, the integration of AI and machine learning allows for real-time adjustments and improved performance. New exoskeleton designs are prioritizing ergonomics and user comfort, leading to greater acceptance and longer operational periods. Unique selling propositions are centered around enhanced operational capabilities, improved soldier safety, and reduced fatigue.
Propelling Factors for Military Wearables Industry Growth
Several factors are driving the growth of the military wearables market: increasing military expenditure globally (estimated at xx Million annually in 2025), the ongoing demand for enhanced soldier capabilities, and technological advancements leading to improved performance and functionalities. Government initiatives and funding programs play a crucial role in stimulating innovation and adoption of military wearables.
Obstacles in the Military Wearables Industry Market
The industry faces challenges including high development costs, the complexity of integrating different technologies seamlessly, and the need for rigorous testing and certification to meet stringent military standards. Supply chain disruptions and competitive pressures from various established defense contractors also pose significant obstacles. These combined factors can impact time-to-market and profitability.
Future Opportunities in Military Wearables Industry
Future growth hinges on integrating advanced technologies like AI, augmented reality (AR), and improved power sources. Expanding applications into new military segments and exploring partnerships with commercial technology firms represent significant opportunities. This includes the development of more affordable and adaptable exoskeleton designs for wider adoption. The focus on reducing weight and size while improving strength and endurance will create significant future demand.
Major Players in the Military Wearables Industry Ecosystem
- Lockheed Martin Corporation (Lockheed Martin Corporation)
- Rostec
- Sarcos Technology and Robotics Corporation (Sarcos Technology and Robotics Corporation)
- Dephy Inc
- Safran SA (Safran SA)
- ASELSAN A S (ASELSAN A S)
- Mawashi Science & Technology
- SRI International (SRI International)
- BAE Systems plc (BAE Systems plc)
- Bionic Power Inc
Key Developments in Military Wearables Industry Industry
- September 2023: NCSIST unveils a new powered exoskeleton suit designed for wartime and disaster relief, enhancing mobility and reducing fatigue.
- August 2022: DEVCOM funds HeroWear and Vanderbilt University to develop the SABER passive exoskeleton for the US Army.
- October 2021: Taiwan unveils a locally-made powered exoskeleton suit for military and disaster relief applications.
Strategic Military Wearables Industry Market Forecast
The Military Wearables market is poised for significant growth, driven by continued investment in defense technologies, technological advancements, and the increasing demand for enhancing soldier capabilities. The market is expected to experience robust growth in the coming years, spurred by innovations in materials science, power systems, and human-machine interfaces. This report offers a detailed forecast, providing valuable insights into potential market opportunities and investment prospects.
Military Wearables Industry Segmentation
- 1. Production Analysis
- 2. Consumption Analysis
- 3. Import Market Analysis (Value & Volume)
- 4. Export Market Analysis (Value & Volume)
- 5. Price Trend Analysis
Military Wearables Industry Segmentation By Geography
-
1. North America
- 1.1. United States
- 1.2. Canada
- 1.3. Mexico
-
2. South America
- 2.1. Brazil
- 2.2. Argentina
- 2.3. Rest of South America
-
3. Europe
- 3.1. United Kingdom
- 3.2. Germany
- 3.3. France
- 3.4. Italy
- 3.5. Spain
- 3.6. Russia
- 3.7. Benelux
- 3.8. Nordics
- 3.9. Rest of Europe
-
4. Middle East & Africa
- 4.1. Turkey
- 4.2. Israel
- 4.3. GCC
- 4.4. North Africa
- 4.5. South Africa
- 4.6. Rest of Middle East & Africa
-
5. Asia Pacific
- 5.1. China
- 5.2. India
- 5.3. Japan
- 5.4. South Korea
- 5.5. ASEAN
- 5.6. Oceania
- 5.7. Rest of Asia Pacific
Military Wearables Industry Regional Market Share
Geographic Coverage of Military Wearables Industry
Military Wearables Industry REPORT HIGHLIGHTS
| Aspects | Details |
|---|---|
| Study Period | 2020-2034 |
| Base Year | 2025 |
| Estimated Year | 2026 |
| Forecast Period | 2026-2034 |
| Historical Period | 2020-2025 |
| Growth Rate | CAGR of 13.58% from 2020-2034 |
| Segmentation |
|
Table of Contents
- 1. Introduction
- 1.1. Research Scope
- 1.2. Market Segmentation
- 1.3. Research Objective
- 1.4. Definitions and Assumptions
- 2. Executive Summary
- 2.1. Market Snapshot
- 3. Market Dynamics
- 3.1. Market Drivers
- 3.2. Market Restrains
- 3.3. Market Trends
- 3.4. Market Opportunities
- 4. Market Factor Analysis
- 4.1. Porters Five Forces
- 4.1.1. Bargaining Power of Suppliers
- 4.1.2. Bargaining Power of Buyers
- 4.1.3. Threat of New Entrants
- 4.1.4. Threat of Substitutes
- 4.1.5. Competitive Rivalry
- 4.2. PESTEL analysis
- 4.3. BCG Analysis
- 4.3.1. Stars (High Growth, High Market Share)
- 4.3.2. Cash Cows (Low Growth, High Market Share)
- 4.3.3. Question Mark (High Growth, Low Market Share)
- 4.3.4. Dogs (Low Growth, Low Market Share)
- 4.4. Ansoff Matrix Analysis
- 4.5. Supply Chain Analysis
- 4.6. Regulatory Landscape
- 4.7. Current Market Potential and Opportunity Assessment (TAM–SAM–SOM Framework)
- 4.8. DMV Analyst Note
- 4.1. Porters Five Forces
- 5. Market Analysis, Insights and Forecast 2021-2033
- 5.1. Market Analysis, Insights and Forecast - by Production Analysis
- 5.2. Market Analysis, Insights and Forecast - by Consumption Analysis
- 5.3. Market Analysis, Insights and Forecast - by Import Market Analysis (Value & Volume)
- 5.4. Market Analysis, Insights and Forecast - by Export Market Analysis (Value & Volume)
- 5.5. Market Analysis, Insights and Forecast - by Price Trend Analysis
- 5.6. Market Analysis, Insights and Forecast - by Region
- 5.6.1. North America
- 5.6.2. South America
- 5.6.3. Europe
- 5.6.4. Middle East & Africa
- 5.6.5. Asia Pacific
- 6. Global Military Wearables Industry Analysis, Insights and Forecast, 2021-2033
- 6.1. Market Analysis, Insights and Forecast - by Production Analysis
- 6.2. Market Analysis, Insights and Forecast - by Consumption Analysis
- 6.3. Market Analysis, Insights and Forecast - by Import Market Analysis (Value & Volume)
- 6.4. Market Analysis, Insights and Forecast - by Export Market Analysis (Value & Volume)
- 6.5. Market Analysis, Insights and Forecast - by Price Trend Analysis
- 7. North America Military Wearables Industry Analysis, Insights and Forecast, 2020-2032
- 7.1. Market Analysis, Insights and Forecast - by Production Analysis
- 7.2. Market Analysis, Insights and Forecast - by Consumption Analysis
- 7.3. Market Analysis, Insights and Forecast - by Import Market Analysis (Value & Volume)
- 7.4. Market Analysis, Insights and Forecast - by Export Market Analysis (Value & Volume)
- 7.5. Market Analysis, Insights and Forecast - by Price Trend Analysis
- 8. South America Military Wearables Industry Analysis, Insights and Forecast, 2020-2032
- 8.1. Market Analysis, Insights and Forecast - by Production Analysis
- 8.2. Market Analysis, Insights and Forecast - by Consumption Analysis
- 8.3. Market Analysis, Insights and Forecast - by Import Market Analysis (Value & Volume)
- 8.4. Market Analysis, Insights and Forecast - by Export Market Analysis (Value & Volume)
- 8.5. Market Analysis, Insights and Forecast - by Price Trend Analysis
- 9. Europe Military Wearables Industry Analysis, Insights and Forecast, 2020-2032
- 9.1. Market Analysis, Insights and Forecast - by Production Analysis
- 9.2. Market Analysis, Insights and Forecast - by Consumption Analysis
- 9.3. Market Analysis, Insights and Forecast - by Import Market Analysis (Value & Volume)
- 9.4. Market Analysis, Insights and Forecast - by Export Market Analysis (Value & Volume)
- 9.5. Market Analysis, Insights and Forecast - by Price Trend Analysis
- 10. Middle East & Africa Military Wearables Industry Analysis, Insights and Forecast, 2020-2032
- 10.1. Market Analysis, Insights and Forecast - by Production Analysis
- 10.2. Market Analysis, Insights and Forecast - by Consumption Analysis
- 10.3. Market Analysis, Insights and Forecast - by Import Market Analysis (Value & Volume)
- 10.4. Market Analysis, Insights and Forecast - by Export Market Analysis (Value & Volume)
- 10.5. Market Analysis, Insights and Forecast - by Price Trend Analysis
- 11. Asia Pacific Military Wearables Industry Analysis, Insights and Forecast, 2020-2032
- 11.1. Market Analysis, Insights and Forecast - by Production Analysis
- 11.2. Market Analysis, Insights and Forecast - by Consumption Analysis
- 11.3. Market Analysis, Insights and Forecast - by Import Market Analysis (Value & Volume)
- 11.4. Market Analysis, Insights and Forecast - by Export Market Analysis (Value & Volume)
- 11.5. Market Analysis, Insights and Forecast - by Price Trend Analysis
- 12. Competitive Analysis
- 12.1. Company Profiles
- 12.1.1 Lockheed Martin Corporation
- 12.1.1.1. Company Overview
- 12.1.1.2. Products
- 12.1.1.3. Company Financials
- 12.1.1.4. SWOT Analysis
- 12.1.2 Rostec
- 12.1.2.1. Company Overview
- 12.1.2.2. Products
- 12.1.2.3. Company Financials
- 12.1.2.4. SWOT Analysis
- 12.1.3 Sarcos Technology and Robotics Corporation
- 12.1.3.1. Company Overview
- 12.1.3.2. Products
- 12.1.3.3. Company Financials
- 12.1.3.4. SWOT Analysis
- 12.1.4 Dephy Inc
- 12.1.4.1. Company Overview
- 12.1.4.2. Products
- 12.1.4.3. Company Financials
- 12.1.4.4. SWOT Analysis
- 12.1.5 Safran SA
- 12.1.5.1. Company Overview
- 12.1.5.2. Products
- 12.1.5.3. Company Financials
- 12.1.5.4. SWOT Analysis
- 12.1.6 ASELSAN A S
- 12.1.6.1. Company Overview
- 12.1.6.2. Products
- 12.1.6.3. Company Financials
- 12.1.6.4. SWOT Analysis
- 12.1.7 Mawashi Science & Technology
- 12.1.7.1. Company Overview
- 12.1.7.2. Products
- 12.1.7.3. Company Financials
- 12.1.7.4. SWOT Analysis
- 12.1.8 SRI Internationa
- 12.1.8.1. Company Overview
- 12.1.8.2. Products
- 12.1.8.3. Company Financials
- 12.1.8.4. SWOT Analysis
- 12.1.9 BAE Systems plc
- 12.1.9.1. Company Overview
- 12.1.9.2. Products
- 12.1.9.3. Company Financials
- 12.1.9.4. SWOT Analysis
- 12.1.10 Bionic Power Inc
- 12.1.10.1. Company Overview
- 12.1.10.2. Products
- 12.1.10.3. Company Financials
- 12.1.10.4. SWOT Analysis
- 12.1.1 Lockheed Martin Corporation
- 12.2. Market Entropy
- 12.2.1 Company's Key Areas Served
- 12.2.2 Recent Developments
- 12.3. Company Market Share Analysis 2025
- 12.3.1 Top 5 Companies Market Share Analysis
- 12.3.2 Top 3 Companies Market Share Analysis
- 12.4. List of Potential Customers
- 13. Research Methodology
List of Figures
- Figure 1: Global Military Wearables Industry Revenue Breakdown (Million, %) by Region 2025 & 2033
- Figure 2: North America Military Wearables Industry Revenue (Million), by Production Analysis 2025 & 2033
- Figure 3: North America Military Wearables Industry Revenue Share (%), by Production Analysis 2025 & 2033
- Figure 4: North America Military Wearables Industry Revenue (Million), by Consumption Analysis 2025 & 2033
- Figure 5: North America Military Wearables Industry Revenue Share (%), by Consumption Analysis 2025 & 2033
- Figure 6: North America Military Wearables Industry Revenue (Million), by Import Market Analysis (Value & Volume) 2025 & 2033
- Figure 7: North America Military Wearables Industry Revenue Share (%), by Import Market Analysis (Value & Volume) 2025 & 2033
- Figure 8: North America Military Wearables Industry Revenue (Million), by Export Market Analysis (Value & Volume) 2025 & 2033
- Figure 9: North America Military Wearables Industry Revenue Share (%), by Export Market Analysis (Value & Volume) 2025 & 2033
- Figure 10: North America Military Wearables Industry Revenue (Million), by Price Trend Analysis 2025 & 2033
- Figure 11: North America Military Wearables Industry Revenue Share (%), by Price Trend Analysis 2025 & 2033
- Figure 12: North America Military Wearables Industry Revenue (Million), by Country 2025 & 2033
- Figure 13: North America Military Wearables Industry Revenue Share (%), by Country 2025 & 2033
- Figure 14: South America Military Wearables Industry Revenue (Million), by Production Analysis 2025 & 2033
- Figure 15: South America Military Wearables Industry Revenue Share (%), by Production Analysis 2025 & 2033
- Figure 16: South America Military Wearables Industry Revenue (Million), by Consumption Analysis 2025 & 2033
- Figure 17: South America Military Wearables Industry Revenue Share (%), by Consumption Analysis 2025 & 2033
- Figure 18: South America Military Wearables Industry Revenue (Million), by Import Market Analysis (Value & Volume) 2025 & 2033
- Figure 19: South America Military Wearables Industry Revenue Share (%), by Import Market Analysis (Value & Volume) 2025 & 2033
- Figure 20: South America Military Wearables Industry Revenue (Million), by Export Market Analysis (Value & Volume) 2025 & 2033
- Figure 21: South America Military Wearables Industry Revenue Share (%), by Export Market Analysis (Value & Volume) 2025 & 2033
- Figure 22: South America Military Wearables Industry Revenue (Million), by Price Trend Analysis 2025 & 2033
- Figure 23: South America Military Wearables Industry Revenue Share (%), by Price Trend Analysis 2025 & 2033
- Figure 24: South America Military Wearables Industry Revenue (Million), by Country 2025 & 2033
- Figure 25: South America Military Wearables Industry Revenue Share (%), by Country 2025 & 2033
- Figure 26: Europe Military Wearables Industry Revenue (Million), by Production Analysis 2025 & 2033
- Figure 27: Europe Military Wearables Industry Revenue Share (%), by Production Analysis 2025 & 2033
- Figure 28: Europe Military Wearables Industry Revenue (Million), by Consumption Analysis 2025 & 2033
- Figure 29: Europe Military Wearables Industry Revenue Share (%), by Consumption Analysis 2025 & 2033
- Figure 30: Europe Military Wearables Industry Revenue (Million), by Import Market Analysis (Value & Volume) 2025 & 2033
- Figure 31: Europe Military Wearables Industry Revenue Share (%), by Import Market Analysis (Value & Volume) 2025 & 2033
- Figure 32: Europe Military Wearables Industry Revenue (Million), by Export Market Analysis (Value & Volume) 2025 & 2033
- Figure 33: Europe Military Wearables Industry Revenue Share (%), by Export Market Analysis (Value & Volume) 2025 & 2033
- Figure 34: Europe Military Wearables Industry Revenue (Million), by Price Trend Analysis 2025 & 2033
- Figure 35: Europe Military Wearables Industry Revenue Share (%), by Price Trend Analysis 2025 & 2033
- Figure 36: Europe Military Wearables Industry Revenue (Million), by Country 2025 & 2033
- Figure 37: Europe Military Wearables Industry Revenue Share (%), by Country 2025 & 2033
- Figure 38: Middle East & Africa Military Wearables Industry Revenue (Million), by Production Analysis 2025 & 2033
- Figure 39: Middle East & Africa Military Wearables Industry Revenue Share (%), by Production Analysis 2025 & 2033
- Figure 40: Middle East & Africa Military Wearables Industry Revenue (Million), by Consumption Analysis 2025 & 2033
- Figure 41: Middle East & Africa Military Wearables Industry Revenue Share (%), by Consumption Analysis 2025 & 2033
- Figure 42: Middle East & Africa Military Wearables Industry Revenue (Million), by Import Market Analysis (Value & Volume) 2025 & 2033
- Figure 43: Middle East & Africa Military Wearables Industry Revenue Share (%), by Import Market Analysis (Value & Volume) 2025 & 2033
- Figure 44: Middle East & Africa Military Wearables Industry Revenue (Million), by Export Market Analysis (Value & Volume) 2025 & 2033
- Figure 45: Middle East & Africa Military Wearables Industry Revenue Share (%), by Export Market Analysis (Value & Volume) 2025 & 2033
- Figure 46: Middle East & Africa Military Wearables Industry Revenue (Million), by Price Trend Analysis 2025 & 2033
- Figure 47: Middle East & Africa Military Wearables Industry Revenue Share (%), by Price Trend Analysis 2025 & 2033
- Figure 48: Middle East & Africa Military Wearables Industry Revenue (Million), by Country 2025 & 2033
- Figure 49: Middle East & Africa Military Wearables Industry Revenue Share (%), by Country 2025 & 2033
- Figure 50: Asia Pacific Military Wearables Industry Revenue (Million), by Production Analysis 2025 & 2033
- Figure 51: Asia Pacific Military Wearables Industry Revenue Share (%), by Production Analysis 2025 & 2033
- Figure 52: Asia Pacific Military Wearables Industry Revenue (Million), by Consumption Analysis 2025 & 2033
- Figure 53: Asia Pacific Military Wearables Industry Revenue Share (%), by Consumption Analysis 2025 & 2033
- Figure 54: Asia Pacific Military Wearables Industry Revenue (Million), by Import Market Analysis (Value & Volume) 2025 & 2033
- Figure 55: Asia Pacific Military Wearables Industry Revenue Share (%), by Import Market Analysis (Value & Volume) 2025 & 2033
- Figure 56: Asia Pacific Military Wearables Industry Revenue (Million), by Export Market Analysis (Value & Volume) 2025 & 2033
- Figure 57: Asia Pacific Military Wearables Industry Revenue Share (%), by Export Market Analysis (Value & Volume) 2025 & 2033
- Figure 58: Asia Pacific Military Wearables Industry Revenue (Million), by Price Trend Analysis 2025 & 2033
- Figure 59: Asia Pacific Military Wearables Industry Revenue Share (%), by Price Trend Analysis 2025 & 2033
- Figure 60: Asia Pacific Military Wearables Industry Revenue (Million), by Country 2025 & 2033
- Figure 61: Asia Pacific Military Wearables Industry Revenue Share (%), by Country 2025 & 2033
List of Tables
- Table 1: Global Military Wearables Industry Revenue Million Forecast, by Production Analysis 2020 & 2033
- Table 2: Global Military Wearables Industry Revenue Million Forecast, by Consumption Analysis 2020 & 2033
- Table 3: Global Military Wearables Industry Revenue Million Forecast, by Import Market Analysis (Value & Volume) 2020 & 2033
- Table 4: Global Military Wearables Industry Revenue Million Forecast, by Export Market Analysis (Value & Volume) 2020 & 2033
- Table 5: Global Military Wearables Industry Revenue Million Forecast, by Price Trend Analysis 2020 & 2033
- Table 6: Global Military Wearables Industry Revenue Million Forecast, by Region 2020 & 2033
- Table 7: Global Military Wearables Industry Revenue Million Forecast, by Production Analysis 2020 & 2033
- Table 8: Global Military Wearables Industry Revenue Million Forecast, by Consumption Analysis 2020 & 2033
- Table 9: Global Military Wearables Industry Revenue Million Forecast, by Import Market Analysis (Value & Volume) 2020 & 2033
- Table 10: Global Military Wearables Industry Revenue Million Forecast, by Export Market Analysis (Value & Volume) 2020 & 2033
- Table 11: Global Military Wearables Industry Revenue Million Forecast, by Price Trend Analysis 2020 & 2033
- Table 12: Global Military Wearables Industry Revenue Million Forecast, by Country 2020 & 2033
- Table 13: United States Military Wearables Industry Revenue (Million) Forecast, by Application 2020 & 2033
- Table 14: Canada Military Wearables Industry Revenue (Million) Forecast, by Application 2020 & 2033
- Table 15: Mexico Military Wearables Industry Revenue (Million) Forecast, by Application 2020 & 2033
- Table 16: Global Military Wearables Industry Revenue Million Forecast, by Production Analysis 2020 & 2033
- Table 17: Global Military Wearables Industry Revenue Million Forecast, by Consumption Analysis 2020 & 2033
- Table 18: Global Military Wearables Industry Revenue Million Forecast, by Import Market Analysis (Value & Volume) 2020 & 2033
- Table 19: Global Military Wearables Industry Revenue Million Forecast, by Export Market Analysis (Value & Volume) 2020 & 2033
- Table 20: Global Military Wearables Industry Revenue Million Forecast, by Price Trend Analysis 2020 & 2033
- Table 21: Global Military Wearables Industry Revenue Million Forecast, by Country 2020 & 2033
- Table 22: Brazil Military Wearables Industry Revenue (Million) Forecast, by Application 2020 & 2033
- Table 23: Argentina Military Wearables Industry Revenue (Million) Forecast, by Application 2020 & 2033
- Table 24: Rest of South America Military Wearables Industry Revenue (Million) Forecast, by Application 2020 & 2033
- Table 25: Global Military Wearables Industry Revenue Million Forecast, by Production Analysis 2020 & 2033
- Table 26: Global Military Wearables Industry Revenue Million Forecast, by Consumption Analysis 2020 & 2033
- Table 27: Global Military Wearables Industry Revenue Million Forecast, by Import Market Analysis (Value & Volume) 2020 & 2033
- Table 28: Global Military Wearables Industry Revenue Million Forecast, by Export Market Analysis (Value & Volume) 2020 & 2033
- Table 29: Global Military Wearables Industry Revenue Million Forecast, by Price Trend Analysis 2020 & 2033
- Table 30: Global Military Wearables Industry Revenue Million Forecast, by Country 2020 & 2033
- Table 31: United Kingdom Military Wearables Industry Revenue (Million) Forecast, by Application 2020 & 2033
- Table 32: Germany Military Wearables Industry Revenue (Million) Forecast, by Application 2020 & 2033
- Table 33: France Military Wearables Industry Revenue (Million) Forecast, by Application 2020 & 2033
- Table 34: Italy Military Wearables Industry Revenue (Million) Forecast, by Application 2020 & 2033
- Table 35: Spain Military Wearables Industry Revenue (Million) Forecast, by Application 2020 & 2033
- Table 36: Russia Military Wearables Industry Revenue (Million) Forecast, by Application 2020 & 2033
- Table 37: Benelux Military Wearables Industry Revenue (Million) Forecast, by Application 2020 & 2033
- Table 38: Nordics Military Wearables Industry Revenue (Million) Forecast, by Application 2020 & 2033
- Table 39: Rest of Europe Military Wearables Industry Revenue (Million) Forecast, by Application 2020 & 2033
- Table 40: Global Military Wearables Industry Revenue Million Forecast, by Production Analysis 2020 & 2033
- Table 41: Global Military Wearables Industry Revenue Million Forecast, by Consumption Analysis 2020 & 2033
- Table 42: Global Military Wearables Industry Revenue Million Forecast, by Import Market Analysis (Value & Volume) 2020 & 2033
- Table 43: Global Military Wearables Industry Revenue Million Forecast, by Export Market Analysis (Value & Volume) 2020 & 2033
- Table 44: Global Military Wearables Industry Revenue Million Forecast, by Price Trend Analysis 2020 & 2033
- Table 45: Global Military Wearables Industry Revenue Million Forecast, by Country 2020 & 2033
- Table 46: Turkey Military Wearables Industry Revenue (Million) Forecast, by Application 2020 & 2033
- Table 47: Israel Military Wearables Industry Revenue (Million) Forecast, by Application 2020 & 2033
- Table 48: GCC Military Wearables Industry Revenue (Million) Forecast, by Application 2020 & 2033
- Table 49: North Africa Military Wearables Industry Revenue (Million) Forecast, by Application 2020 & 2033
- Table 50: South Africa Military Wearables Industry Revenue (Million) Forecast, by Application 2020 & 2033
- Table 51: Rest of Middle East & Africa Military Wearables Industry Revenue (Million) Forecast, by Application 2020 & 2033
- Table 52: Global Military Wearables Industry Revenue Million Forecast, by Production Analysis 2020 & 2033
- Table 53: Global Military Wearables Industry Revenue Million Forecast, by Consumption Analysis 2020 & 2033
- Table 54: Global Military Wearables Industry Revenue Million Forecast, by Import Market Analysis (Value & Volume) 2020 & 2033
- Table 55: Global Military Wearables Industry Revenue Million Forecast, by Export Market Analysis (Value & Volume) 2020 & 2033
- Table 56: Global Military Wearables Industry Revenue Million Forecast, by Price Trend Analysis 2020 & 2033
- Table 57: Global Military Wearables Industry Revenue Million Forecast, by Country 2020 & 2033
- Table 58: China Military Wearables Industry Revenue (Million) Forecast, by Application 2020 & 2033
- Table 59: India Military Wearables Industry Revenue (Million) Forecast, by Application 2020 & 2033
- Table 60: Japan Military Wearables Industry Revenue (Million) Forecast, by Application 2020 & 2033
- Table 61: South Korea Military Wearables Industry Revenue (Million) Forecast, by Application 2020 & 2033
- Table 62: ASEAN Military Wearables Industry Revenue (Million) Forecast, by Application 2020 & 2033
- Table 63: Oceania Military Wearables Industry Revenue (Million) Forecast, by Application 2020 & 2033
- Table 64: Rest of Asia Pacific Military Wearables Industry Revenue (Million) Forecast, by Application 2020 & 2033
Frequently Asked Questions
1. What is the projected Compound Annual Growth Rate (CAGR) of the Military Wearables Industry?
The projected CAGR is approximately 13.58%.
2. Which companies are prominent players in the Military Wearables Industry?
Key companies in the market include Lockheed Martin Corporation, Rostec, Sarcos Technology and Robotics Corporation, Dephy Inc, Safran SA, ASELSAN A S, Mawashi Science & Technology, SRI Internationa, BAE Systems plc, Bionic Power Inc.
3. What are the main segments of the Military Wearables Industry?
The market segments include Production Analysis, Consumption Analysis, Import Market Analysis (Value & Volume), Export Market Analysis (Value & Volume), Price Trend Analysis.
4. Can you provide details about the market size?
The market size is estimated to be USD 166.97 Million as of 2022.
5. What are some drivers contributing to market growth?
N/A
6. What are the notable trends driving market growth?
The Active Exoskeleton Segment is Expected to Witness the Highest Growth During the Forecast Period.
7. Are there any restraints impacting market growth?
N/A
8. Can you provide examples of recent developments in the market?
September 2023: The National Chung-Shan Institute of Science and Technology (NCSIST) unveiled the latest version of its in-development locally-made powered exoskeleton suit, which is a mechanized wearable system designed to be used in wartime or during post-disaster rescue and relief missions. The exoskeleton delivers the right torque at the right time to assist knee flexion and extension to reduce the energy wearers expend when crossing terrain, squatting, or kneeling, and to increase mobility and reduce fatigue.
9. What pricing options are available for accessing the report?
Pricing options include single-user, multi-user, and enterprise licenses priced at USD 4750, USD 5250, and USD 8750 respectively.
10. Is the market size provided in terms of value or volume?
The market size is provided in terms of value, measured in Million.
11. Are there any specific market keywords associated with the report?
Yes, the market keyword associated with the report is "Military Wearables Industry," which aids in identifying and referencing the specific market segment covered.
12. How do I determine which pricing option suits my needs best?
The pricing options vary based on user requirements and access needs. Individual users may opt for single-user licenses, while businesses requiring broader access may choose multi-user or enterprise licenses for cost-effective access to the report.
13. Are there any additional resources or data provided in the Military Wearables Industry report?
While the report offers comprehensive insights, it's advisable to review the specific contents or supplementary materials provided to ascertain if additional resources or data are available.
14. How can I stay updated on further developments or reports in the Military Wearables Industry?
To stay informed about further developments, trends, and reports in the Military Wearables Industry, consider subscribing to industry newsletters, following relevant companies and organizations, or regularly checking reputable industry news sources and publications.
Methodology
Step 1 - Identification of Relevant Samples Size from Population Database


Step 2 - Approaches for Defining Global Market Size (Value, Volume* & Price*)

Note*: In applicable scenarios
Step 3 - Data Sources
Primary Research
- Web Analytics
- Survey Reports
- Research Institute
- Latest Research Reports
- Opinion Leaders
Secondary Research
- Annual Reports
- White Paper
- Latest Press Release
- Industry Association
- Paid Database
- Investor Presentations

Step 4 - Data Triangulation
Involves using different sources of information in order to increase the validity of a study
These sources are likely to be stakeholders in a program - participants, other researchers, program staff, other community members, and so on.
Then we put all data in single framework & apply various statistical tools to find out the dynamic on the market.
During the analysis stage, feedback from the stakeholder groups would be compared to determine areas of agreement as well as areas of divergence