

Key Insights
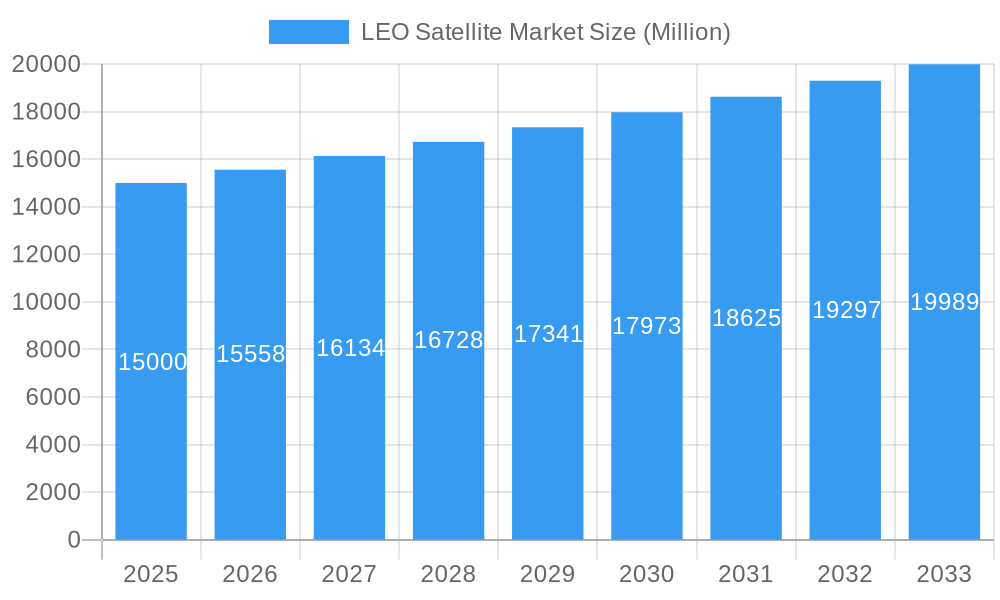
The Low Earth Orbit (LEO) satellite market is projected for significant expansion, propelled by escalating demand for high-speed, low-latency communication, advancements in satellite technology, and diverse application growth across sectors. With a market size of $11.81 billion in the base year 2025, the market is expected to grow at a Compound Annual Growth Rate (CAGR) of 11.9% from 2025 to 2033. Key growth drivers include the urgent need for ubiquitous global internet access, the expansion of the Internet of Things (IoT), and the increasing reliance on satellite-based navigation and Earth observation for environmental monitoring, precision agriculture, and disaster response. The communication application segment and satellites weighing 100-500kg are primary contributors to this growth, offering a balance of payload capacity and cost-effectiveness. Commercial entities dominate market adoption, followed by government and military sectors. Electric propulsion systems are increasingly favored for their economic and environmental benefits over conventional alternatives.
LEO Satellite Market Market Size (In Billion)
Leading companies such as SpaceX, Airbus, and Lockheed Martin are spearheading innovation, focusing on enhanced satellite design, reduced launch expenses, and expanded constellation capabilities. Nevertheless, the market faces challenges including substantial upfront investment, intricate regulatory frameworks, and the growing concern of space debris. Addressing these obstacles is crucial for sustained market growth. Future developments will likely emphasize sustainable space practices, resilient and cost-effective satellite designs, and the strategic deployment of interconnected, smaller satellite constellations.
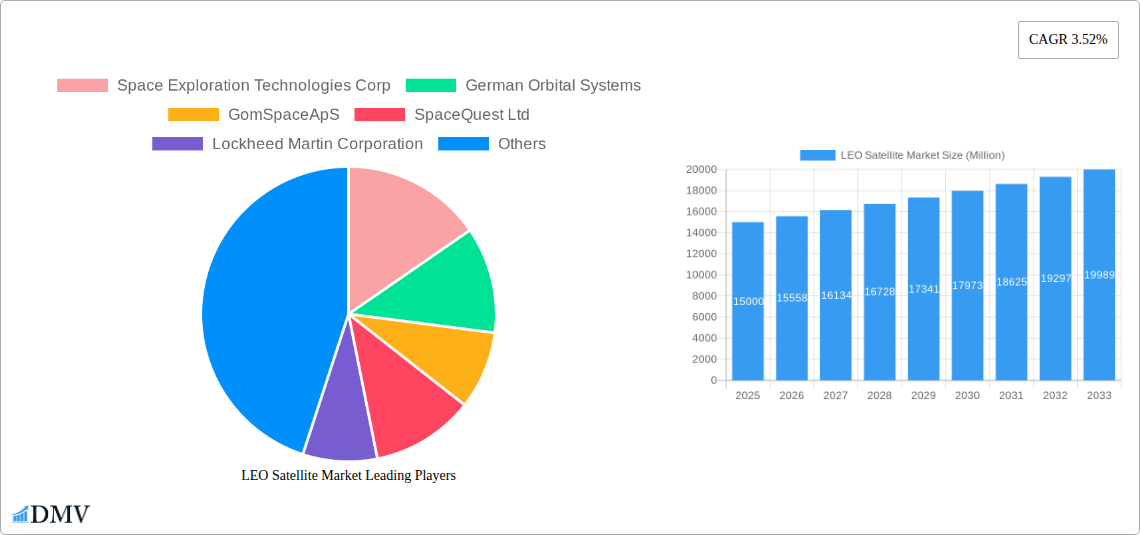
LEO Satellite Market Company Market Share
LEO Satellite Market: A Comprehensive Market Report (2019-2033)
This insightful report provides a detailed analysis of the Low Earth Orbit (LEO) Satellite market, encompassing historical data (2019-2024), the base year (2025), and a comprehensive forecast (2025-2033). It offers a 360° view of this dynamic market, covering market size, segmentation, key players, technological advancements, and future growth projections, crucial for stakeholders seeking strategic insights and investment opportunities. The report's meticulous data analysis and detailed forecasts make it an invaluable resource for businesses, investors, and policymakers navigating the complexities of the LEO satellite landscape. The total market value in 2025 is estimated at xx Million.
LEO Satellite Market Composition & Trends
The LEO satellite market is characterized by a moderately concentrated landscape with significant activity in mergers and acquisitions (M&A). Key players like Space Exploration Technologies Corp, Lockheed Martin Corporation, and Airbus SE hold substantial market share, while smaller, innovative companies such as GomSpace ApS and Astrocast are driving niche market growth. The market's composition is heavily influenced by technological advancements, particularly in miniaturization and electric propulsion, enabling the proliferation of smaller, more affordable satellites. Regulatory frameworks, varying across nations, play a significant role, impacting both market entry and operations. Substitute products, such as terrestrial communication networks, pose a competitive challenge, particularly in certain applications. The end-user base is diverse, including commercial entities, military and government agencies, and research institutions.
- Market Concentration: SpaceX, Lockheed Martin, and Airbus hold a combined xx% market share in 2025, indicating moderate concentration.
- Innovation Catalysts: Miniaturization, electric propulsion, and improved sensor technology.
- Regulatory Landscape: Varied across geographies, impacting launch permits, spectrum allocation, and data regulations.
- Substitute Products: Terrestrial communication networks and high-altitude platforms.
- End-User Profiles: Commercial (xx%), Military & Government (xx%), Other (xx%).
- M&A Activity: Significant M&A activity observed with a total deal value of xx Million in 2024 (including Planet Labs acquisition of VanderSat for $28 Million).
LEO Satellite Market Industry Evolution
The LEO satellite market has experienced substantial growth driven by several factors. The historical period (2019-2024) witnessed a Compound Annual Growth Rate (CAGR) of xx%, fueled by increasing demand for high-bandwidth communication, improved Earth observation capabilities, and the proliferation of smaller, more cost-effective satellites. Technological advancements, particularly in propulsion systems (electric propulsion gaining traction) and satellite miniaturization, have significantly reduced launch costs and improved operational efficiency. The market continues to evolve, with a shift towards constellations of small satellites for various applications, driven by the demand for increased data volume and coverage. The forecast period (2025-2033) projects a CAGR of xx%, suggesting continued robust growth, particularly in the communication and Earth observation segments. Increased investments in space infrastructure and supportive government policies are further accelerating market expansion.
Leading Regions, Countries, or Segments in LEO Satellite Market
The North American region dominates the LEO satellite market, driven by significant investment in space technology, robust regulatory support, and the presence of major industry players. The communication segment holds the largest market share, followed by Earth observation. Within satellite mass categories, the 10-100kg segment demonstrates significant growth due to the increasing deployment of CubeSats and nanosatellites. Electric propulsion technology is gaining popularity owing to its cost-effectiveness and operational advantages.
- Key Drivers (North America): High investment in space technology, supportive government policies, presence of major players.
- Key Drivers (Communication Segment): Rising demand for high-bandwidth communication, IoT growth, and increasing data consumption.
- Key Drivers (10-100kg Satellite Mass): Cost-effectiveness of CubeSats and nanosatellites, enabling increased deployment.
- Key Drivers (Electric Propulsion): Fuel efficiency, extended mission life, and reduced launch costs.
LEO Satellite Market Product Innovations
Recent innovations in LEO satellites include advancements in miniaturization, leading to smaller, more cost-effective satellites with improved capabilities. The development of advanced sensors and payloads enhances data quality and resolution for Earth observation and communication applications. Furthermore, improvements in propulsion systems, such as electric propulsion, extend satellite lifespan and mission capabilities. These innovations are driving increased adoption and expanding the applications of LEO satellites across various sectors.
Propelling Factors for LEO Satellite Market Growth
Several factors propel the growth of the LEO satellite market. Technological advancements, like miniaturization and improved sensor technology, reduce costs and enhance performance. The increasing demand for high-bandwidth communication, driven by the growth of the Internet of Things (IoT) and increased data consumption, fuels market expansion. Moreover, favorable government policies and increased investment in space exploration and infrastructure contribute to the market's growth.
Obstacles in the LEO Satellite Market
The LEO satellite market faces several challenges. Regulatory hurdles in securing launch permits and spectrum allocation vary geographically, creating barriers to entry. Supply chain disruptions can impact production and deployment schedules, affecting project timelines and increasing costs. Furthermore, intense competition among established players and new entrants creates pressure on pricing and margins.
Future Opportunities in LEO Satellite Market
The LEO satellite market presents several opportunities. The expansion of satellite internet services to underserved regions and the development of new applications in fields like precision agriculture and environmental monitoring are key growth areas. Technological innovations, including improved propulsion systems and advanced sensor technologies, will drive further market expansion. Moreover, the increasing collaboration between government agencies and private companies creates further opportunities for innovation and growth.
Major Players in the LEO Satellite Market Ecosystem
- Space Exploration Technologies Corp
- German Orbital Systems
- GomSpace ApS
- SpaceQuest Ltd
- Lockheed Martin Corporation
- Airbus SE
- Astrocast
- Nano Avionics
- China Aerospace Science and Technology Corporation (CASC)
- Surrey Satellite Technology Ltd
- ROSCOSMOS
- Planet Labs Inc
Key Developments in LEO Satellite Market Industry
- January 2022: Planet Labs launches 44 SuperDove satellites on SpaceX's Falcon 9 rocket, significantly expanding its Earth observation constellation.
- November 2021: Planet Labs acquires VanderSat for approximately $28 Million, strengthening its Earth observation data capabilities.
- January 2021: Astrocast launches 5 satellites for IoT data collection, expanding its network and market reach.
Strategic LEO Satellite Market Market Forecast
The LEO satellite market is poised for continued growth, driven by technological advancements, increasing demand for satellite-based services, and supportive government policies. New applications, such as the expansion of satellite internet connectivity and precision agriculture, offer substantial growth potential. The market's future is bright, with considerable opportunities for both established players and new entrants.
LEO Satellite Market Segmentation
-
1. Application
- 1.1. Communication
- 1.2. Earth Observation
- 1.3. Navigation
- 1.4. Space Observation
- 1.5. Others
-
2. Satellite Mass
- 2.1. 10-100kg
- 2.2. 100-500kg
- 2.3. 500-1000kg
- 2.4. Below 10 Kg
- 2.5. above 1000kg
-
3. End User
- 3.1. Commercial
- 3.2. Military & Government
- 3.3. Other
-
4. Propulsion Tech
- 4.1. Electric
- 4.2. Gas based
- 4.3. Liquid Fuel
LEO Satellite Market Segmentation By Geography
-
1. North America
- 1.1. United States
- 1.2. Canada
- 1.3. Mexico
-
2. South America
- 2.1. Brazil
- 2.2. Argentina
- 2.3. Rest of South America
-
3. Europe
- 3.1. United Kingdom
- 3.2. Germany
- 3.3. France
- 3.4. Italy
- 3.5. Spain
- 3.6. Russia
- 3.7. Benelux
- 3.8. Nordics
- 3.9. Rest of Europe
-
4. Middle East & Africa
- 4.1. Turkey
- 4.2. Israel
- 4.3. GCC
- 4.4. North Africa
- 4.5. South Africa
- 4.6. Rest of Middle East & Africa
-
5. Asia Pacific
- 5.1. China
- 5.2. India
- 5.3. Japan
- 5.4. South Korea
- 5.5. ASEAN
- 5.6. Oceania
- 5.7. Rest of Asia Pacific
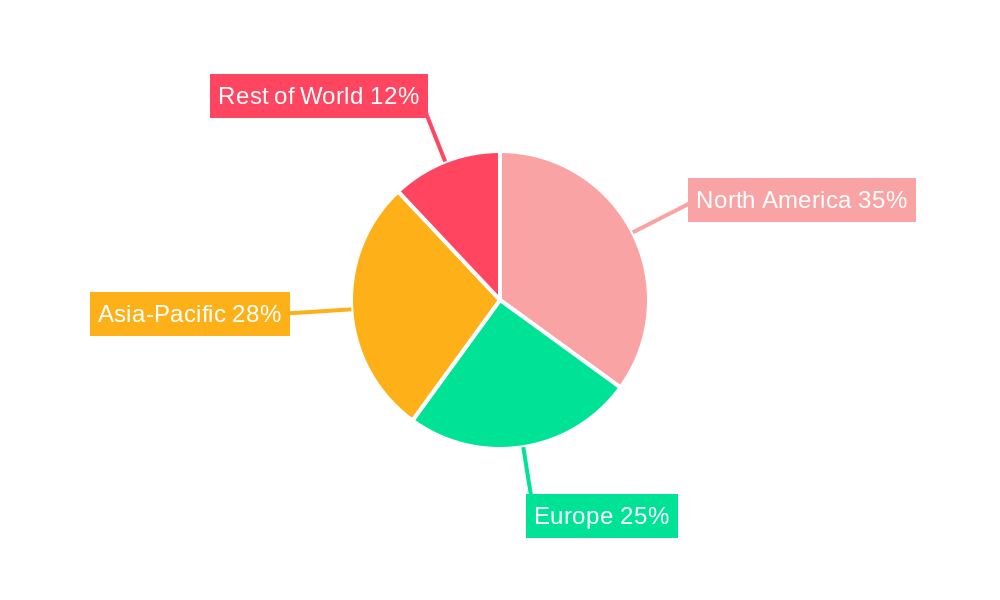
LEO Satellite Market Regional Market Share
Geographic Coverage of LEO Satellite Market
LEO Satellite Market REPORT HIGHLIGHTS
| Aspects | Details |
|---|---|
| Study Period | 2020-2034 |
| Base Year | 2025 |
| Estimated Year | 2026 |
| Forecast Period | 2026-2034 |
| Historical Period | 2020-2025 |
| Growth Rate | CAGR of 11.9% from 2020-2034 |
| Segmentation |
|
Table of Contents
- 1. Introduction
- 1.1. Research Scope
- 1.2. Market Segmentation
- 1.3. Research Objective
- 1.4. Definitions and Assumptions
- 2. Executive Summary
- 2.1. Market Snapshot
- 3. Market Dynamics
- 3.1. Market Drivers
- 3.2. Market Restrains
- 3.3. Market Trends
- 3.4. Market Opportunities
- 4. Market Factor Analysis
- 4.1. Porters Five Forces
- 4.1.1. Bargaining Power of Suppliers
- 4.1.2. Bargaining Power of Buyers
- 4.1.3. Threat of New Entrants
- 4.1.4. Threat of Substitutes
- 4.1.5. Competitive Rivalry
- 4.2. PESTEL analysis
- 4.3. BCG Analysis
- 4.3.1. Stars (High Growth, High Market Share)
- 4.3.2. Cash Cows (Low Growth, High Market Share)
- 4.3.3. Question Mark (High Growth, Low Market Share)
- 4.3.4. Dogs (Low Growth, Low Market Share)
- 4.4. Ansoff Matrix Analysis
- 4.5. Supply Chain Analysis
- 4.6. Regulatory Landscape
- 4.7. Current Market Potential and Opportunity Assessment (TAM–SAM–SOM Framework)
- 4.8. DMV Analyst Note
- 4.1. Porters Five Forces
- 5. Market Analysis, Insights and Forecast 2021-2033
- 5.1. Market Analysis, Insights and Forecast - by Application
- 5.1.1. Communication
- 5.1.2. Earth Observation
- 5.1.3. Navigation
- 5.1.4. Space Observation
- 5.1.5. Others
- 5.2. Market Analysis, Insights and Forecast - by Satellite Mass
- 5.2.1. 10-100kg
- 5.2.2. 100-500kg
- 5.2.3. 500-1000kg
- 5.2.4. Below 10 Kg
- 5.2.5. above 1000kg
- 5.3. Market Analysis, Insights and Forecast - by End User
- 5.3.1. Commercial
- 5.3.2. Military & Government
- 5.3.3. Other
- 5.4. Market Analysis, Insights and Forecast - by Propulsion Tech
- 5.4.1. Electric
- 5.4.2. Gas based
- 5.4.3. Liquid Fuel
- 5.5. Market Analysis, Insights and Forecast - by Region
- 5.5.1. North America
- 5.5.2. South America
- 5.5.3. Europe
- 5.5.4. Middle East & Africa
- 5.5.5. Asia Pacific
- 5.1. Market Analysis, Insights and Forecast - by Application
- 6. Global LEO Satellite Market Analysis, Insights and Forecast, 2021-2033
- 6.1. Market Analysis, Insights and Forecast - by Application
- 6.1.1. Communication
- 6.1.2. Earth Observation
- 6.1.3. Navigation
- 6.1.4. Space Observation
- 6.1.5. Others
- 6.2. Market Analysis, Insights and Forecast - by Satellite Mass
- 6.2.1. 10-100kg
- 6.2.2. 100-500kg
- 6.2.3. 500-1000kg
- 6.2.4. Below 10 Kg
- 6.2.5. above 1000kg
- 6.3. Market Analysis, Insights and Forecast - by End User
- 6.3.1. Commercial
- 6.3.2. Military & Government
- 6.3.3. Other
- 6.4. Market Analysis, Insights and Forecast - by Propulsion Tech
- 6.4.1. Electric
- 6.4.2. Gas based
- 6.4.3. Liquid Fuel
- 6.1. Market Analysis, Insights and Forecast - by Application
- 7. North America LEO Satellite Market Analysis, Insights and Forecast, 2020-2032
- 7.1. Market Analysis, Insights and Forecast - by Application
- 7.1.1. Communication
- 7.1.2. Earth Observation
- 7.1.3. Navigation
- 7.1.4. Space Observation
- 7.1.5. Others
- 7.2. Market Analysis, Insights and Forecast - by Satellite Mass
- 7.2.1. 10-100kg
- 7.2.2. 100-500kg
- 7.2.3. 500-1000kg
- 7.2.4. Below 10 Kg
- 7.2.5. above 1000kg
- 7.3. Market Analysis, Insights and Forecast - by End User
- 7.3.1. Commercial
- 7.3.2. Military & Government
- 7.3.3. Other
- 7.4. Market Analysis, Insights and Forecast - by Propulsion Tech
- 7.4.1. Electric
- 7.4.2. Gas based
- 7.4.3. Liquid Fuel
- 7.1. Market Analysis, Insights and Forecast - by Application
- 8. South America LEO Satellite Market Analysis, Insights and Forecast, 2020-2032
- 8.1. Market Analysis, Insights and Forecast - by Application
- 8.1.1. Communication
- 8.1.2. Earth Observation
- 8.1.3. Navigation
- 8.1.4. Space Observation
- 8.1.5. Others
- 8.2. Market Analysis, Insights and Forecast - by Satellite Mass
- 8.2.1. 10-100kg
- 8.2.2. 100-500kg
- 8.2.3. 500-1000kg
- 8.2.4. Below 10 Kg
- 8.2.5. above 1000kg
- 8.3. Market Analysis, Insights and Forecast - by End User
- 8.3.1. Commercial
- 8.3.2. Military & Government
- 8.3.3. Other
- 8.4. Market Analysis, Insights and Forecast - by Propulsion Tech
- 8.4.1. Electric
- 8.4.2. Gas based
- 8.4.3. Liquid Fuel
- 8.1. Market Analysis, Insights and Forecast - by Application
- 9. Europe LEO Satellite Market Analysis, Insights and Forecast, 2020-2032
- 9.1. Market Analysis, Insights and Forecast - by Application
- 9.1.1. Communication
- 9.1.2. Earth Observation
- 9.1.3. Navigation
- 9.1.4. Space Observation
- 9.1.5. Others
- 9.2. Market Analysis, Insights and Forecast - by Satellite Mass
- 9.2.1. 10-100kg
- 9.2.2. 100-500kg
- 9.2.3. 500-1000kg
- 9.2.4. Below 10 Kg
- 9.2.5. above 1000kg
- 9.3. Market Analysis, Insights and Forecast - by End User
- 9.3.1. Commercial
- 9.3.2. Military & Government
- 9.3.3. Other
- 9.4. Market Analysis, Insights and Forecast - by Propulsion Tech
- 9.4.1. Electric
- 9.4.2. Gas based
- 9.4.3. Liquid Fuel
- 9.1. Market Analysis, Insights and Forecast - by Application
- 10. Middle East & Africa LEO Satellite Market Analysis, Insights and Forecast, 2020-2032
- 10.1. Market Analysis, Insights and Forecast - by Application
- 10.1.1. Communication
- 10.1.2. Earth Observation
- 10.1.3. Navigation
- 10.1.4. Space Observation
- 10.1.5. Others
- 10.2. Market Analysis, Insights and Forecast - by Satellite Mass
- 10.2.1. 10-100kg
- 10.2.2. 100-500kg
- 10.2.3. 500-1000kg
- 10.2.4. Below 10 Kg
- 10.2.5. above 1000kg
- 10.3. Market Analysis, Insights and Forecast - by End User
- 10.3.1. Commercial
- 10.3.2. Military & Government
- 10.3.3. Other
- 10.4. Market Analysis, Insights and Forecast - by Propulsion Tech
- 10.4.1. Electric
- 10.4.2. Gas based
- 10.4.3. Liquid Fuel
- 10.1. Market Analysis, Insights and Forecast - by Application
- 11. Asia Pacific LEO Satellite Market Analysis, Insights and Forecast, 2020-2032
- 11.1. Market Analysis, Insights and Forecast - by Application
- 11.1.1. Communication
- 11.1.2. Earth Observation
- 11.1.3. Navigation
- 11.1.4. Space Observation
- 11.1.5. Others
- 11.2. Market Analysis, Insights and Forecast - by Satellite Mass
- 11.2.1. 10-100kg
- 11.2.2. 100-500kg
- 11.2.3. 500-1000kg
- 11.2.4. Below 10 Kg
- 11.2.5. above 1000kg
- 11.3. Market Analysis, Insights and Forecast - by End User
- 11.3.1. Commercial
- 11.3.2. Military & Government
- 11.3.3. Other
- 11.4. Market Analysis, Insights and Forecast - by Propulsion Tech
- 11.4.1. Electric
- 11.4.2. Gas based
- 11.4.3. Liquid Fuel
- 11.1. Market Analysis, Insights and Forecast - by Application
- 12. Competitive Analysis
- 12.1. Company Profiles
- 12.1.1 Space Exploration Technologies Corp
- 12.1.1.1. Company Overview
- 12.1.1.2. Products
- 12.1.1.3. Company Financials
- 12.1.1.4. SWOT Analysis
- 12.1.2 German Orbital Systems
- 12.1.2.1. Company Overview
- 12.1.2.2. Products
- 12.1.2.3. Company Financials
- 12.1.2.4. SWOT Analysis
- 12.1.3 GomSpaceApS
- 12.1.3.1. Company Overview
- 12.1.3.2. Products
- 12.1.3.3. Company Financials
- 12.1.3.4. SWOT Analysis
- 12.1.4 SpaceQuest Ltd
- 12.1.4.1. Company Overview
- 12.1.4.2. Products
- 12.1.4.3. Company Financials
- 12.1.4.4. SWOT Analysis
- 12.1.5 Lockheed Martin Corporation
- 12.1.5.1. Company Overview
- 12.1.5.2. Products
- 12.1.5.3. Company Financials
- 12.1.5.4. SWOT Analysis
- 12.1.6 Airbus SE
- 12.1.6.1. Company Overview
- 12.1.6.2. Products
- 12.1.6.3. Company Financials
- 12.1.6.4. SWOT Analysis
- 12.1.7 Astrocast
- 12.1.7.1. Company Overview
- 12.1.7.2. Products
- 12.1.7.3. Company Financials
- 12.1.7.4. SWOT Analysis
- 12.1.8 Nano Avionics
- 12.1.8.1. Company Overview
- 12.1.8.2. Products
- 12.1.8.3. Company Financials
- 12.1.8.4. SWOT Analysis
- 12.1.9 China Aerospace Science and Technology Corporation (CASC)
- 12.1.9.1. Company Overview
- 12.1.9.2. Products
- 12.1.9.3. Company Financials
- 12.1.9.4. SWOT Analysis
- 12.1.10 Surrey Satellite Technology Ltd
- 12.1.10.1. Company Overview
- 12.1.10.2. Products
- 12.1.10.3. Company Financials
- 12.1.10.4. SWOT Analysis
- 12.1.11 ROSCOSMOS
- 12.1.11.1. Company Overview
- 12.1.11.2. Products
- 12.1.11.3. Company Financials
- 12.1.11.4. SWOT Analysis
- 12.1.12 Planet Labs Inc
- 12.1.12.1. Company Overview
- 12.1.12.2. Products
- 12.1.12.3. Company Financials
- 12.1.12.4. SWOT Analysis
- 12.1.1 Space Exploration Technologies Corp
- 12.2. Market Entropy
- 12.2.1 Company's Key Areas Served
- 12.2.2 Recent Developments
- 12.3. Company Market Share Analysis 2025
- 12.3.1 Top 5 Companies Market Share Analysis
- 12.3.2 Top 3 Companies Market Share Analysis
- 12.4. List of Potential Customers
- 13. Research Methodology
List of Figures
- Figure 1: Global LEO Satellite Market Revenue Breakdown (billion, %) by Region 2025 & 2033
- Figure 2: North America LEO Satellite Market Revenue (billion), by Application 2025 & 2033
- Figure 3: North America LEO Satellite Market Revenue Share (%), by Application 2025 & 2033
- Figure 4: North America LEO Satellite Market Revenue (billion), by Satellite Mass 2025 & 2033
- Figure 5: North America LEO Satellite Market Revenue Share (%), by Satellite Mass 2025 & 2033
- Figure 6: North America LEO Satellite Market Revenue (billion), by End User 2025 & 2033
- Figure 7: North America LEO Satellite Market Revenue Share (%), by End User 2025 & 2033
- Figure 8: North America LEO Satellite Market Revenue (billion), by Propulsion Tech 2025 & 2033
- Figure 9: North America LEO Satellite Market Revenue Share (%), by Propulsion Tech 2025 & 2033
- Figure 10: North America LEO Satellite Market Revenue (billion), by Country 2025 & 2033
- Figure 11: North America LEO Satellite Market Revenue Share (%), by Country 2025 & 2033
- Figure 12: South America LEO Satellite Market Revenue (billion), by Application 2025 & 2033
- Figure 13: South America LEO Satellite Market Revenue Share (%), by Application 2025 & 2033
- Figure 14: South America LEO Satellite Market Revenue (billion), by Satellite Mass 2025 & 2033
- Figure 15: South America LEO Satellite Market Revenue Share (%), by Satellite Mass 2025 & 2033
- Figure 16: South America LEO Satellite Market Revenue (billion), by End User 2025 & 2033
- Figure 17: South America LEO Satellite Market Revenue Share (%), by End User 2025 & 2033
- Figure 18: South America LEO Satellite Market Revenue (billion), by Propulsion Tech 2025 & 2033
- Figure 19: South America LEO Satellite Market Revenue Share (%), by Propulsion Tech 2025 & 2033
- Figure 20: South America LEO Satellite Market Revenue (billion), by Country 2025 & 2033
- Figure 21: South America LEO Satellite Market Revenue Share (%), by Country 2025 & 2033
- Figure 22: Europe LEO Satellite Market Revenue (billion), by Application 2025 & 2033
- Figure 23: Europe LEO Satellite Market Revenue Share (%), by Application 2025 & 2033
- Figure 24: Europe LEO Satellite Market Revenue (billion), by Satellite Mass 2025 & 2033
- Figure 25: Europe LEO Satellite Market Revenue Share (%), by Satellite Mass 2025 & 2033
- Figure 26: Europe LEO Satellite Market Revenue (billion), by End User 2025 & 2033
- Figure 27: Europe LEO Satellite Market Revenue Share (%), by End User 2025 & 2033
- Figure 28: Europe LEO Satellite Market Revenue (billion), by Propulsion Tech 2025 & 2033
- Figure 29: Europe LEO Satellite Market Revenue Share (%), by Propulsion Tech 2025 & 2033
- Figure 30: Europe LEO Satellite Market Revenue (billion), by Country 2025 & 2033
- Figure 31: Europe LEO Satellite Market Revenue Share (%), by Country 2025 & 2033
- Figure 32: Middle East & Africa LEO Satellite Market Revenue (billion), by Application 2025 & 2033
- Figure 33: Middle East & Africa LEO Satellite Market Revenue Share (%), by Application 2025 & 2033
- Figure 34: Middle East & Africa LEO Satellite Market Revenue (billion), by Satellite Mass 2025 & 2033
- Figure 35: Middle East & Africa LEO Satellite Market Revenue Share (%), by Satellite Mass 2025 & 2033
- Figure 36: Middle East & Africa LEO Satellite Market Revenue (billion), by End User 2025 & 2033
- Figure 37: Middle East & Africa LEO Satellite Market Revenue Share (%), by End User 2025 & 2033
- Figure 38: Middle East & Africa LEO Satellite Market Revenue (billion), by Propulsion Tech 2025 & 2033
- Figure 39: Middle East & Africa LEO Satellite Market Revenue Share (%), by Propulsion Tech 2025 & 2033
- Figure 40: Middle East & Africa LEO Satellite Market Revenue (billion), by Country 2025 & 2033
- Figure 41: Middle East & Africa LEO Satellite Market Revenue Share (%), by Country 2025 & 2033
- Figure 42: Asia Pacific LEO Satellite Market Revenue (billion), by Application 2025 & 2033
- Figure 43: Asia Pacific LEO Satellite Market Revenue Share (%), by Application 2025 & 2033
- Figure 44: Asia Pacific LEO Satellite Market Revenue (billion), by Satellite Mass 2025 & 2033
- Figure 45: Asia Pacific LEO Satellite Market Revenue Share (%), by Satellite Mass 2025 & 2033
- Figure 46: Asia Pacific LEO Satellite Market Revenue (billion), by End User 2025 & 2033
- Figure 47: Asia Pacific LEO Satellite Market Revenue Share (%), by End User 2025 & 2033
- Figure 48: Asia Pacific LEO Satellite Market Revenue (billion), by Propulsion Tech 2025 & 2033
- Figure 49: Asia Pacific LEO Satellite Market Revenue Share (%), by Propulsion Tech 2025 & 2033
- Figure 50: Asia Pacific LEO Satellite Market Revenue (billion), by Country 2025 & 2033
- Figure 51: Asia Pacific LEO Satellite Market Revenue Share (%), by Country 2025 & 2033
List of Tables
- Table 1: Global LEO Satellite Market Revenue billion Forecast, by Application 2020 & 2033
- Table 2: Global LEO Satellite Market Revenue billion Forecast, by Satellite Mass 2020 & 2033
- Table 3: Global LEO Satellite Market Revenue billion Forecast, by End User 2020 & 2033
- Table 4: Global LEO Satellite Market Revenue billion Forecast, by Propulsion Tech 2020 & 2033
- Table 5: Global LEO Satellite Market Revenue billion Forecast, by Region 2020 & 2033
- Table 6: Global LEO Satellite Market Revenue billion Forecast, by Application 2020 & 2033
- Table 7: Global LEO Satellite Market Revenue billion Forecast, by Satellite Mass 2020 & 2033
- Table 8: Global LEO Satellite Market Revenue billion Forecast, by End User 2020 & 2033
- Table 9: Global LEO Satellite Market Revenue billion Forecast, by Propulsion Tech 2020 & 2033
- Table 10: Global LEO Satellite Market Revenue billion Forecast, by Country 2020 & 2033
- Table 11: United States LEO Satellite Market Revenue (billion) Forecast, by Application 2020 & 2033
- Table 12: Canada LEO Satellite Market Revenue (billion) Forecast, by Application 2020 & 2033
- Table 13: Mexico LEO Satellite Market Revenue (billion) Forecast, by Application 2020 & 2033
- Table 14: Global LEO Satellite Market Revenue billion Forecast, by Application 2020 & 2033
- Table 15: Global LEO Satellite Market Revenue billion Forecast, by Satellite Mass 2020 & 2033
- Table 16: Global LEO Satellite Market Revenue billion Forecast, by End User 2020 & 2033
- Table 17: Global LEO Satellite Market Revenue billion Forecast, by Propulsion Tech 2020 & 2033
- Table 18: Global LEO Satellite Market Revenue billion Forecast, by Country 2020 & 2033
- Table 19: Brazil LEO Satellite Market Revenue (billion) Forecast, by Application 2020 & 2033
- Table 20: Argentina LEO Satellite Market Revenue (billion) Forecast, by Application 2020 & 2033
- Table 21: Rest of South America LEO Satellite Market Revenue (billion) Forecast, by Application 2020 & 2033
- Table 22: Global LEO Satellite Market Revenue billion Forecast, by Application 2020 & 2033
- Table 23: Global LEO Satellite Market Revenue billion Forecast, by Satellite Mass 2020 & 2033
- Table 24: Global LEO Satellite Market Revenue billion Forecast, by End User 2020 & 2033
- Table 25: Global LEO Satellite Market Revenue billion Forecast, by Propulsion Tech 2020 & 2033
- Table 26: Global LEO Satellite Market Revenue billion Forecast, by Country 2020 & 2033
- Table 27: United Kingdom LEO Satellite Market Revenue (billion) Forecast, by Application 2020 & 2033
- Table 28: Germany LEO Satellite Market Revenue (billion) Forecast, by Application 2020 & 2033
- Table 29: France LEO Satellite Market Revenue (billion) Forecast, by Application 2020 & 2033
- Table 30: Italy LEO Satellite Market Revenue (billion) Forecast, by Application 2020 & 2033
- Table 31: Spain LEO Satellite Market Revenue (billion) Forecast, by Application 2020 & 2033
- Table 32: Russia LEO Satellite Market Revenue (billion) Forecast, by Application 2020 & 2033
- Table 33: Benelux LEO Satellite Market Revenue (billion) Forecast, by Application 2020 & 2033
- Table 34: Nordics LEO Satellite Market Revenue (billion) Forecast, by Application 2020 & 2033
- Table 35: Rest of Europe LEO Satellite Market Revenue (billion) Forecast, by Application 2020 & 2033
- Table 36: Global LEO Satellite Market Revenue billion Forecast, by Application 2020 & 2033
- Table 37: Global LEO Satellite Market Revenue billion Forecast, by Satellite Mass 2020 & 2033
- Table 38: Global LEO Satellite Market Revenue billion Forecast, by End User 2020 & 2033
- Table 39: Global LEO Satellite Market Revenue billion Forecast, by Propulsion Tech 2020 & 2033
- Table 40: Global LEO Satellite Market Revenue billion Forecast, by Country 2020 & 2033
- Table 41: Turkey LEO Satellite Market Revenue (billion) Forecast, by Application 2020 & 2033
- Table 42: Israel LEO Satellite Market Revenue (billion) Forecast, by Application 2020 & 2033
- Table 43: GCC LEO Satellite Market Revenue (billion) Forecast, by Application 2020 & 2033
- Table 44: North Africa LEO Satellite Market Revenue (billion) Forecast, by Application 2020 & 2033
- Table 45: South Africa LEO Satellite Market Revenue (billion) Forecast, by Application 2020 & 2033
- Table 46: Rest of Middle East & Africa LEO Satellite Market Revenue (billion) Forecast, by Application 2020 & 2033
- Table 47: Global LEO Satellite Market Revenue billion Forecast, by Application 2020 & 2033
- Table 48: Global LEO Satellite Market Revenue billion Forecast, by Satellite Mass 2020 & 2033
- Table 49: Global LEO Satellite Market Revenue billion Forecast, by End User 2020 & 2033
- Table 50: Global LEO Satellite Market Revenue billion Forecast, by Propulsion Tech 2020 & 2033
- Table 51: Global LEO Satellite Market Revenue billion Forecast, by Country 2020 & 2033
- Table 52: China LEO Satellite Market Revenue (billion) Forecast, by Application 2020 & 2033
- Table 53: India LEO Satellite Market Revenue (billion) Forecast, by Application 2020 & 2033
- Table 54: Japan LEO Satellite Market Revenue (billion) Forecast, by Application 2020 & 2033
- Table 55: South Korea LEO Satellite Market Revenue (billion) Forecast, by Application 2020 & 2033
- Table 56: ASEAN LEO Satellite Market Revenue (billion) Forecast, by Application 2020 & 2033
- Table 57: Oceania LEO Satellite Market Revenue (billion) Forecast, by Application 2020 & 2033
- Table 58: Rest of Asia Pacific LEO Satellite Market Revenue (billion) Forecast, by Application 2020 & 2033
Frequently Asked Questions
1. What is the projected Compound Annual Growth Rate (CAGR) of the LEO Satellite Market?
The projected CAGR is approximately 11.9%.
2. Which companies are prominent players in the LEO Satellite Market?
Key companies in the market include Space Exploration Technologies Corp, German Orbital Systems, GomSpaceApS, SpaceQuest Ltd, Lockheed Martin Corporation, Airbus SE, Astrocast, Nano Avionics, China Aerospace Science and Technology Corporation (CASC), Surrey Satellite Technology Ltd, ROSCOSMOS, Planet Labs Inc.
3. What are the main segments of the LEO Satellite Market?
The market segments include Application, Satellite Mass, End User, Propulsion Tech.
4. Can you provide details about the market size?
The market size is estimated to be USD 11.81 billion as of 2022.
5. What are some drivers contributing to market growth?
N/A
6. What are the notable trends driving market growth?
North America is driving the market demand with a market share of 85.4% in 2029.
7. Are there any restraints impacting market growth?
N/A
8. Can you provide examples of recent developments in the market?
January 2022: Planet Labs launches 44 SuperDove satellites on SpaceX's Falcon 9 rocketNovember 2021: Planet Labs announced an agreement to acquire VanderSat, a Dutch company that provides data on Earth surface conditions, like soil moisture and land surface temperature, by combining public satellite data with proprietary algorithms, for about $28 million.January 2021: In January 2021, 5 Astrocast satellites were launched to collect and downlink data from weather buoys, wellhead sensors, pollution monitors, and other remote stations.
9. What pricing options are available for accessing the report?
Pricing options include single-user, multi-user, and enterprise licenses priced at USD 3800, USD 4500, and USD 5800 respectively.
10. Is the market size provided in terms of value or volume?
The market size is provided in terms of value, measured in billion.
11. Are there any specific market keywords associated with the report?
Yes, the market keyword associated with the report is "LEO Satellite Market," which aids in identifying and referencing the specific market segment covered.
12. How do I determine which pricing option suits my needs best?
The pricing options vary based on user requirements and access needs. Individual users may opt for single-user licenses, while businesses requiring broader access may choose multi-user or enterprise licenses for cost-effective access to the report.
13. Are there any additional resources or data provided in the LEO Satellite Market report?
While the report offers comprehensive insights, it's advisable to review the specific contents or supplementary materials provided to ascertain if additional resources or data are available.
14. How can I stay updated on further developments or reports in the LEO Satellite Market?
To stay informed about further developments, trends, and reports in the LEO Satellite Market, consider subscribing to industry newsletters, following relevant companies and organizations, or regularly checking reputable industry news sources and publications.
Methodology
Step 1 - Identification of Relevant Samples Size from Population Database


Step 2 - Approaches for Defining Global Market Size (Value, Volume* & Price*)

Note*: In applicable scenarios
Step 3 - Data Sources
Primary Research
- Web Analytics
- Survey Reports
- Research Institute
- Latest Research Reports
- Opinion Leaders
Secondary Research
- Annual Reports
- White Paper
- Latest Press Release
- Industry Association
- Paid Database
- Investor Presentations

Step 4 - Data Triangulation
Involves using different sources of information in order to increase the validity of a study
These sources are likely to be stakeholders in a program - participants, other researchers, program staff, other community members, and so on.
Then we put all data in single framework & apply various statistical tools to find out the dynamic on the market.
During the analysis stage, feedback from the stakeholder groups would be compared to determine areas of agreement as well as areas of divergence