

Key Insights
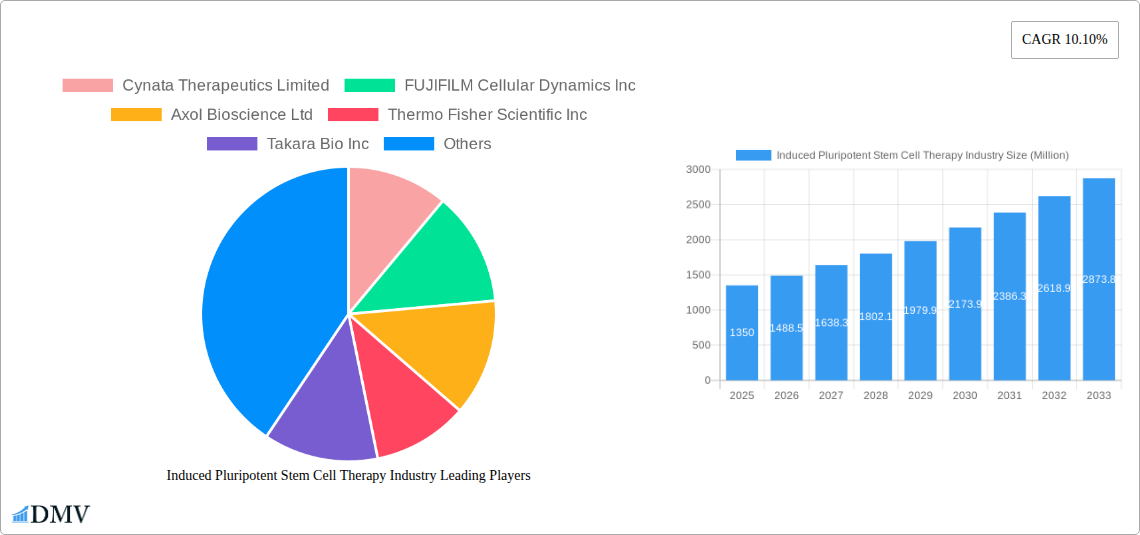
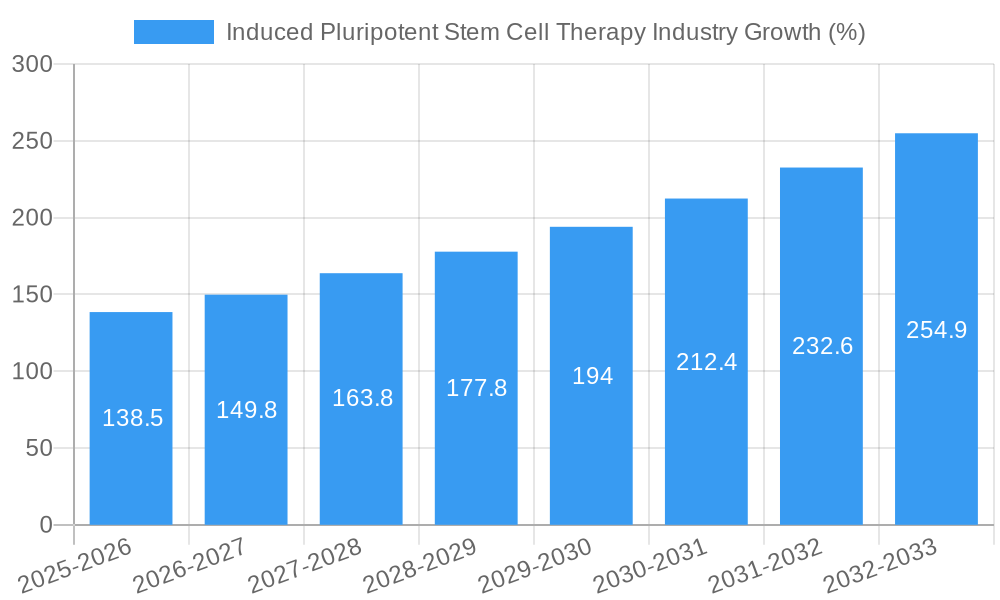
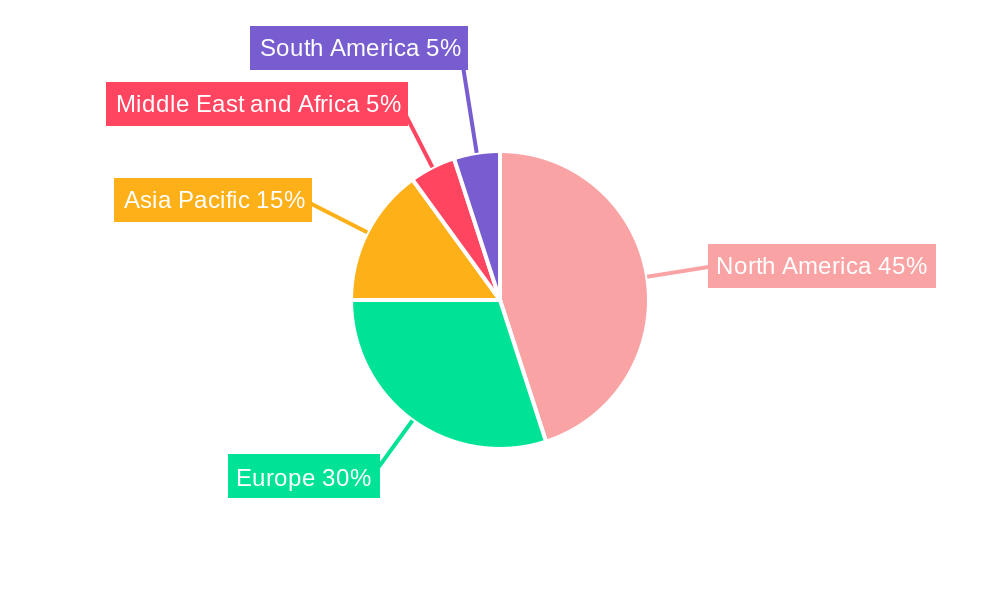
The induced pluripotent stem cell (iPSC) therapy market is experiencing robust growth, projected to reach $1.35 billion in 2025 and maintain a Compound Annual Growth Rate (CAGR) of 10.10% from 2025 to 2033. This expansion is driven by several key factors. Firstly, the increasing prevalence of chronic diseases like diabetes and neurodegenerative disorders fuels the demand for innovative therapeutic approaches. iPSC technology offers the potential for personalized medicine, creating patient-specific cell lines for disease modeling, drug discovery, and cell-based therapies. Furthermore, advancements in iPSC differentiation protocols, improving the efficiency and safety of generating specific cell types (like hepatocytes, neurons, and cardiomyocytes), are accelerating market penetration. The significant investment in research and development by both pharmaceutical giants and biotech startups further contributes to this growth trajectory. Regulatory approvals for iPSC-based therapies, while still relatively limited, are steadily increasing, boosting investor confidence and market expansion. The strong regional presence in North America and Europe, driven by established research infrastructure and regulatory frameworks, is expected to continue, though the Asia-Pacific region is poised for significant growth due to increasing healthcare expenditure and a growing awareness of advanced therapeutic options.
Despite the promising outlook, challenges remain. The high cost of iPSC-derived therapies, coupled with the complexities associated with manufacturing and clinical translation, presents hurdles to widespread adoption. Concerns about potential tumorigenicity and immune rejection of transplanted iPSC-derived cells necessitate ongoing research and development to optimize safety profiles. However, ongoing technological advancements in areas like gene editing and improved cell culture methods are addressing these challenges, paving the way for more effective and accessible iPSC-based therapies. The segments with the highest growth potential include drug development and regenerative medicine, due to their larger market size and strong growth rates across all regions. Research institutions constitute a primary end-user segment, with significant contributions from pharmaceutical companies and biotech firms entering the field.
Induced Pluripotent Stem Cell Therapy Industry: A Comprehensive Market Report (2019-2033)
This insightful report provides a detailed analysis of the Induced Pluripotent Stem Cell (iPSC) Therapy industry, offering a comprehensive overview of market trends, leading players, technological advancements, and future growth prospects. The report covers the period from 2019 to 2033, with a focus on the forecast period of 2025-2033 and a base year of 2025. The market is projected to reach xx Million by 2033, showcasing significant growth potential. This report is essential for stakeholders including investors, researchers, industry professionals, and regulatory bodies seeking a deep understanding of this rapidly evolving field.
Induced Pluripotent Stem Cell Therapy Industry Market Composition & Trends
This section evaluates the competitive landscape of the iPSC therapy market, analyzing market concentration, innovation drivers, regulatory hurdles, substitute technologies, and end-user dynamics. The report delves into the strategic landscape of mergers and acquisitions (M&A) activity, including deal values and their impact on market share distribution. The analysis incorporates data on key players like Cynata Therapeutics Limited, FUJIFILM Cellular Dynamics Inc, and Axol Bioscience Ltd, among others. We examine the factors influencing market concentration, with a focus on the strategies employed by leading companies to maintain or gain market share. Furthermore, the report details the influence of regulatory frameworks on market growth, the emergence of substitute products, and the evolving needs and preferences of end users.
- Market Share Distribution: A detailed breakdown of market share held by major players in 2025 is provided, with projections for 2033.
- M&A Activity: Analysis of significant M&A transactions in the iPSC therapy space during the study period (2019-2024), including deal values (in Millions) and their implications for market consolidation. For example, the impact of potential acquisitions of smaller companies by larger players will be examined.
- Innovation Catalysts: Discussion on the role of technological advancements, research funding, and collaborations in driving innovation within the iPSC therapy sector.
- Regulatory Landscape: Assessment of regulatory frameworks and their influence on market access and growth trajectory.
Induced Pluripotent Stem Cell Therapy Industry Evolution
This section traces the evolution of the iPSC therapy industry, examining market growth trajectories, technological breakthroughs, and changing consumer demands over the study period (2019-2033). We analyze the historical growth (2019-2024) and project future growth (2025-2033) based on several factors, including advancements in iPSC technology, increasing adoption rates in various applications (drug development, regenerative medicine etc.), and the expanding regulatory approval landscape. Specific data points, including compound annual growth rates (CAGR) and adoption metrics for different applications are included. The impact of technological advancements, such as improvements in cell reprogramming efficiency and differentiation protocols, are analyzed in detail. Shifting consumer demands and expectations regarding safety, efficacy, and accessibility of iPSC-based therapies are also addressed. The analysis will cover challenges and opportunities for growth at different stages of the industry's development.
Leading Regions, Countries, or Segments in Induced Pluripotent Stem Cell Therapy Industry
This section identifies the leading regions, countries, and segments within the iPSC therapy market. It analyzes the key drivers of dominance within the market for each segment (Derived Cell Type, Application, and End User).
Derived Cell Type:
- Hepatocytes: Highlighted due to their crucial role in drug metabolism and liver disease modeling. Market size in Million for 2025 and projected growth for 2033.
- Fibroblasts: Explored for their versatility in tissue engineering and disease modeling. Market size in Million for 2025 and projected growth for 2033.
- Keratinocytes: Focus on their applications in skin regeneration and disease modeling. Market size in Million for 2025 and projected growth for 2033.
- Neurons: Analysis of the market size and growth projection for neurological applications. Market size in Million for 2025 and projected growth for 2033.
- Others: Includes other cell types such as cardiomyocytes and endothelial cells. Market size in Million for 2025 and projected growth for 2033.
Application:
- Drug Development: Analysis of the market size and growth in drug discovery and development. Market size in Million for 2025 and projected growth for 2033.
- Regenerative Medicine: Analysis of the market size and growth in regenerative medicine applications. Market size in Million for 2025 and projected growth for 2033.
- Toxicity Testing: Analysis of the market size and growth in toxicity testing applications. Market size in Million for 2025 and projected growth for 2033.
- Tissue Engineering: Analysis of the market size and growth in tissue engineering applications. Market size in Million for 2025 and projected growth for 2033.
- Cell Therapy: Analysis of the market size and growth in cell therapy applications. Market size in Million for 2025 and projected growth for 2033.
- Disease Modeling: Analysis of the market size and growth in disease modeling applications. Market size in Million for 2025 and projected growth for 2033.
End User:
- Research Institutions: Analysis of the market size and growth within research institutions. Market size in Million for 2025 and projected growth for 2033.
- Other End Users: Analysis of the market size and growth across other end-users, such as pharmaceutical and biotech companies. Market size in Million for 2025 and projected growth for 2033.
The dominance of specific regions or countries is determined based on factors such as R&D investment, regulatory support, presence of key players, and market access.
Induced Pluripotent Stem Cell Therapy Industry Product Innovations
The iPSC therapy industry is witnessing continuous product innovation, leading to improved efficiency, scalability, and safety profiles of iPSC-derived cells. Advancements in cell reprogramming techniques and differentiation protocols are driving the development of more sophisticated and specialized cell types suitable for various therapeutic applications. Companies are focusing on developing unique selling propositions by offering superior cell quality, enhanced functionalities, and streamlined manufacturing processes. The emergence of novel technologies, like automated cell processing platforms, is improving efficiency and reducing costs. These innovations are expanding the therapeutic potential of iPSC therapies, opening new avenues for treating a broader spectrum of diseases.
Propelling Factors for Induced Pluripotent Stem Cell Therapy Industry Growth
The growth of the iPSC therapy market is propelled by several key factors:
- Technological Advancements: Continuous improvements in cell reprogramming, differentiation, and expansion technologies enhance the efficiency, safety, and scalability of iPSC-based therapies.
- Increased Research Funding: Significant investments from both public and private sectors are fueling research and development in iPSC technologies.
- Regulatory Approvals: The gradual approval of iPSC-based therapies by regulatory agencies worldwide is boosting market growth.
Obstacles in the Induced Pluripotent Stem Cell Therapy Industry Market
Several challenges hinder the growth of the iPSC therapy market:
- Regulatory Hurdles: Strict regulatory requirements for cell-based therapies create significant hurdles for market entry and product approval.
- High Production Costs: The manufacturing of iPSC-derived cells remains expensive, limiting their accessibility and affordability.
- Limited Clinical Experience: A relatively small number of clinical trials have been conducted, limiting widespread adoption of iPSC-based therapies.
Future Opportunities in Induced Pluripotent Stem Cell Therapy Industry
Future opportunities in the iPSC therapy market include:
- Expansion into New Therapeutic Areas: iPSC technologies hold immense promise for treating a wider range of diseases, presenting significant growth potential.
- Development of Advanced Manufacturing Processes: Improving manufacturing processes will enhance scalability, reducing costs and broadening accessibility.
- Personalized Medicine: The potential to develop personalized iPSC-based therapies based on patient-specific cells represents a major opportunity.
Major Players in the Induced Pluripotent Stem Cell Therapy Industry Ecosystem
- Cynata Therapeutics Limited
- FUJIFILM Cellular Dynamics Inc
- Axol Bioscience Ltd
- Thermo Fisher Scientific Inc
- Takara Bio Inc
- REPROCELL USA Inc
- LizarBio Therapeutics (Pluricell Biotech)
- Fate Therapeutics Inc
- Sumitomo Dainippon Pharma Co Ltd
- Ncardia
- ViaCyte Inc
- Evotec SE
Key Developments in Induced Pluripotent Stem Cell Therapy Industry Industry
- November 2022: Prepaire Labs signed a 5-year agreement with Ncardia to accelerate drug discovery and development, impacting the market by enhancing iPSC utilization for drug development and toxicity testing.
- October 2022: CiRA Foundation and the Cell and Gene Therapy Catapult launched a collaborative research initiative on iPS cell characterization, expected to influence market dynamics by promoting the development of regenerative medicine products.
Strategic Induced Pluripotent Stem Cell Therapy Industry Market Forecast
The iPSC therapy market is poised for significant growth, driven by ongoing technological advancements, increasing research funding, and expanding regulatory approvals. The market is anticipated to witness a robust expansion across various applications, particularly in drug discovery, regenerative medicine, and disease modeling. Growing adoption of iPSC-based therapies is expected to boost market value, making it a lucrative investment opportunity for businesses involved in iPSC technology development and commercialization. The forecast period will see further expansion into new therapeutic areas, leading to considerable market growth.
Induced Pluripotent Stem Cell Therapy Industry Segmentation
-
1. Derived Cell Type
- 1.1. Hepatocytes
- 1.2. Fibroblasts
- 1.3. Keratinocytes
- 1.4. Neurons
- 1.5. Others
-
2. Application
- 2.1. Drug Development
- 2.2. Regenerative Medicine
- 2.3. Toxicity Testing
- 2.4. Tissue Engineering
- 2.5. Cell Therapy
- 2.6. Disease Modeling
-
3. End User
- 3.1. Research Institutions
- 3.2. Other End Users
Induced Pluripotent Stem Cell Therapy Industry Segmentation By Geography
-
1. North America
- 1.1. United States
- 1.2. Canada
- 1.3. Mexico
-
2. Europe
- 2.1. Germany
- 2.2. United Kingdom
- 2.3. France
- 2.4. Italy
- 2.5. Spain
- 2.6. Rest of Europe
-
3. Asia Pacific
- 3.1. China
- 3.2. Japan
- 3.3. India
- 3.4. Australia
- 3.5. South Korea
- 3.6. Rest of Asia Pacific
-
4. Middle East and Africa
- 4.1. GCC
- 4.2. South Africa
- 4.3. Rest of Middle East and Africa
-
5. South America
- 5.1. Brazil
- 5.2. Argentina
- 5.3. Rest of South America
Induced Pluripotent Stem Cell Therapy Industry REPORT HIGHLIGHTS
| Aspects | Details |
|---|---|
| Study Period | 2019-2033 |
| Base Year | 2024 |
| Estimated Year | 2025 |
| Forecast Period | 2025-2033 |
| Historical Period | 2019-2024 |
| Growth Rate | CAGR of 10.10% from 2019-2033 |
| Segmentation |
|
Table of Contents
- 1. Introduction
- 1.1. Research Scope
- 1.2. Market Segmentation
- 1.3. Research Methodology
- 1.4. Definitions and Assumptions
- 2. Executive Summary
- 2.1. Introduction
- 3. Market Dynamics
- 3.1. Introduction
- 3.2. Market Drivers
- 3.2.1. Increase in Research and Development Activities in Stem Cells Therapies; Surge in Adoption of Personalized Medicine
- 3.3. Market Restrains
- 3.3.1. Lack of Awareness Regarding Stem Cell Therapies and High Cost of Treatment
- 3.4. Market Trends
- 3.4.1. Regenerative Medicine Segment is Expected to Witness Significant Growth Over the Forecast Period
- 4. Market Factor Analysis
- 4.1. Porters Five Forces
- 4.2. Supply/Value Chain
- 4.3. PESTEL analysis
- 4.4. Market Entropy
- 4.5. Patent/Trademark Analysis
- 5. Global Induced Pluripotent Stem Cell Therapy Industry Analysis, Insights and Forecast, 2019-2031
- 5.1. Market Analysis, Insights and Forecast - by Derived Cell Type
- 5.1.1. Hepatocytes
- 5.1.2. Fibroblasts
- 5.1.3. Keratinocytes
- 5.1.4. Neurons
- 5.1.5. Others
- 5.2. Market Analysis, Insights and Forecast - by Application
- 5.2.1. Drug Development
- 5.2.2. Regenerative Medicine
- 5.2.3. Toxicity Testing
- 5.2.4. Tissue Engineering
- 5.2.5. Cell Therapy
- 5.2.6. Disease Modeling
- 5.3. Market Analysis, Insights and Forecast - by End User
- 5.3.1. Research Institutions
- 5.3.2. Other End Users
- 5.4. Market Analysis, Insights and Forecast - by Region
- 5.4.1. North America
- 5.4.2. Europe
- 5.4.3. Asia Pacific
- 5.4.4. Middle East and Africa
- 5.4.5. South America
- 5.1. Market Analysis, Insights and Forecast - by Derived Cell Type
- 6. North America Induced Pluripotent Stem Cell Therapy Industry Analysis, Insights and Forecast, 2019-2031
- 6.1. Market Analysis, Insights and Forecast - by Derived Cell Type
- 6.1.1. Hepatocytes
- 6.1.2. Fibroblasts
- 6.1.3. Keratinocytes
- 6.1.4. Neurons
- 6.1.5. Others
- 6.2. Market Analysis, Insights and Forecast - by Application
- 6.2.1. Drug Development
- 6.2.2. Regenerative Medicine
- 6.2.3. Toxicity Testing
- 6.2.4. Tissue Engineering
- 6.2.5. Cell Therapy
- 6.2.6. Disease Modeling
- 6.3. Market Analysis, Insights and Forecast - by End User
- 6.3.1. Research Institutions
- 6.3.2. Other End Users
- 6.1. Market Analysis, Insights and Forecast - by Derived Cell Type
- 7. Europe Induced Pluripotent Stem Cell Therapy Industry Analysis, Insights and Forecast, 2019-2031
- 7.1. Market Analysis, Insights and Forecast - by Derived Cell Type
- 7.1.1. Hepatocytes
- 7.1.2. Fibroblasts
- 7.1.3. Keratinocytes
- 7.1.4. Neurons
- 7.1.5. Others
- 7.2. Market Analysis, Insights and Forecast - by Application
- 7.2.1. Drug Development
- 7.2.2. Regenerative Medicine
- 7.2.3. Toxicity Testing
- 7.2.4. Tissue Engineering
- 7.2.5. Cell Therapy
- 7.2.6. Disease Modeling
- 7.3. Market Analysis, Insights and Forecast - by End User
- 7.3.1. Research Institutions
- 7.3.2. Other End Users
- 7.1. Market Analysis, Insights and Forecast - by Derived Cell Type
- 8. Asia Pacific Induced Pluripotent Stem Cell Therapy Industry Analysis, Insights and Forecast, 2019-2031
- 8.1. Market Analysis, Insights and Forecast - by Derived Cell Type
- 8.1.1. Hepatocytes
- 8.1.2. Fibroblasts
- 8.1.3. Keratinocytes
- 8.1.4. Neurons
- 8.1.5. Others
- 8.2. Market Analysis, Insights and Forecast - by Application
- 8.2.1. Drug Development
- 8.2.2. Regenerative Medicine
- 8.2.3. Toxicity Testing
- 8.2.4. Tissue Engineering
- 8.2.5. Cell Therapy
- 8.2.6. Disease Modeling
- 8.3. Market Analysis, Insights and Forecast - by End User
- 8.3.1. Research Institutions
- 8.3.2. Other End Users
- 8.1. Market Analysis, Insights and Forecast - by Derived Cell Type
- 9. Middle East and Africa Induced Pluripotent Stem Cell Therapy Industry Analysis, Insights and Forecast, 2019-2031
- 9.1. Market Analysis, Insights and Forecast - by Derived Cell Type
- 9.1.1. Hepatocytes
- 9.1.2. Fibroblasts
- 9.1.3. Keratinocytes
- 9.1.4. Neurons
- 9.1.5. Others
- 9.2. Market Analysis, Insights and Forecast - by Application
- 9.2.1. Drug Development
- 9.2.2. Regenerative Medicine
- 9.2.3. Toxicity Testing
- 9.2.4. Tissue Engineering
- 9.2.5. Cell Therapy
- 9.2.6. Disease Modeling
- 9.3. Market Analysis, Insights and Forecast - by End User
- 9.3.1. Research Institutions
- 9.3.2. Other End Users
- 9.1. Market Analysis, Insights and Forecast - by Derived Cell Type
- 10. South America Induced Pluripotent Stem Cell Therapy Industry Analysis, Insights and Forecast, 2019-2031
- 10.1. Market Analysis, Insights and Forecast - by Derived Cell Type
- 10.1.1. Hepatocytes
- 10.1.2. Fibroblasts
- 10.1.3. Keratinocytes
- 10.1.4. Neurons
- 10.1.5. Others
- 10.2. Market Analysis, Insights and Forecast - by Application
- 10.2.1. Drug Development
- 10.2.2. Regenerative Medicine
- 10.2.3. Toxicity Testing
- 10.2.4. Tissue Engineering
- 10.2.5. Cell Therapy
- 10.2.6. Disease Modeling
- 10.3. Market Analysis, Insights and Forecast - by End User
- 10.3.1. Research Institutions
- 10.3.2. Other End Users
- 10.1. Market Analysis, Insights and Forecast - by Derived Cell Type
- 11. North America Induced Pluripotent Stem Cell Therapy Industry Analysis, Insights and Forecast, 2019-2031
- 11.1. Market Analysis, Insights and Forecast - By Country/Sub-region
- 11.1.1. undefined
- 12. Europe Induced Pluripotent Stem Cell Therapy Industry Analysis, Insights and Forecast, 2019-2031
- 12.1. Market Analysis, Insights and Forecast - By Country/Sub-region
- 12.1.1. undefined
- 13. Asia Pacific Induced Pluripotent Stem Cell Therapy Industry Analysis, Insights and Forecast, 2019-2031
- 13.1. Market Analysis, Insights and Forecast - By Country/Sub-region
- 13.1.1. undefined
- 14. Middle East and Africa Induced Pluripotent Stem Cell Therapy Industry Analysis, Insights and Forecast, 2019-2031
- 14.1. Market Analysis, Insights and Forecast - By Country/Sub-region
- 14.1.1. undefined
- 15. South America Induced Pluripotent Stem Cell Therapy Industry Analysis, Insights and Forecast, 2019-2031
- 15.1. Market Analysis, Insights and Forecast - By Country/Sub-region
- 15.1.1. undefined
- 16. Competitive Analysis
- 16.1. Global Market Share Analysis 2024
- 16.2. Company Profiles
- 16.2.1 Cynata Therapeutics Limited
- 16.2.1.1. Overview
- 16.2.1.2. Products
- 16.2.1.3. SWOT Analysis
- 16.2.1.4. Recent Developments
- 16.2.1.5. Financials (Based on Availability)
- 16.2.2 FUJIFILM Cellular Dynamics Inc
- 16.2.2.1. Overview
- 16.2.2.2. Products
- 16.2.2.3. SWOT Analysis
- 16.2.2.4. Recent Developments
- 16.2.2.5. Financials (Based on Availability)
- 16.2.3 Axol Bioscience Ltd
- 16.2.3.1. Overview
- 16.2.3.2. Products
- 16.2.3.3. SWOT Analysis
- 16.2.3.4. Recent Developments
- 16.2.3.5. Financials (Based on Availability)
- 16.2.4 Thermo Fisher Scientific Inc
- 16.2.4.1. Overview
- 16.2.4.2. Products
- 16.2.4.3. SWOT Analysis
- 16.2.4.4. Recent Developments
- 16.2.4.5. Financials (Based on Availability)
- 16.2.5 Takara Bio Inc
- 16.2.5.1. Overview
- 16.2.5.2. Products
- 16.2.5.3. SWOT Analysis
- 16.2.5.4. Recent Developments
- 16.2.5.5. Financials (Based on Availability)
- 16.2.6 REPROCELL USA Inc
- 16.2.6.1. Overview
- 16.2.6.2. Products
- 16.2.6.3. SWOT Analysis
- 16.2.6.4. Recent Developments
- 16.2.6.5. Financials (Based on Availability)
- 16.2.7 LizarBio Therapeutics (Pluricell Biotech)
- 16.2.7.1. Overview
- 16.2.7.2. Products
- 16.2.7.3. SWOT Analysis
- 16.2.7.4. Recent Developments
- 16.2.7.5. Financials (Based on Availability)
- 16.2.8 Fate Therapeutics Inc
- 16.2.8.1. Overview
- 16.2.8.2. Products
- 16.2.8.3. SWOT Analysis
- 16.2.8.4. Recent Developments
- 16.2.8.5. Financials (Based on Availability)
- 16.2.9 Sumitomo Dainippon Pharma Co Ltd
- 16.2.9.1. Overview
- 16.2.9.2. Products
- 16.2.9.3. SWOT Analysis
- 16.2.9.4. Recent Developments
- 16.2.9.5. Financials (Based on Availability)
- 16.2.10 Ncardia
- 16.2.10.1. Overview
- 16.2.10.2. Products
- 16.2.10.3. SWOT Analysis
- 16.2.10.4. Recent Developments
- 16.2.10.5. Financials (Based on Availability)
- 16.2.11 ViaCyte Inc
- 16.2.11.1. Overview
- 16.2.11.2. Products
- 16.2.11.3. SWOT Analysis
- 16.2.11.4. Recent Developments
- 16.2.11.5. Financials (Based on Availability)
- 16.2.12 Evotec SE
- 16.2.12.1. Overview
- 16.2.12.2. Products
- 16.2.12.3. SWOT Analysis
- 16.2.12.4. Recent Developments
- 16.2.12.5. Financials (Based on Availability)
- 16.2.1 Cynata Therapeutics Limited
List of Figures
- Figure 1: Global Induced Pluripotent Stem Cell Therapy Industry Revenue Breakdown (Million, %) by Region 2024 & 2032
- Figure 2: Global Induced Pluripotent Stem Cell Therapy Industry Volume Breakdown (K unit, %) by Region 2024 & 2032
- Figure 3: North America Induced Pluripotent Stem Cell Therapy Industry Revenue (Million), by Country 2024 & 2032
- Figure 4: North America Induced Pluripotent Stem Cell Therapy Industry Volume (K unit), by Country 2024 & 2032
- Figure 5: North America Induced Pluripotent Stem Cell Therapy Industry Revenue Share (%), by Country 2024 & 2032
- Figure 6: North America Induced Pluripotent Stem Cell Therapy Industry Volume Share (%), by Country 2024 & 2032
- Figure 7: Europe Induced Pluripotent Stem Cell Therapy Industry Revenue (Million), by Country 2024 & 2032
- Figure 8: Europe Induced Pluripotent Stem Cell Therapy Industry Volume (K unit), by Country 2024 & 2032
- Figure 9: Europe Induced Pluripotent Stem Cell Therapy Industry Revenue Share (%), by Country 2024 & 2032
- Figure 10: Europe Induced Pluripotent Stem Cell Therapy Industry Volume Share (%), by Country 2024 & 2032
- Figure 11: Asia Pacific Induced Pluripotent Stem Cell Therapy Industry Revenue (Million), by Country 2024 & 2032
- Figure 12: Asia Pacific Induced Pluripotent Stem Cell Therapy Industry Volume (K unit), by Country 2024 & 2032
- Figure 13: Asia Pacific Induced Pluripotent Stem Cell Therapy Industry Revenue Share (%), by Country 2024 & 2032
- Figure 14: Asia Pacific Induced Pluripotent Stem Cell Therapy Industry Volume Share (%), by Country 2024 & 2032
- Figure 15: Middle East and Africa Induced Pluripotent Stem Cell Therapy Industry Revenue (Million), by Country 2024 & 2032
- Figure 16: Middle East and Africa Induced Pluripotent Stem Cell Therapy Industry Volume (K unit), by Country 2024 & 2032
- Figure 17: Middle East and Africa Induced Pluripotent Stem Cell Therapy Industry Revenue Share (%), by Country 2024 & 2032
- Figure 18: Middle East and Africa Induced Pluripotent Stem Cell Therapy Industry Volume Share (%), by Country 2024 & 2032
- Figure 19: South America Induced Pluripotent Stem Cell Therapy Industry Revenue (Million), by Country 2024 & 2032
- Figure 20: South America Induced Pluripotent Stem Cell Therapy Industry Volume (K unit), by Country 2024 & 2032
- Figure 21: South America Induced Pluripotent Stem Cell Therapy Industry Revenue Share (%), by Country 2024 & 2032
- Figure 22: South America Induced Pluripotent Stem Cell Therapy Industry Volume Share (%), by Country 2024 & 2032
- Figure 23: North America Induced Pluripotent Stem Cell Therapy Industry Revenue (Million), by Derived Cell Type 2024 & 2032
- Figure 24: North America Induced Pluripotent Stem Cell Therapy Industry Volume (K unit), by Derived Cell Type 2024 & 2032
- Figure 25: North America Induced Pluripotent Stem Cell Therapy Industry Revenue Share (%), by Derived Cell Type 2024 & 2032
- Figure 26: North America Induced Pluripotent Stem Cell Therapy Industry Volume Share (%), by Derived Cell Type 2024 & 2032
- Figure 27: North America Induced Pluripotent Stem Cell Therapy Industry Revenue (Million), by Application 2024 & 2032
- Figure 28: North America Induced Pluripotent Stem Cell Therapy Industry Volume (K unit), by Application 2024 & 2032
- Figure 29: North America Induced Pluripotent Stem Cell Therapy Industry Revenue Share (%), by Application 2024 & 2032
- Figure 30: North America Induced Pluripotent Stem Cell Therapy Industry Volume Share (%), by Application 2024 & 2032
- Figure 31: North America Induced Pluripotent Stem Cell Therapy Industry Revenue (Million), by End User 2024 & 2032
- Figure 32: North America Induced Pluripotent Stem Cell Therapy Industry Volume (K unit), by End User 2024 & 2032
- Figure 33: North America Induced Pluripotent Stem Cell Therapy Industry Revenue Share (%), by End User 2024 & 2032
- Figure 34: North America Induced Pluripotent Stem Cell Therapy Industry Volume Share (%), by End User 2024 & 2032
- Figure 35: North America Induced Pluripotent Stem Cell Therapy Industry Revenue (Million), by Country 2024 & 2032
- Figure 36: North America Induced Pluripotent Stem Cell Therapy Industry Volume (K unit), by Country 2024 & 2032
- Figure 37: North America Induced Pluripotent Stem Cell Therapy Industry Revenue Share (%), by Country 2024 & 2032
- Figure 38: North America Induced Pluripotent Stem Cell Therapy Industry Volume Share (%), by Country 2024 & 2032
- Figure 39: Europe Induced Pluripotent Stem Cell Therapy Industry Revenue (Million), by Derived Cell Type 2024 & 2032
- Figure 40: Europe Induced Pluripotent Stem Cell Therapy Industry Volume (K unit), by Derived Cell Type 2024 & 2032
- Figure 41: Europe Induced Pluripotent Stem Cell Therapy Industry Revenue Share (%), by Derived Cell Type 2024 & 2032
- Figure 42: Europe Induced Pluripotent Stem Cell Therapy Industry Volume Share (%), by Derived Cell Type 2024 & 2032
- Figure 43: Europe Induced Pluripotent Stem Cell Therapy Industry Revenue (Million), by Application 2024 & 2032
- Figure 44: Europe Induced Pluripotent Stem Cell Therapy Industry Volume (K unit), by Application 2024 & 2032
- Figure 45: Europe Induced Pluripotent Stem Cell Therapy Industry Revenue Share (%), by Application 2024 & 2032
- Figure 46: Europe Induced Pluripotent Stem Cell Therapy Industry Volume Share (%), by Application 2024 & 2032
- Figure 47: Europe Induced Pluripotent Stem Cell Therapy Industry Revenue (Million), by End User 2024 & 2032
- Figure 48: Europe Induced Pluripotent Stem Cell Therapy Industry Volume (K unit), by End User 2024 & 2032
- Figure 49: Europe Induced Pluripotent Stem Cell Therapy Industry Revenue Share (%), by End User 2024 & 2032
- Figure 50: Europe Induced Pluripotent Stem Cell Therapy Industry Volume Share (%), by End User 2024 & 2032
- Figure 51: Europe Induced Pluripotent Stem Cell Therapy Industry Revenue (Million), by Country 2024 & 2032
- Figure 52: Europe Induced Pluripotent Stem Cell Therapy Industry Volume (K unit), by Country 2024 & 2032
- Figure 53: Europe Induced Pluripotent Stem Cell Therapy Industry Revenue Share (%), by Country 2024 & 2032
- Figure 54: Europe Induced Pluripotent Stem Cell Therapy Industry Volume Share (%), by Country 2024 & 2032
- Figure 55: Asia Pacific Induced Pluripotent Stem Cell Therapy Industry Revenue (Million), by Derived Cell Type 2024 & 2032
- Figure 56: Asia Pacific Induced Pluripotent Stem Cell Therapy Industry Volume (K unit), by Derived Cell Type 2024 & 2032
- Figure 57: Asia Pacific Induced Pluripotent Stem Cell Therapy Industry Revenue Share (%), by Derived Cell Type 2024 & 2032
- Figure 58: Asia Pacific Induced Pluripotent Stem Cell Therapy Industry Volume Share (%), by Derived Cell Type 2024 & 2032
- Figure 59: Asia Pacific Induced Pluripotent Stem Cell Therapy Industry Revenue (Million), by Application 2024 & 2032
- Figure 60: Asia Pacific Induced Pluripotent Stem Cell Therapy Industry Volume (K unit), by Application 2024 & 2032
- Figure 61: Asia Pacific Induced Pluripotent Stem Cell Therapy Industry Revenue Share (%), by Application 2024 & 2032
- Figure 62: Asia Pacific Induced Pluripotent Stem Cell Therapy Industry Volume Share (%), by Application 2024 & 2032
- Figure 63: Asia Pacific Induced Pluripotent Stem Cell Therapy Industry Revenue (Million), by End User 2024 & 2032
- Figure 64: Asia Pacific Induced Pluripotent Stem Cell Therapy Industry Volume (K unit), by End User 2024 & 2032
- Figure 65: Asia Pacific Induced Pluripotent Stem Cell Therapy Industry Revenue Share (%), by End User 2024 & 2032
- Figure 66: Asia Pacific Induced Pluripotent Stem Cell Therapy Industry Volume Share (%), by End User 2024 & 2032
- Figure 67: Asia Pacific Induced Pluripotent Stem Cell Therapy Industry Revenue (Million), by Country 2024 & 2032
- Figure 68: Asia Pacific Induced Pluripotent Stem Cell Therapy Industry Volume (K unit), by Country 2024 & 2032
- Figure 69: Asia Pacific Induced Pluripotent Stem Cell Therapy Industry Revenue Share (%), by Country 2024 & 2032
- Figure 70: Asia Pacific Induced Pluripotent Stem Cell Therapy Industry Volume Share (%), by Country 2024 & 2032
- Figure 71: Middle East and Africa Induced Pluripotent Stem Cell Therapy Industry Revenue (Million), by Derived Cell Type 2024 & 2032
- Figure 72: Middle East and Africa Induced Pluripotent Stem Cell Therapy Industry Volume (K unit), by Derived Cell Type 2024 & 2032
- Figure 73: Middle East and Africa Induced Pluripotent Stem Cell Therapy Industry Revenue Share (%), by Derived Cell Type 2024 & 2032
- Figure 74: Middle East and Africa Induced Pluripotent Stem Cell Therapy Industry Volume Share (%), by Derived Cell Type 2024 & 2032
- Figure 75: Middle East and Africa Induced Pluripotent Stem Cell Therapy Industry Revenue (Million), by Application 2024 & 2032
- Figure 76: Middle East and Africa Induced Pluripotent Stem Cell Therapy Industry Volume (K unit), by Application 2024 & 2032
- Figure 77: Middle East and Africa Induced Pluripotent Stem Cell Therapy Industry Revenue Share (%), by Application 2024 & 2032
- Figure 78: Middle East and Africa Induced Pluripotent Stem Cell Therapy Industry Volume Share (%), by Application 2024 & 2032
- Figure 79: Middle East and Africa Induced Pluripotent Stem Cell Therapy Industry Revenue (Million), by End User 2024 & 2032
- Figure 80: Middle East and Africa Induced Pluripotent Stem Cell Therapy Industry Volume (K unit), by End User 2024 & 2032
- Figure 81: Middle East and Africa Induced Pluripotent Stem Cell Therapy Industry Revenue Share (%), by End User 2024 & 2032
- Figure 82: Middle East and Africa Induced Pluripotent Stem Cell Therapy Industry Volume Share (%), by End User 2024 & 2032
- Figure 83: Middle East and Africa Induced Pluripotent Stem Cell Therapy Industry Revenue (Million), by Country 2024 & 2032
- Figure 84: Middle East and Africa Induced Pluripotent Stem Cell Therapy Industry Volume (K unit), by Country 2024 & 2032
- Figure 85: Middle East and Africa Induced Pluripotent Stem Cell Therapy Industry Revenue Share (%), by Country 2024 & 2032
- Figure 86: Middle East and Africa Induced Pluripotent Stem Cell Therapy Industry Volume Share (%), by Country 2024 & 2032
- Figure 87: South America Induced Pluripotent Stem Cell Therapy Industry Revenue (Million), by Derived Cell Type 2024 & 2032
- Figure 88: South America Induced Pluripotent Stem Cell Therapy Industry Volume (K unit), by Derived Cell Type 2024 & 2032
- Figure 89: South America Induced Pluripotent Stem Cell Therapy Industry Revenue Share (%), by Derived Cell Type 2024 & 2032
- Figure 90: South America Induced Pluripotent Stem Cell Therapy Industry Volume Share (%), by Derived Cell Type 2024 & 2032
- Figure 91: South America Induced Pluripotent Stem Cell Therapy Industry Revenue (Million), by Application 2024 & 2032
- Figure 92: South America Induced Pluripotent Stem Cell Therapy Industry Volume (K unit), by Application 2024 & 2032
- Figure 93: South America Induced Pluripotent Stem Cell Therapy Industry Revenue Share (%), by Application 2024 & 2032
- Figure 94: South America Induced Pluripotent Stem Cell Therapy Industry Volume Share (%), by Application 2024 & 2032
- Figure 95: South America Induced Pluripotent Stem Cell Therapy Industry Revenue (Million), by End User 2024 & 2032
- Figure 96: South America Induced Pluripotent Stem Cell Therapy Industry Volume (K unit), by End User 2024 & 2032
- Figure 97: South America Induced Pluripotent Stem Cell Therapy Industry Revenue Share (%), by End User 2024 & 2032
- Figure 98: South America Induced Pluripotent Stem Cell Therapy Industry Volume Share (%), by End User 2024 & 2032
- Figure 99: South America Induced Pluripotent Stem Cell Therapy Industry Revenue (Million), by Country 2024 & 2032
- Figure 100: South America Induced Pluripotent Stem Cell Therapy Industry Volume (K unit), by Country 2024 & 2032
- Figure 101: South America Induced Pluripotent Stem Cell Therapy Industry Revenue Share (%), by Country 2024 & 2032
- Figure 102: South America Induced Pluripotent Stem Cell Therapy Industry Volume Share (%), by Country 2024 & 2032
List of Tables
- Table 1: Global Induced Pluripotent Stem Cell Therapy Industry Revenue Million Forecast, by Region 2019 & 2032
- Table 2: Global Induced Pluripotent Stem Cell Therapy Industry Volume K unit Forecast, by Region 2019 & 2032
- Table 3: Global Induced Pluripotent Stem Cell Therapy Industry Revenue Million Forecast, by Derived Cell Type 2019 & 2032
- Table 4: Global Induced Pluripotent Stem Cell Therapy Industry Volume K unit Forecast, by Derived Cell Type 2019 & 2032
- Table 5: Global Induced Pluripotent Stem Cell Therapy Industry Revenue Million Forecast, by Application 2019 & 2032
- Table 6: Global Induced Pluripotent Stem Cell Therapy Industry Volume K unit Forecast, by Application 2019 & 2032
- Table 7: Global Induced Pluripotent Stem Cell Therapy Industry Revenue Million Forecast, by End User 2019 & 2032
- Table 8: Global Induced Pluripotent Stem Cell Therapy Industry Volume K unit Forecast, by End User 2019 & 2032
- Table 9: Global Induced Pluripotent Stem Cell Therapy Industry Revenue Million Forecast, by Region 2019 & 2032
- Table 10: Global Induced Pluripotent Stem Cell Therapy Industry Volume K unit Forecast, by Region 2019 & 2032
- Table 11: Global Induced Pluripotent Stem Cell Therapy Industry Revenue Million Forecast, by Country 2019 & 2032
- Table 12: Global Induced Pluripotent Stem Cell Therapy Industry Volume K unit Forecast, by Country 2019 & 2032
- Table 13: Global Induced Pluripotent Stem Cell Therapy Industry Revenue Million Forecast, by Country 2019 & 2032
- Table 14: Global Induced Pluripotent Stem Cell Therapy Industry Volume K unit Forecast, by Country 2019 & 2032
- Table 15: Global Induced Pluripotent Stem Cell Therapy Industry Revenue Million Forecast, by Country 2019 & 2032
- Table 16: Global Induced Pluripotent Stem Cell Therapy Industry Volume K unit Forecast, by Country 2019 & 2032
- Table 17: Global Induced Pluripotent Stem Cell Therapy Industry Revenue Million Forecast, by Country 2019 & 2032
- Table 18: Global Induced Pluripotent Stem Cell Therapy Industry Volume K unit Forecast, by Country 2019 & 2032
- Table 19: Global Induced Pluripotent Stem Cell Therapy Industry Revenue Million Forecast, by Country 2019 & 2032
- Table 20: Global Induced Pluripotent Stem Cell Therapy Industry Volume K unit Forecast, by Country 2019 & 2032
- Table 21: Global Induced Pluripotent Stem Cell Therapy Industry Revenue Million Forecast, by Derived Cell Type 2019 & 2032
- Table 22: Global Induced Pluripotent Stem Cell Therapy Industry Volume K unit Forecast, by Derived Cell Type 2019 & 2032
- Table 23: Global Induced Pluripotent Stem Cell Therapy Industry Revenue Million Forecast, by Application 2019 & 2032
- Table 24: Global Induced Pluripotent Stem Cell Therapy Industry Volume K unit Forecast, by Application 2019 & 2032
- Table 25: Global Induced Pluripotent Stem Cell Therapy Industry Revenue Million Forecast, by End User 2019 & 2032
- Table 26: Global Induced Pluripotent Stem Cell Therapy Industry Volume K unit Forecast, by End User 2019 & 2032
- Table 27: Global Induced Pluripotent Stem Cell Therapy Industry Revenue Million Forecast, by Country 2019 & 2032
- Table 28: Global Induced Pluripotent Stem Cell Therapy Industry Volume K unit Forecast, by Country 2019 & 2032
- Table 29: United States Induced Pluripotent Stem Cell Therapy Industry Revenue (Million) Forecast, by Application 2019 & 2032
- Table 30: United States Induced Pluripotent Stem Cell Therapy Industry Volume (K unit) Forecast, by Application 2019 & 2032
- Table 31: Canada Induced Pluripotent Stem Cell Therapy Industry Revenue (Million) Forecast, by Application 2019 & 2032
- Table 32: Canada Induced Pluripotent Stem Cell Therapy Industry Volume (K unit) Forecast, by Application 2019 & 2032
- Table 33: Mexico Induced Pluripotent Stem Cell Therapy Industry Revenue (Million) Forecast, by Application 2019 & 2032
- Table 34: Mexico Induced Pluripotent Stem Cell Therapy Industry Volume (K unit) Forecast, by Application 2019 & 2032
- Table 35: Global Induced Pluripotent Stem Cell Therapy Industry Revenue Million Forecast, by Derived Cell Type 2019 & 2032
- Table 36: Global Induced Pluripotent Stem Cell Therapy Industry Volume K unit Forecast, by Derived Cell Type 2019 & 2032
- Table 37: Global Induced Pluripotent Stem Cell Therapy Industry Revenue Million Forecast, by Application 2019 & 2032
- Table 38: Global Induced Pluripotent Stem Cell Therapy Industry Volume K unit Forecast, by Application 2019 & 2032
- Table 39: Global Induced Pluripotent Stem Cell Therapy Industry Revenue Million Forecast, by End User 2019 & 2032
- Table 40: Global Induced Pluripotent Stem Cell Therapy Industry Volume K unit Forecast, by End User 2019 & 2032
- Table 41: Global Induced Pluripotent Stem Cell Therapy Industry Revenue Million Forecast, by Country 2019 & 2032
- Table 42: Global Induced Pluripotent Stem Cell Therapy Industry Volume K unit Forecast, by Country 2019 & 2032
- Table 43: Germany Induced Pluripotent Stem Cell Therapy Industry Revenue (Million) Forecast, by Application 2019 & 2032
- Table 44: Germany Induced Pluripotent Stem Cell Therapy Industry Volume (K unit) Forecast, by Application 2019 & 2032
- Table 45: United Kingdom Induced Pluripotent Stem Cell Therapy Industry Revenue (Million) Forecast, by Application 2019 & 2032
- Table 46: United Kingdom Induced Pluripotent Stem Cell Therapy Industry Volume (K unit) Forecast, by Application 2019 & 2032
- Table 47: France Induced Pluripotent Stem Cell Therapy Industry Revenue (Million) Forecast, by Application 2019 & 2032
- Table 48: France Induced Pluripotent Stem Cell Therapy Industry Volume (K unit) Forecast, by Application 2019 & 2032
- Table 49: Italy Induced Pluripotent Stem Cell Therapy Industry Revenue (Million) Forecast, by Application 2019 & 2032
- Table 50: Italy Induced Pluripotent Stem Cell Therapy Industry Volume (K unit) Forecast, by Application 2019 & 2032
- Table 51: Spain Induced Pluripotent Stem Cell Therapy Industry Revenue (Million) Forecast, by Application 2019 & 2032
- Table 52: Spain Induced Pluripotent Stem Cell Therapy Industry Volume (K unit) Forecast, by Application 2019 & 2032
- Table 53: Rest of Europe Induced Pluripotent Stem Cell Therapy Industry Revenue (Million) Forecast, by Application 2019 & 2032
- Table 54: Rest of Europe Induced Pluripotent Stem Cell Therapy Industry Volume (K unit) Forecast, by Application 2019 & 2032
- Table 55: Global Induced Pluripotent Stem Cell Therapy Industry Revenue Million Forecast, by Derived Cell Type 2019 & 2032
- Table 56: Global Induced Pluripotent Stem Cell Therapy Industry Volume K unit Forecast, by Derived Cell Type 2019 & 2032
- Table 57: Global Induced Pluripotent Stem Cell Therapy Industry Revenue Million Forecast, by Application 2019 & 2032
- Table 58: Global Induced Pluripotent Stem Cell Therapy Industry Volume K unit Forecast, by Application 2019 & 2032
- Table 59: Global Induced Pluripotent Stem Cell Therapy Industry Revenue Million Forecast, by End User 2019 & 2032
- Table 60: Global Induced Pluripotent Stem Cell Therapy Industry Volume K unit Forecast, by End User 2019 & 2032
- Table 61: Global Induced Pluripotent Stem Cell Therapy Industry Revenue Million Forecast, by Country 2019 & 2032
- Table 62: Global Induced Pluripotent Stem Cell Therapy Industry Volume K unit Forecast, by Country 2019 & 2032
- Table 63: China Induced Pluripotent Stem Cell Therapy Industry Revenue (Million) Forecast, by Application 2019 & 2032
- Table 64: China Induced Pluripotent Stem Cell Therapy Industry Volume (K unit) Forecast, by Application 2019 & 2032
- Table 65: Japan Induced Pluripotent Stem Cell Therapy Industry Revenue (Million) Forecast, by Application 2019 & 2032
- Table 66: Japan Induced Pluripotent Stem Cell Therapy Industry Volume (K unit) Forecast, by Application 2019 & 2032
- Table 67: India Induced Pluripotent Stem Cell Therapy Industry Revenue (Million) Forecast, by Application 2019 & 2032
- Table 68: India Induced Pluripotent Stem Cell Therapy Industry Volume (K unit) Forecast, by Application 2019 & 2032
- Table 69: Australia Induced Pluripotent Stem Cell Therapy Industry Revenue (Million) Forecast, by Application 2019 & 2032
- Table 70: Australia Induced Pluripotent Stem Cell Therapy Industry Volume (K unit) Forecast, by Application 2019 & 2032
- Table 71: South Korea Induced Pluripotent Stem Cell Therapy Industry Revenue (Million) Forecast, by Application 2019 & 2032
- Table 72: South Korea Induced Pluripotent Stem Cell Therapy Industry Volume (K unit) Forecast, by Application 2019 & 2032
- Table 73: Rest of Asia Pacific Induced Pluripotent Stem Cell Therapy Industry Revenue (Million) Forecast, by Application 2019 & 2032
- Table 74: Rest of Asia Pacific Induced Pluripotent Stem Cell Therapy Industry Volume (K unit) Forecast, by Application 2019 & 2032
- Table 75: Global Induced Pluripotent Stem Cell Therapy Industry Revenue Million Forecast, by Derived Cell Type 2019 & 2032
- Table 76: Global Induced Pluripotent Stem Cell Therapy Industry Volume K unit Forecast, by Derived Cell Type 2019 & 2032
- Table 77: Global Induced Pluripotent Stem Cell Therapy Industry Revenue Million Forecast, by Application 2019 & 2032
- Table 78: Global Induced Pluripotent Stem Cell Therapy Industry Volume K unit Forecast, by Application 2019 & 2032
- Table 79: Global Induced Pluripotent Stem Cell Therapy Industry Revenue Million Forecast, by End User 2019 & 2032
- Table 80: Global Induced Pluripotent Stem Cell Therapy Industry Volume K unit Forecast, by End User 2019 & 2032
- Table 81: Global Induced Pluripotent Stem Cell Therapy Industry Revenue Million Forecast, by Country 2019 & 2032
- Table 82: Global Induced Pluripotent Stem Cell Therapy Industry Volume K unit Forecast, by Country 2019 & 2032
- Table 83: GCC Induced Pluripotent Stem Cell Therapy Industry Revenue (Million) Forecast, by Application 2019 & 2032
- Table 84: GCC Induced Pluripotent Stem Cell Therapy Industry Volume (K unit) Forecast, by Application 2019 & 2032
- Table 85: South Africa Induced Pluripotent Stem Cell Therapy Industry Revenue (Million) Forecast, by Application 2019 & 2032
- Table 86: South Africa Induced Pluripotent Stem Cell Therapy Industry Volume (K unit) Forecast, by Application 2019 & 2032
- Table 87: Rest of Middle East and Africa Induced Pluripotent Stem Cell Therapy Industry Revenue (Million) Forecast, by Application 2019 & 2032
- Table 88: Rest of Middle East and Africa Induced Pluripotent Stem Cell Therapy Industry Volume (K unit) Forecast, by Application 2019 & 2032
- Table 89: Global Induced Pluripotent Stem Cell Therapy Industry Revenue Million Forecast, by Derived Cell Type 2019 & 2032
- Table 90: Global Induced Pluripotent Stem Cell Therapy Industry Volume K unit Forecast, by Derived Cell Type 2019 & 2032
- Table 91: Global Induced Pluripotent Stem Cell Therapy Industry Revenue Million Forecast, by Application 2019 & 2032
- Table 92: Global Induced Pluripotent Stem Cell Therapy Industry Volume K unit Forecast, by Application 2019 & 2032
- Table 93: Global Induced Pluripotent Stem Cell Therapy Industry Revenue Million Forecast, by End User 2019 & 2032
- Table 94: Global Induced Pluripotent Stem Cell Therapy Industry Volume K unit Forecast, by End User 2019 & 2032
- Table 95: Global Induced Pluripotent Stem Cell Therapy Industry Revenue Million Forecast, by Country 2019 & 2032
- Table 96: Global Induced Pluripotent Stem Cell Therapy Industry Volume K unit Forecast, by Country 2019 & 2032
- Table 97: Brazil Induced Pluripotent Stem Cell Therapy Industry Revenue (Million) Forecast, by Application 2019 & 2032
- Table 98: Brazil Induced Pluripotent Stem Cell Therapy Industry Volume (K unit) Forecast, by Application 2019 & 2032
- Table 99: Argentina Induced Pluripotent Stem Cell Therapy Industry Revenue (Million) Forecast, by Application 2019 & 2032
- Table 100: Argentina Induced Pluripotent Stem Cell Therapy Industry Volume (K unit) Forecast, by Application 2019 & 2032
- Table 101: Rest of South America Induced Pluripotent Stem Cell Therapy Industry Revenue (Million) Forecast, by Application 2019 & 2032
- Table 102: Rest of South America Induced Pluripotent Stem Cell Therapy Industry Volume (K unit) Forecast, by Application 2019 & 2032
Frequently Asked Questions
1. What is the projected Compound Annual Growth Rate (CAGR) of the Induced Pluripotent Stem Cell Therapy Industry?
The projected CAGR is approximately 10.10%.
2. Which companies are prominent players in the Induced Pluripotent Stem Cell Therapy Industry?
Key companies in the market include Cynata Therapeutics Limited, FUJIFILM Cellular Dynamics Inc, Axol Bioscience Ltd, Thermo Fisher Scientific Inc, Takara Bio Inc, REPROCELL USA Inc, LizarBio Therapeutics (Pluricell Biotech), Fate Therapeutics Inc, Sumitomo Dainippon Pharma Co Ltd, Ncardia, ViaCyte Inc , Evotec SE.
3. What are the main segments of the Induced Pluripotent Stem Cell Therapy Industry?
The market segments include Derived Cell Type, Application, End User.
4. Can you provide details about the market size?
The market size is estimated to be USD 1.35 Million as of 2022.
5. What are some drivers contributing to market growth?
Increase in Research and Development Activities in Stem Cells Therapies; Surge in Adoption of Personalized Medicine.
6. What are the notable trends driving market growth?
Regenerative Medicine Segment is Expected to Witness Significant Growth Over the Forecast Period.
7. Are there any restraints impacting market growth?
Lack of Awareness Regarding Stem Cell Therapies and High Cost of Treatment.
8. Can you provide examples of recent developments in the market?
In November 2022, Prepaire Labs signed a 5-year agreement with Ncardia to accelerate drug discovery and development including target discovery, lead optimization, toxicity assessment, and trial design. The new initiative assists in the development of iPSCs by reprogramming adult cells (such as skin and blood cells) into an embryonic stem cell-like state, which can differentiate into any type of human body cell.
9. What pricing options are available for accessing the report?
Pricing options include single-user, multi-user, and enterprise licenses priced at USD 4750, USD 5250, and USD 8750 respectively.
10. Is the market size provided in terms of value or volume?
The market size is provided in terms of value, measured in Million and volume, measured in K unit.
11. Are there any specific market keywords associated with the report?
Yes, the market keyword associated with the report is "Induced Pluripotent Stem Cell Therapy Industry," which aids in identifying and referencing the specific market segment covered.
12. How do I determine which pricing option suits my needs best?
The pricing options vary based on user requirements and access needs. Individual users may opt for single-user licenses, while businesses requiring broader access may choose multi-user or enterprise licenses for cost-effective access to the report.
13. Are there any additional resources or data provided in the Induced Pluripotent Stem Cell Therapy Industry report?
While the report offers comprehensive insights, it's advisable to review the specific contents or supplementary materials provided to ascertain if additional resources or data are available.
14. How can I stay updated on further developments or reports in the Induced Pluripotent Stem Cell Therapy Industry?
To stay informed about further developments, trends, and reports in the Induced Pluripotent Stem Cell Therapy Industry, consider subscribing to industry newsletters, following relevant companies and organizations, or regularly checking reputable industry news sources and publications.
Methodology
Step 1 - Identification of Relevant Samples Size from Population Database


Step 2 - Approaches for Defining Global Market Size (Value, Volume* & Price*)

Note*: In applicable scenarios
Step 3 - Data Sources
Primary Research
- Web Analytics
- Survey Reports
- Research Institute
- Latest Research Reports
- Opinion Leaders
Secondary Research
- Annual Reports
- White Paper
- Latest Press Release
- Industry Association
- Paid Database
- Investor Presentations

Step 4 - Data Triangulation
Involves using different sources of information in order to increase the validity of a study
These sources are likely to be stakeholders in a program - participants, other researchers, program staff, other community members, and so on.
Then we put all data in single framework & apply various statistical tools to find out the dynamic on the market.
During the analysis stage, feedback from the stakeholder groups would be compared to determine areas of agreement as well as areas of divergence
