

Key Insights
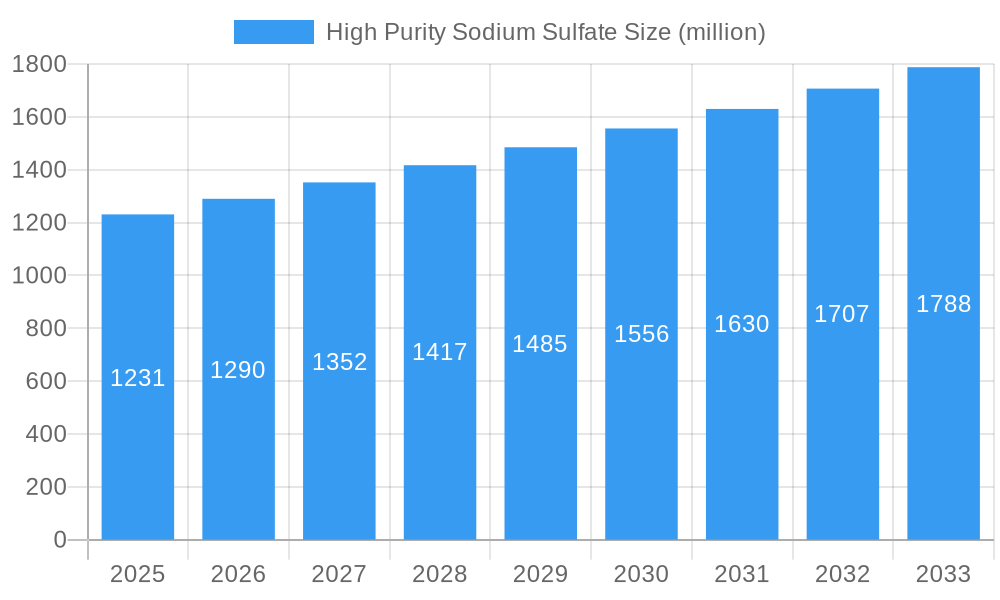
The global high-purity sodium sulfate market, valued at approximately $1231 million in 2025, is projected to experience robust growth, driven by increasing demand across various industries. The compound annual growth rate (CAGR) of 4.8% from 2025 to 2033 signifies a consistent upward trajectory, primarily fueled by the expanding use of high-purity sodium sulfate in the detergent, glass, and pulp and paper industries. These sectors require high-quality sodium sulfate for optimal performance and product quality, stimulating market expansion. Furthermore, the growing adoption of sodium sulfate in specialized applications, such as pharmaceutical manufacturing and water treatment, further contributes to market growth. Increased investment in research and development leading to new applications and improved production techniques also plays a significant role in shaping the market's positive outlook. However, fluctuating raw material prices and potential environmental regulations related to sodium sulfate production might pose challenges to the market's sustained growth.
High Purity Sodium Sulfate Market Size (In Billion)
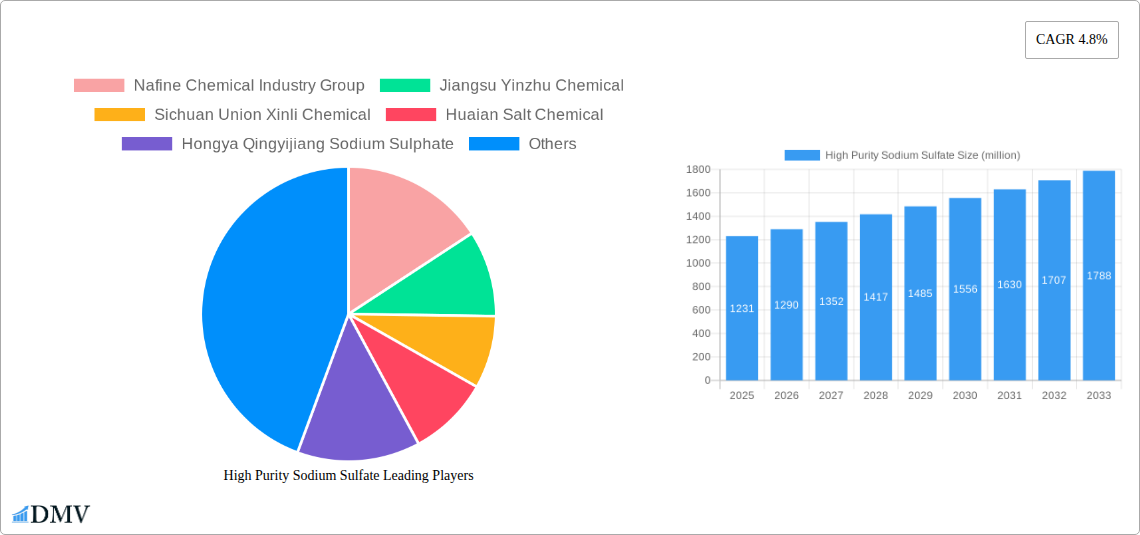
Competition within the high-purity sodium sulfate market is moderately concentrated, with key players like Nafine Chemical Industry Group, Jiangsu Yinzhu Chemical, and Sichuan Union Xinli Chemical holding significant market share. These companies are continuously striving to improve their product offerings and expand their geographic reach to cater to the growing demand. The market is geographically diverse, with regions like North America and Europe currently dominating due to established industrial infrastructure and high consumption rates. However, emerging economies in Asia-Pacific and other regions are expected to exhibit faster growth rates in the coming years, driven by industrialization and rising disposable incomes. The strategic expansions and mergers and acquisitions by major players will likely shape the competitive landscape further in the coming years. The market forecast for 2033 indicates a substantial increase in market value, with consistent growth expected across all segments.
High Purity Sodium Sulfate Company Market Share
High Purity Sodium Sulfate Market Report: 2019-2033 Forecast
This comprehensive report provides an in-depth analysis of the global high purity sodium sulfate market, projecting a market value exceeding XX million by 2033. The study period spans 2019-2033, with a base year of 2025 and a forecast period of 2025-2033. This report is indispensable for stakeholders seeking to understand market dynamics, identify lucrative opportunities, and strategize for future success in this rapidly evolving sector. Detailed analysis covers market composition, industry evolution, leading players, and future forecasts, equipping you with the actionable intelligence needed to thrive.
High Purity Sodium Sulfate Market Composition & Trends
This section meticulously dissects the global high purity sodium sulfate market, revealing its intricate structure and underlying trends. The report analyzes market concentration, highlighting the share held by key players like Nafine Chemical Industry Group, Jiangsu Yinzhu Chemical, and Sichuan Union Xinli Chemical. We explore the impact of innovation, including advancements in production processes and application-specific formulations, alongside the regulatory landscape and its influence on market dynamics. The analysis also includes a detailed examination of substitute products and their competitive impact. The report further profiles end-users across various industries, pinpointing key applications and consumption patterns. Finally, the section examines M&A activities, analyzing deal values and their implications for market consolidation, with estimated M&A deal values exceeding XX million during the historical period.
- Market Share Distribution: Nafine Chemical Industry Group holds an estimated XX% market share in 2025, followed by Jiangsu Yinzhu Chemical with XX%.
- Innovation Catalysts: Advancements in crystallization techniques and purification processes are driving market growth.
- Regulatory Landscape: Stringent environmental regulations are influencing production methods and driving demand for high-purity products.
- Substitute Products: Competition from alternative chemicals is analyzed, impacting market growth by approximately XX million annually.
- End-User Profiles: Key end-user segments include the detergent, glass, and textile industries, with projected consumption values in millions detailed in the report.
- M&A Activities: The report documents several significant mergers and acquisitions, with total deal values exceeding XX million between 2019 and 2024.
High Purity Sodium Sulfate Industry Evolution
This section delves into the historical and projected evolution of the high purity sodium sulfate market. The report meticulously traces market growth trajectories from 2019 to 2024, highlighting key milestones and inflection points. We analyze the adoption of new technologies, such as improved purification methods, and their influence on production efficiency and product quality. Further, the analysis considers shifts in consumer preferences and demands, identifying emerging trends and their implications for market growth. The report projects a compound annual growth rate (CAGR) of XX% from 2025 to 2033, driven by increased demand from key sectors, with specific data points such as growth rates and adoption metrics presented in detail within the full report. Technological advancements contributing to a XX million increase in production capacity are also explored. The analysis further considers the impact of consumer demand for sustainable and environmentally friendly products.
Leading Regions, Countries, or Segments in High Purity Sodium Sulfate
This section identifies the dominant regions and countries within the high purity sodium sulfate market. The report highlights the key factors driving this dominance, providing a comprehensive analysis of market leadership.
- Key Drivers:
- Investment Trends: Significant investments in production capacity expansion in [Dominant Region/Country] are driving market growth.
- Regulatory Support: Favorable government policies and incentives are fostering industry development in [Dominant Region/Country].
- Access to Raw Materials: Abundant and readily available raw materials contribute to cost-effectiveness and market dominance.
- Dominance Factors: [Dominant Region/Country] benefits from established infrastructure, a skilled workforce, and strong industry clusters, driving its leadership position. This is reflected in a market value exceeding XX million in 2025. The specific factors driving the dominance of this region, including favorable government policies and strategic location advantages, are comprehensively analyzed.
High Purity Sodium Sulfate Product Innovations
Recent years have witnessed significant product innovations in the high purity sodium sulfate market. Manufacturers are continuously developing novel formulations with enhanced purity levels, improved performance characteristics, and tailored applications. These innovations include the development of specialized grades for specific industries, leading to improved efficiency and product quality. The introduction of advanced purification techniques has also resulted in cost reductions and enhanced sustainability. These advancements contribute to the overall growth of the high purity sodium sulfate market and improve the efficiency and sustainability of end-use industries.
Propelling Factors for High Purity Sodium Sulfate Growth
Several factors contribute to the growth of the high purity sodium sulfate market. Technological advancements, such as improved production processes, are driving efficiency gains. Strong economic growth in key end-use industries, coupled with supportive government policies, is fueling demand. Furthermore, increasing awareness of environmental concerns and the adoption of sustainable practices are shaping market dynamics. These factors are expected to contribute to a market value exceeding XX million by 2033.
Obstacles in the High Purity Sodium Sulfate Market
Despite the growth potential, the high purity sodium sulfate market faces certain challenges. Stringent environmental regulations necessitate significant investments in pollution control technologies, increasing production costs. Supply chain disruptions, exacerbated by geopolitical uncertainties, can impact production and availability. Finally, intense competition among manufacturers puts downward pressure on pricing. These factors are estimated to impact market growth by approximately XX million annually.
Future Opportunities in High Purity Sodium Sulfate
The high purity sodium sulfate market presents significant future opportunities. The expansion into new and emerging markets, such as [mention specific emerging markets], holds tremendous potential. The development of innovative applications across diverse sectors also promises significant growth. Finally, technological advancements and process optimizations can drive efficiency gains and reduce costs. These opportunities are projected to contribute to an additional XX million in market value over the forecast period.
Major Players in the High Purity Sodium Sulfate Ecosystem
- Nafine Chemical Industry Group
- Jiangsu Yinzhu Chemical
- Sichuan Union Xinli Chemical
- Huaian Salt Chemical
- Hongya Qingyijiang Sodium Sulphate
- Grupo Industrial Crimidesa
- Minera de Santa Marta
- Alkim Alkali
- Lenzing Group
Key Developments in High Purity Sodium Sulfate Industry
- 2022 Q4: Nafine Chemical Industry Group announced a significant expansion of its production capacity.
- 2023 Q1: Jiangsu Yinzhu Chemical launched a new high-purity sodium sulfate product line.
- 2023 Q2: A merger between two smaller players resulted in a consolidated market share of XX%. (Further details within the full report.)
Strategic High Purity Sodium Sulfate Market Forecast
The high purity sodium sulfate market is poised for robust growth, driven by technological advancements, increasing demand from key industries, and favorable regulatory environments. Future opportunities lie in expanding into new applications and markets, alongside further process optimizations. This is expected to lead to a significant expansion of the market, exceeding XX million by 2033. The report provides detailed insights into these trends and offers strategic recommendations for stakeholders to capitalize on emerging opportunities.
High Purity Sodium Sulfate Segmentation
-
1. Application
- 1.1. Detergent and Cleaning Agent Industry
- 1.2. Glass Industry
- 1.3. Cellulose and Paper Industry
- 1.4. Textile and Leather Industry
- 1.5. Others
-
2. Types
- 2.1. Natural Product Sodium Sulfate
- 2.2. Byproduct Sodium Sulfate
High Purity Sodium Sulfate Segmentation By Geography
-
1. North America
- 1.1. United States
- 1.2. Canada
- 1.3. Mexico
-
2. South America
- 2.1. Brazil
- 2.2. Argentina
- 2.3. Rest of South America
-
3. Europe
- 3.1. United Kingdom
- 3.2. Germany
- 3.3. France
- 3.4. Italy
- 3.5. Spain
- 3.6. Russia
- 3.7. Benelux
- 3.8. Nordics
- 3.9. Rest of Europe
-
4. Middle East & Africa
- 4.1. Turkey
- 4.2. Israel
- 4.3. GCC
- 4.4. North Africa
- 4.5. South Africa
- 4.6. Rest of Middle East & Africa
-
5. Asia Pacific
- 5.1. China
- 5.2. India
- 5.3. Japan
- 5.4. South Korea
- 5.5. ASEAN
- 5.6. Oceania
- 5.7. Rest of Asia Pacific

High Purity Sodium Sulfate Regional Market Share
Geographic Coverage of High Purity Sodium Sulfate
High Purity Sodium Sulfate REPORT HIGHLIGHTS
| Aspects | Details |
|---|---|
| Study Period | 2020-2034 |
| Base Year | 2025 |
| Estimated Year | 2026 |
| Forecast Period | 2026-2034 |
| Historical Period | 2020-2025 |
| Growth Rate | CAGR of 4.8% from 2020-2034 |
| Segmentation |
|
Table of Contents
- 1. Introduction
- 1.1. Research Scope
- 1.2. Market Segmentation
- 1.3. Research Methodology
- 1.4. Definitions and Assumptions
- 2. Executive Summary
- 2.1. Introduction
- 3. Market Dynamics
- 3.1. Introduction
- 3.2. Market Drivers
- 3.3. Market Restrains
- 3.4. Market Trends
- 4. Market Factor Analysis
- 4.1. Porters Five Forces
- 4.2. Supply/Value Chain
- 4.3. PESTEL analysis
- 4.4. Market Entropy
- 4.5. Patent/Trademark Analysis
- 5. Global High Purity Sodium Sulfate Analysis, Insights and Forecast, 2020-2032
- 5.1. Market Analysis, Insights and Forecast - by Application
- 5.1.1. Detergent and Cleaning Agent Industry
- 5.1.2. Glass Industry
- 5.1.3. Cellulose and Paper Industry
- 5.1.4. Textile and Leather Industry
- 5.1.5. Others
- 5.2. Market Analysis, Insights and Forecast - by Types
- 5.2.1. Natural Product Sodium Sulfate
- 5.2.2. Byproduct Sodium Sulfate
- 5.3. Market Analysis, Insights and Forecast - by Region
- 5.3.1. North America
- 5.3.2. South America
- 5.3.3. Europe
- 5.3.4. Middle East & Africa
- 5.3.5. Asia Pacific
- 5.1. Market Analysis, Insights and Forecast - by Application
- 6. North America High Purity Sodium Sulfate Analysis, Insights and Forecast, 2020-2032
- 6.1. Market Analysis, Insights and Forecast - by Application
- 6.1.1. Detergent and Cleaning Agent Industry
- 6.1.2. Glass Industry
- 6.1.3. Cellulose and Paper Industry
- 6.1.4. Textile and Leather Industry
- 6.1.5. Others
- 6.2. Market Analysis, Insights and Forecast - by Types
- 6.2.1. Natural Product Sodium Sulfate
- 6.2.2. Byproduct Sodium Sulfate
- 6.1. Market Analysis, Insights and Forecast - by Application
- 7. South America High Purity Sodium Sulfate Analysis, Insights and Forecast, 2020-2032
- 7.1. Market Analysis, Insights and Forecast - by Application
- 7.1.1. Detergent and Cleaning Agent Industry
- 7.1.2. Glass Industry
- 7.1.3. Cellulose and Paper Industry
- 7.1.4. Textile and Leather Industry
- 7.1.5. Others
- 7.2. Market Analysis, Insights and Forecast - by Types
- 7.2.1. Natural Product Sodium Sulfate
- 7.2.2. Byproduct Sodium Sulfate
- 7.1. Market Analysis, Insights and Forecast - by Application
- 8. Europe High Purity Sodium Sulfate Analysis, Insights and Forecast, 2020-2032
- 8.1. Market Analysis, Insights and Forecast - by Application
- 8.1.1. Detergent and Cleaning Agent Industry
- 8.1.2. Glass Industry
- 8.1.3. Cellulose and Paper Industry
- 8.1.4. Textile and Leather Industry
- 8.1.5. Others
- 8.2. Market Analysis, Insights and Forecast - by Types
- 8.2.1. Natural Product Sodium Sulfate
- 8.2.2. Byproduct Sodium Sulfate
- 8.1. Market Analysis, Insights and Forecast - by Application
- 9. Middle East & Africa High Purity Sodium Sulfate Analysis, Insights and Forecast, 2020-2032
- 9.1. Market Analysis, Insights and Forecast - by Application
- 9.1.1. Detergent and Cleaning Agent Industry
- 9.1.2. Glass Industry
- 9.1.3. Cellulose and Paper Industry
- 9.1.4. Textile and Leather Industry
- 9.1.5. Others
- 9.2. Market Analysis, Insights and Forecast - by Types
- 9.2.1. Natural Product Sodium Sulfate
- 9.2.2. Byproduct Sodium Sulfate
- 9.1. Market Analysis, Insights and Forecast - by Application
- 10. Asia Pacific High Purity Sodium Sulfate Analysis, Insights and Forecast, 2020-2032
- 10.1. Market Analysis, Insights and Forecast - by Application
- 10.1.1. Detergent and Cleaning Agent Industry
- 10.1.2. Glass Industry
- 10.1.3. Cellulose and Paper Industry
- 10.1.4. Textile and Leather Industry
- 10.1.5. Others
- 10.2. Market Analysis, Insights and Forecast - by Types
- 10.2.1. Natural Product Sodium Sulfate
- 10.2.2. Byproduct Sodium Sulfate
- 10.1. Market Analysis, Insights and Forecast - by Application
- 11. Competitive Analysis
- 11.1. Global Market Share Analysis 2025
- 11.2. Company Profiles
- 11.2.1 Nafine Chemical Industry Group
- 11.2.1.1. Overview
- 11.2.1.2. Products
- 11.2.1.3. SWOT Analysis
- 11.2.1.4. Recent Developments
- 11.2.1.5. Financials (Based on Availability)
- 11.2.2 Jiangsu Yinzhu Chemical
- 11.2.2.1. Overview
- 11.2.2.2. Products
- 11.2.2.3. SWOT Analysis
- 11.2.2.4. Recent Developments
- 11.2.2.5. Financials (Based on Availability)
- 11.2.3 Sichuan Union Xinli Chemical
- 11.2.3.1. Overview
- 11.2.3.2. Products
- 11.2.3.3. SWOT Analysis
- 11.2.3.4. Recent Developments
- 11.2.3.5. Financials (Based on Availability)
- 11.2.4 Huaian Salt Chemical
- 11.2.4.1. Overview
- 11.2.4.2. Products
- 11.2.4.3. SWOT Analysis
- 11.2.4.4. Recent Developments
- 11.2.4.5. Financials (Based on Availability)
- 11.2.5 Hongya Qingyijiang Sodium Sulphate
- 11.2.5.1. Overview
- 11.2.5.2. Products
- 11.2.5.3. SWOT Analysis
- 11.2.5.4. Recent Developments
- 11.2.5.5. Financials (Based on Availability)
- 11.2.6 Grupo Industrial Crimidesa
- 11.2.6.1. Overview
- 11.2.6.2. Products
- 11.2.6.3. SWOT Analysis
- 11.2.6.4. Recent Developments
- 11.2.6.5. Financials (Based on Availability)
- 11.2.7 Minera de Santa Marta
- 11.2.7.1. Overview
- 11.2.7.2. Products
- 11.2.7.3. SWOT Analysis
- 11.2.7.4. Recent Developments
- 11.2.7.5. Financials (Based on Availability)
- 11.2.8 Alkim Alkali
- 11.2.8.1. Overview
- 11.2.8.2. Products
- 11.2.8.3. SWOT Analysis
- 11.2.8.4. Recent Developments
- 11.2.8.5. Financials (Based on Availability)
- 11.2.9 Lenzing Group
- 11.2.9.1. Overview
- 11.2.9.2. Products
- 11.2.9.3. SWOT Analysis
- 11.2.9.4. Recent Developments
- 11.2.9.5. Financials (Based on Availability)
- 11.2.1 Nafine Chemical Industry Group
List of Figures
- Figure 1: Global High Purity Sodium Sulfate Revenue Breakdown (million, %) by Region 2025 & 2033
- Figure 2: Global High Purity Sodium Sulfate Volume Breakdown (K, %) by Region 2025 & 2033
- Figure 3: North America High Purity Sodium Sulfate Revenue (million), by Application 2025 & 2033
- Figure 4: North America High Purity Sodium Sulfate Volume (K), by Application 2025 & 2033
- Figure 5: North America High Purity Sodium Sulfate Revenue Share (%), by Application 2025 & 2033
- Figure 6: North America High Purity Sodium Sulfate Volume Share (%), by Application 2025 & 2033
- Figure 7: North America High Purity Sodium Sulfate Revenue (million), by Types 2025 & 2033
- Figure 8: North America High Purity Sodium Sulfate Volume (K), by Types 2025 & 2033
- Figure 9: North America High Purity Sodium Sulfate Revenue Share (%), by Types 2025 & 2033
- Figure 10: North America High Purity Sodium Sulfate Volume Share (%), by Types 2025 & 2033
- Figure 11: North America High Purity Sodium Sulfate Revenue (million), by Country 2025 & 2033
- Figure 12: North America High Purity Sodium Sulfate Volume (K), by Country 2025 & 2033
- Figure 13: North America High Purity Sodium Sulfate Revenue Share (%), by Country 2025 & 2033
- Figure 14: North America High Purity Sodium Sulfate Volume Share (%), by Country 2025 & 2033
- Figure 15: South America High Purity Sodium Sulfate Revenue (million), by Application 2025 & 2033
- Figure 16: South America High Purity Sodium Sulfate Volume (K), by Application 2025 & 2033
- Figure 17: South America High Purity Sodium Sulfate Revenue Share (%), by Application 2025 & 2033
- Figure 18: South America High Purity Sodium Sulfate Volume Share (%), by Application 2025 & 2033
- Figure 19: South America High Purity Sodium Sulfate Revenue (million), by Types 2025 & 2033
- Figure 20: South America High Purity Sodium Sulfate Volume (K), by Types 2025 & 2033
- Figure 21: South America High Purity Sodium Sulfate Revenue Share (%), by Types 2025 & 2033
- Figure 22: South America High Purity Sodium Sulfate Volume Share (%), by Types 2025 & 2033
- Figure 23: South America High Purity Sodium Sulfate Revenue (million), by Country 2025 & 2033
- Figure 24: South America High Purity Sodium Sulfate Volume (K), by Country 2025 & 2033
- Figure 25: South America High Purity Sodium Sulfate Revenue Share (%), by Country 2025 & 2033
- Figure 26: South America High Purity Sodium Sulfate Volume Share (%), by Country 2025 & 2033
- Figure 27: Europe High Purity Sodium Sulfate Revenue (million), by Application 2025 & 2033
- Figure 28: Europe High Purity Sodium Sulfate Volume (K), by Application 2025 & 2033
- Figure 29: Europe High Purity Sodium Sulfate Revenue Share (%), by Application 2025 & 2033
- Figure 30: Europe High Purity Sodium Sulfate Volume Share (%), by Application 2025 & 2033
- Figure 31: Europe High Purity Sodium Sulfate Revenue (million), by Types 2025 & 2033
- Figure 32: Europe High Purity Sodium Sulfate Volume (K), by Types 2025 & 2033
- Figure 33: Europe High Purity Sodium Sulfate Revenue Share (%), by Types 2025 & 2033
- Figure 34: Europe High Purity Sodium Sulfate Volume Share (%), by Types 2025 & 2033
- Figure 35: Europe High Purity Sodium Sulfate Revenue (million), by Country 2025 & 2033
- Figure 36: Europe High Purity Sodium Sulfate Volume (K), by Country 2025 & 2033
- Figure 37: Europe High Purity Sodium Sulfate Revenue Share (%), by Country 2025 & 2033
- Figure 38: Europe High Purity Sodium Sulfate Volume Share (%), by Country 2025 & 2033
- Figure 39: Middle East & Africa High Purity Sodium Sulfate Revenue (million), by Application 2025 & 2033
- Figure 40: Middle East & Africa High Purity Sodium Sulfate Volume (K), by Application 2025 & 2033
- Figure 41: Middle East & Africa High Purity Sodium Sulfate Revenue Share (%), by Application 2025 & 2033
- Figure 42: Middle East & Africa High Purity Sodium Sulfate Volume Share (%), by Application 2025 & 2033
- Figure 43: Middle East & Africa High Purity Sodium Sulfate Revenue (million), by Types 2025 & 2033
- Figure 44: Middle East & Africa High Purity Sodium Sulfate Volume (K), by Types 2025 & 2033
- Figure 45: Middle East & Africa High Purity Sodium Sulfate Revenue Share (%), by Types 2025 & 2033
- Figure 46: Middle East & Africa High Purity Sodium Sulfate Volume Share (%), by Types 2025 & 2033
- Figure 47: Middle East & Africa High Purity Sodium Sulfate Revenue (million), by Country 2025 & 2033
- Figure 48: Middle East & Africa High Purity Sodium Sulfate Volume (K), by Country 2025 & 2033
- Figure 49: Middle East & Africa High Purity Sodium Sulfate Revenue Share (%), by Country 2025 & 2033
- Figure 50: Middle East & Africa High Purity Sodium Sulfate Volume Share (%), by Country 2025 & 2033
- Figure 51: Asia Pacific High Purity Sodium Sulfate Revenue (million), by Application 2025 & 2033
- Figure 52: Asia Pacific High Purity Sodium Sulfate Volume (K), by Application 2025 & 2033
- Figure 53: Asia Pacific High Purity Sodium Sulfate Revenue Share (%), by Application 2025 & 2033
- Figure 54: Asia Pacific High Purity Sodium Sulfate Volume Share (%), by Application 2025 & 2033
- Figure 55: Asia Pacific High Purity Sodium Sulfate Revenue (million), by Types 2025 & 2033
- Figure 56: Asia Pacific High Purity Sodium Sulfate Volume (K), by Types 2025 & 2033
- Figure 57: Asia Pacific High Purity Sodium Sulfate Revenue Share (%), by Types 2025 & 2033
- Figure 58: Asia Pacific High Purity Sodium Sulfate Volume Share (%), by Types 2025 & 2033
- Figure 59: Asia Pacific High Purity Sodium Sulfate Revenue (million), by Country 2025 & 2033
- Figure 60: Asia Pacific High Purity Sodium Sulfate Volume (K), by Country 2025 & 2033
- Figure 61: Asia Pacific High Purity Sodium Sulfate Revenue Share (%), by Country 2025 & 2033
- Figure 62: Asia Pacific High Purity Sodium Sulfate Volume Share (%), by Country 2025 & 2033
List of Tables
- Table 1: Global High Purity Sodium Sulfate Revenue million Forecast, by Application 2020 & 2033
- Table 2: Global High Purity Sodium Sulfate Volume K Forecast, by Application 2020 & 2033
- Table 3: Global High Purity Sodium Sulfate Revenue million Forecast, by Types 2020 & 2033
- Table 4: Global High Purity Sodium Sulfate Volume K Forecast, by Types 2020 & 2033
- Table 5: Global High Purity Sodium Sulfate Revenue million Forecast, by Region 2020 & 2033
- Table 6: Global High Purity Sodium Sulfate Volume K Forecast, by Region 2020 & 2033
- Table 7: Global High Purity Sodium Sulfate Revenue million Forecast, by Application 2020 & 2033
- Table 8: Global High Purity Sodium Sulfate Volume K Forecast, by Application 2020 & 2033
- Table 9: Global High Purity Sodium Sulfate Revenue million Forecast, by Types 2020 & 2033
- Table 10: Global High Purity Sodium Sulfate Volume K Forecast, by Types 2020 & 2033
- Table 11: Global High Purity Sodium Sulfate Revenue million Forecast, by Country 2020 & 2033
- Table 12: Global High Purity Sodium Sulfate Volume K Forecast, by Country 2020 & 2033
- Table 13: United States High Purity Sodium Sulfate Revenue (million) Forecast, by Application 2020 & 2033
- Table 14: United States High Purity Sodium Sulfate Volume (K) Forecast, by Application 2020 & 2033
- Table 15: Canada High Purity Sodium Sulfate Revenue (million) Forecast, by Application 2020 & 2033
- Table 16: Canada High Purity Sodium Sulfate Volume (K) Forecast, by Application 2020 & 2033
- Table 17: Mexico High Purity Sodium Sulfate Revenue (million) Forecast, by Application 2020 & 2033
- Table 18: Mexico High Purity Sodium Sulfate Volume (K) Forecast, by Application 2020 & 2033
- Table 19: Global High Purity Sodium Sulfate Revenue million Forecast, by Application 2020 & 2033
- Table 20: Global High Purity Sodium Sulfate Volume K Forecast, by Application 2020 & 2033
- Table 21: Global High Purity Sodium Sulfate Revenue million Forecast, by Types 2020 & 2033
- Table 22: Global High Purity Sodium Sulfate Volume K Forecast, by Types 2020 & 2033
- Table 23: Global High Purity Sodium Sulfate Revenue million Forecast, by Country 2020 & 2033
- Table 24: Global High Purity Sodium Sulfate Volume K Forecast, by Country 2020 & 2033
- Table 25: Brazil High Purity Sodium Sulfate Revenue (million) Forecast, by Application 2020 & 2033
- Table 26: Brazil High Purity Sodium Sulfate Volume (K) Forecast, by Application 2020 & 2033
- Table 27: Argentina High Purity Sodium Sulfate Revenue (million) Forecast, by Application 2020 & 2033
- Table 28: Argentina High Purity Sodium Sulfate Volume (K) Forecast, by Application 2020 & 2033
- Table 29: Rest of South America High Purity Sodium Sulfate Revenue (million) Forecast, by Application 2020 & 2033
- Table 30: Rest of South America High Purity Sodium Sulfate Volume (K) Forecast, by Application 2020 & 2033
- Table 31: Global High Purity Sodium Sulfate Revenue million Forecast, by Application 2020 & 2033
- Table 32: Global High Purity Sodium Sulfate Volume K Forecast, by Application 2020 & 2033
- Table 33: Global High Purity Sodium Sulfate Revenue million Forecast, by Types 2020 & 2033
- Table 34: Global High Purity Sodium Sulfate Volume K Forecast, by Types 2020 & 2033
- Table 35: Global High Purity Sodium Sulfate Revenue million Forecast, by Country 2020 & 2033
- Table 36: Global High Purity Sodium Sulfate Volume K Forecast, by Country 2020 & 2033
- Table 37: United Kingdom High Purity Sodium Sulfate Revenue (million) Forecast, by Application 2020 & 2033
- Table 38: United Kingdom High Purity Sodium Sulfate Volume (K) Forecast, by Application 2020 & 2033
- Table 39: Germany High Purity Sodium Sulfate Revenue (million) Forecast, by Application 2020 & 2033
- Table 40: Germany High Purity Sodium Sulfate Volume (K) Forecast, by Application 2020 & 2033
- Table 41: France High Purity Sodium Sulfate Revenue (million) Forecast, by Application 2020 & 2033
- Table 42: France High Purity Sodium Sulfate Volume (K) Forecast, by Application 2020 & 2033
- Table 43: Italy High Purity Sodium Sulfate Revenue (million) Forecast, by Application 2020 & 2033
- Table 44: Italy High Purity Sodium Sulfate Volume (K) Forecast, by Application 2020 & 2033
- Table 45: Spain High Purity Sodium Sulfate Revenue (million) Forecast, by Application 2020 & 2033
- Table 46: Spain High Purity Sodium Sulfate Volume (K) Forecast, by Application 2020 & 2033
- Table 47: Russia High Purity Sodium Sulfate Revenue (million) Forecast, by Application 2020 & 2033
- Table 48: Russia High Purity Sodium Sulfate Volume (K) Forecast, by Application 2020 & 2033
- Table 49: Benelux High Purity Sodium Sulfate Revenue (million) Forecast, by Application 2020 & 2033
- Table 50: Benelux High Purity Sodium Sulfate Volume (K) Forecast, by Application 2020 & 2033
- Table 51: Nordics High Purity Sodium Sulfate Revenue (million) Forecast, by Application 2020 & 2033
- Table 52: Nordics High Purity Sodium Sulfate Volume (K) Forecast, by Application 2020 & 2033
- Table 53: Rest of Europe High Purity Sodium Sulfate Revenue (million) Forecast, by Application 2020 & 2033
- Table 54: Rest of Europe High Purity Sodium Sulfate Volume (K) Forecast, by Application 2020 & 2033
- Table 55: Global High Purity Sodium Sulfate Revenue million Forecast, by Application 2020 & 2033
- Table 56: Global High Purity Sodium Sulfate Volume K Forecast, by Application 2020 & 2033
- Table 57: Global High Purity Sodium Sulfate Revenue million Forecast, by Types 2020 & 2033
- Table 58: Global High Purity Sodium Sulfate Volume K Forecast, by Types 2020 & 2033
- Table 59: Global High Purity Sodium Sulfate Revenue million Forecast, by Country 2020 & 2033
- Table 60: Global High Purity Sodium Sulfate Volume K Forecast, by Country 2020 & 2033
- Table 61: Turkey High Purity Sodium Sulfate Revenue (million) Forecast, by Application 2020 & 2033
- Table 62: Turkey High Purity Sodium Sulfate Volume (K) Forecast, by Application 2020 & 2033
- Table 63: Israel High Purity Sodium Sulfate Revenue (million) Forecast, by Application 2020 & 2033
- Table 64: Israel High Purity Sodium Sulfate Volume (K) Forecast, by Application 2020 & 2033
- Table 65: GCC High Purity Sodium Sulfate Revenue (million) Forecast, by Application 2020 & 2033
- Table 66: GCC High Purity Sodium Sulfate Volume (K) Forecast, by Application 2020 & 2033
- Table 67: North Africa High Purity Sodium Sulfate Revenue (million) Forecast, by Application 2020 & 2033
- Table 68: North Africa High Purity Sodium Sulfate Volume (K) Forecast, by Application 2020 & 2033
- Table 69: South Africa High Purity Sodium Sulfate Revenue (million) Forecast, by Application 2020 & 2033
- Table 70: South Africa High Purity Sodium Sulfate Volume (K) Forecast, by Application 2020 & 2033
- Table 71: Rest of Middle East & Africa High Purity Sodium Sulfate Revenue (million) Forecast, by Application 2020 & 2033
- Table 72: Rest of Middle East & Africa High Purity Sodium Sulfate Volume (K) Forecast, by Application 2020 & 2033
- Table 73: Global High Purity Sodium Sulfate Revenue million Forecast, by Application 2020 & 2033
- Table 74: Global High Purity Sodium Sulfate Volume K Forecast, by Application 2020 & 2033
- Table 75: Global High Purity Sodium Sulfate Revenue million Forecast, by Types 2020 & 2033
- Table 76: Global High Purity Sodium Sulfate Volume K Forecast, by Types 2020 & 2033
- Table 77: Global High Purity Sodium Sulfate Revenue million Forecast, by Country 2020 & 2033
- Table 78: Global High Purity Sodium Sulfate Volume K Forecast, by Country 2020 & 2033
- Table 79: China High Purity Sodium Sulfate Revenue (million) Forecast, by Application 2020 & 2033
- Table 80: China High Purity Sodium Sulfate Volume (K) Forecast, by Application 2020 & 2033
- Table 81: India High Purity Sodium Sulfate Revenue (million) Forecast, by Application 2020 & 2033
- Table 82: India High Purity Sodium Sulfate Volume (K) Forecast, by Application 2020 & 2033
- Table 83: Japan High Purity Sodium Sulfate Revenue (million) Forecast, by Application 2020 & 2033
- Table 84: Japan High Purity Sodium Sulfate Volume (K) Forecast, by Application 2020 & 2033
- Table 85: South Korea High Purity Sodium Sulfate Revenue (million) Forecast, by Application 2020 & 2033
- Table 86: South Korea High Purity Sodium Sulfate Volume (K) Forecast, by Application 2020 & 2033
- Table 87: ASEAN High Purity Sodium Sulfate Revenue (million) Forecast, by Application 2020 & 2033
- Table 88: ASEAN High Purity Sodium Sulfate Volume (K) Forecast, by Application 2020 & 2033
- Table 89: Oceania High Purity Sodium Sulfate Revenue (million) Forecast, by Application 2020 & 2033
- Table 90: Oceania High Purity Sodium Sulfate Volume (K) Forecast, by Application 2020 & 2033
- Table 91: Rest of Asia Pacific High Purity Sodium Sulfate Revenue (million) Forecast, by Application 2020 & 2033
- Table 92: Rest of Asia Pacific High Purity Sodium Sulfate Volume (K) Forecast, by Application 2020 & 2033
Frequently Asked Questions
1. What is the projected Compound Annual Growth Rate (CAGR) of the High Purity Sodium Sulfate?
The projected CAGR is approximately 4.8%.
2. Which companies are prominent players in the High Purity Sodium Sulfate?
Key companies in the market include Nafine Chemical Industry Group, Jiangsu Yinzhu Chemical, Sichuan Union Xinli Chemical, Huaian Salt Chemical, Hongya Qingyijiang Sodium Sulphate, Grupo Industrial Crimidesa, Minera de Santa Marta, Alkim Alkali, Lenzing Group.
3. What are the main segments of the High Purity Sodium Sulfate?
The market segments include Application, Types.
4. Can you provide details about the market size?
The market size is estimated to be USD 1231 million as of 2022.
5. What are some drivers contributing to market growth?
N/A
6. What are the notable trends driving market growth?
N/A
7. Are there any restraints impacting market growth?
N/A
8. Can you provide examples of recent developments in the market?
N/A
9. What pricing options are available for accessing the report?
Pricing options include single-user, multi-user, and enterprise licenses priced at USD 3950.00, USD 5925.00, and USD 7900.00 respectively.
10. Is the market size provided in terms of value or volume?
The market size is provided in terms of value, measured in million and volume, measured in K.
11. Are there any specific market keywords associated with the report?
Yes, the market keyword associated with the report is "High Purity Sodium Sulfate," which aids in identifying and referencing the specific market segment covered.
12. How do I determine which pricing option suits my needs best?
The pricing options vary based on user requirements and access needs. Individual users may opt for single-user licenses, while businesses requiring broader access may choose multi-user or enterprise licenses for cost-effective access to the report.
13. Are there any additional resources or data provided in the High Purity Sodium Sulfate report?
While the report offers comprehensive insights, it's advisable to review the specific contents or supplementary materials provided to ascertain if additional resources or data are available.
14. How can I stay updated on further developments or reports in the High Purity Sodium Sulfate?
To stay informed about further developments, trends, and reports in the High Purity Sodium Sulfate, consider subscribing to industry newsletters, following relevant companies and organizations, or regularly checking reputable industry news sources and publications.
Methodology
Step 1 - Identification of Relevant Samples Size from Population Database


Step 2 - Approaches for Defining Global Market Size (Value, Volume* & Price*)

Note*: In applicable scenarios
Step 3 - Data Sources
Primary Research
- Web Analytics
- Survey Reports
- Research Institute
- Latest Research Reports
- Opinion Leaders
Secondary Research
- Annual Reports
- White Paper
- Latest Press Release
- Industry Association
- Paid Database
- Investor Presentations

Step 4 - Data Triangulation
Involves using different sources of information in order to increase the validity of a study
These sources are likely to be stakeholders in a program - participants, other researchers, program staff, other community members, and so on.
Then we put all data in single framework & apply various statistical tools to find out the dynamic on the market.
During the analysis stage, feedback from the stakeholder groups would be compared to determine areas of agreement as well as areas of divergence