

Key Insights
The Geostationary Earth Orbit (GEO) satellite market is experiencing robust growth, driven by increasing demand for high-throughput communication, advanced earth observation capabilities, and precise navigation systems. The market's Compound Annual Growth Rate (CAGR) of 4.96% from 2019 to 2024 suggests a consistently expanding sector. Several factors contribute to this growth. The proliferation of high-bandwidth applications, including 5G networks and broadband internet access, necessitates greater satellite capacity, fueling demand for GEO satellites. Furthermore, advancements in satellite technology, such as improved propulsion systems (electric and advanced liquid fuel options) and miniaturization (leading to more satellites in the 100-500kg range), are driving down costs and increasing efficiency. The expanding role of GEO satellites in environmental monitoring, disaster management, and military applications further propels market expansion. While regulatory hurdles and launch costs pose challenges, the overall market outlook remains positive, with continued growth projected through 2033.
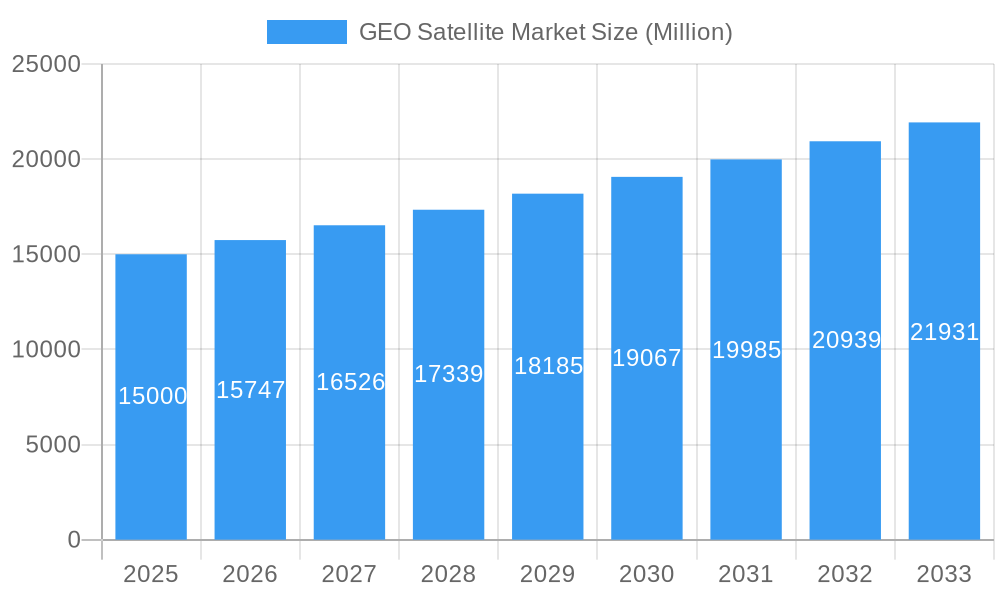
GEO Satellite Market Market Size (In Billion)
Segmentation analysis reveals strong growth across various applications. Communication satellites maintain a significant market share, benefiting from the burgeoning telecommunications industry. Earth observation, driven by the need for environmental monitoring and resource management, is another rapidly growing segment. The navigation sector contributes significantly, particularly with the increasing reliance on satellite-based positioning systems. The market is largely dominated by major players like Lockheed Martin, Boeing, and Airbus, along with government agencies like JAXA and ISRO. However, the emergence of new space companies and the increasing adoption of electric propulsion technologies are fostering competition and driving innovation within the GEO satellite market. The largest satellite mass segment is likely the 100-500kg category, reflecting industry trends toward smaller, more cost-effective satellites. The commercial sector holds a larger market share compared to military and government, but government investment continues to be a significant factor in technological advancement and mission deployments.
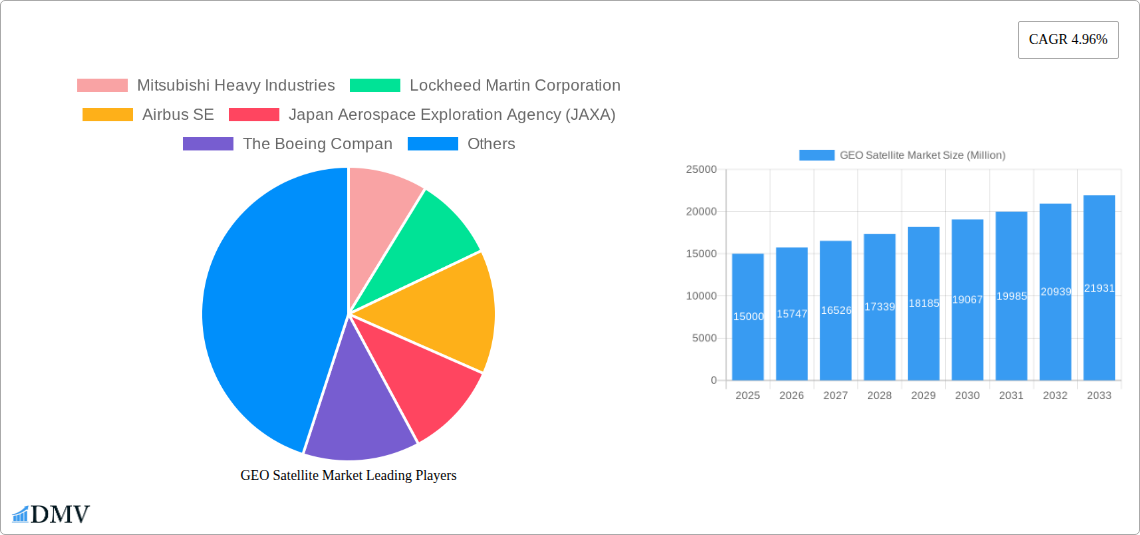
GEO Satellite Market Company Market Share
GEO Satellite Market: A Comprehensive Report (2019-2033)
This insightful report provides a detailed analysis of the GEO Satellite Market, offering a comprehensive overview of its current state and future trajectory. Covering the period from 2019 to 2033, with a focus on 2025, this report is an indispensable resource for stakeholders seeking to understand this dynamic sector. The market is projected to reach xx Million by 2033, exhibiting a Compound Annual Growth Rate (CAGR) of xx% during the forecast period (2025-2033).
GEO Satellite Market Composition & Trends
This section delves into the intricate landscape of the GEO satellite market, examining market concentration, innovation drivers, regulatory frameworks, substitute technologies, and end-user dynamics. We analyze mergers and acquisitions (M&A) activity, providing insights into deal values and their impact on market share distribution. The global GEO satellite market is moderately concentrated, with key players holding significant shares. However, the emergence of new entrants and technological advancements contribute to a competitive environment.
- Market Concentration: The top 5 players account for approximately xx% of the market share in 2025.
- Innovation Catalysts: Miniaturization, increased payload capacity, and advancements in propulsion systems are key drivers of innovation.
- Regulatory Landscape: Stringent regulations surrounding satellite launches and orbital slots influence market dynamics.
- Substitute Products: While GEO satellites remain dominant, terrestrial communication networks and other satellite technologies present some level of substitution.
- End-User Profiles: The commercial sector (telecommunications, broadcasting) dominates, followed by military and government applications.
- M&A Activities: The historical period (2019-2024) saw xx M&A deals totaling approximately xx Million, with an average deal value of xx Million.
GEO Satellite Market Industry Evolution
This section examines the historical and projected growth trajectories of the GEO satellite market. We analyze technological advancements, shifting consumer demands, and the influence of macroeconomic factors. The market experienced significant growth in the historical period (2019-2024), driven primarily by the increasing demand for high-bandwidth communication services and the expansion of navigation and earth observation applications. The adoption of electric propulsion systems is gradually increasing, contributing to lower operational costs and longer satellite lifespans. Future growth will be fueled by the development of new applications, such as internet-of-things (IoT) and satellite-based broadband services, along with technological improvements.
- Growth Rate: The market grew at a CAGR of xx% between 2019 and 2024.
- Adoption Metrics: Adoption of electric propulsion technology is projected to reach xx% by 2033.
- Technological Advancements: Improved antenna designs, higher-capacity payloads, and the use of advanced materials are driving market expansion.
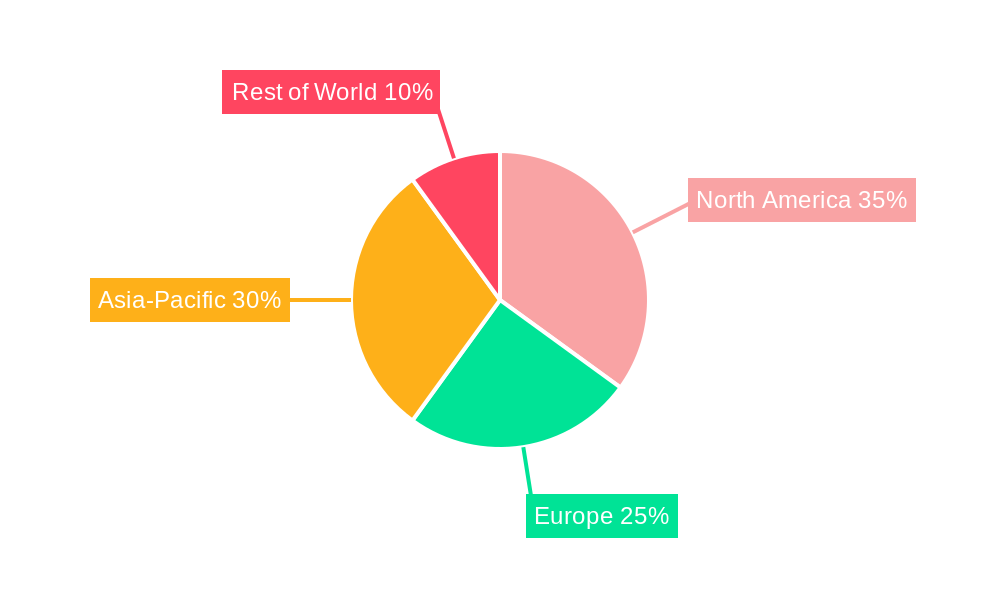
Leading Regions, Countries, or Segments in GEO Satellite Market
This section identifies the dominant regions, countries, and market segments within the GEO satellite market. The analysis is broken down by application, satellite mass, end-user, and propulsion technology.
- Dominant Region: North America currently holds the largest market share due to significant investments in satellite technology and a strong presence of major industry players.
Key Drivers by Segment:
- Application: Communication satellites dominate due to high demand for broadband and broadcasting services. Government investment drives strong growth in navigation and earth observation segments.
- Communication: Driven by increasing demand for high-throughput satellite (HTS) networks.
- Earth Observation: Fueled by the need for environmental monitoring and resource management.
- Navigation: Supported by the growing adoption of GNSS technologies.
- Satellite Mass: The 100-500kg segment is experiencing significant growth due to cost-effectiveness and technological advancements.
- End-User: Commercial applications represent the largest share, driven by private sector investments. Government and military segments show consistent growth due to national security and defense needs.
- Propulsion Technology: Electric propulsion systems are gaining traction, spurred by their higher efficiency and reduced fuel costs.
GEO Satellite Market Product Innovations
Recent innovations include advancements in satellite bus designs, high-throughput payloads, and electric propulsion systems. These improvements deliver enhanced performance, reduced operational costs, and extended satellite lifespans. Companies are focusing on developing smaller, more affordable satellites with increased capabilities to cater to the growing demand for diverse applications, including IoT and satellite broadband services.
Propelling Factors for GEO Satellite Market Growth
The GEO satellite market growth is driven by several factors: the increasing demand for high-bandwidth communication services, advancements in satellite technology, government investments in space programs, and the expanding application of satellite data in various sectors. The rising adoption of electric propulsion is reducing operational costs and extending satellite lifecycles, further fueling market expansion.
Obstacles in the GEO Satellite Market
Major challenges include the high cost of satellite development and launch, regulatory complexities related to spectrum allocation and orbital slots, supply chain disruptions impacting the availability of components, and intense competition among established players and new entrants. These factors can hinder market growth and require innovative solutions to overcome.
Future Opportunities in GEO Satellite Market
Emerging opportunities exist in the development of next-generation satellite constellations, the expansion of IoT applications, the growth of satellite-based broadband services, and the increasing demand for high-resolution earth observation data for various sectors. The development of more efficient and cost-effective satellite technology presents significant opportunities for growth in this sector.
Major Players in the GEO Satellite Market Ecosystem
- Mitsubishi Heavy Industries
- Lockheed Martin Corporation
- Airbus SE
- Japan Aerospace Exploration Agency (JAXA)
- The Boeing Company
- China Aerospace Science and Technology Corporation (CASC)
- Thales
- Maxar Technologies Inc
- Northrop Grumman Corporation
- Indian Space Research Organisation (ISRO)
Key Developments in GEO Satellite Market Industry
- February 2023: China launched the Zhongxing-26 communications satellite, anticipated to be used for military purposes. This launch highlights the increasing military applications of GEO satellites.
- January 2023: Airbus secured a contract from Inmarsat to build a geostationary telecommunications satellite (I-6 F2), showcasing continued demand for commercial GEO satellites.
- December 2022: Airbus completed the System Critical Design Review for the EGNOS V3 satellite-based augmentation system, indicating advancements in navigation satellite technology.
Strategic GEO Satellite Market Forecast
The GEO satellite market is poised for continued growth driven by increasing demand for communication, navigation, and earth observation services. Technological advancements, government investments, and the expansion of new applications such as IoT and satellite broadband will further fuel market expansion. The market is expected to witness strong growth in the coming years, driven by the factors mentioned above and innovative solutions for addressing the existing market challenges.
GEO Satellite Market Segmentation
-
1. Application
- 1.1. Communication
- 1.2. Earth Observation
- 1.3. Navigation
- 1.4. Space Observation
- 1.5. Others
-
2. Satellite Mass
- 2.1. 10-100kg
- 2.2. 100-500kg
- 2.3. 500-1000kg
- 2.4. above 1000kg
-
3. End User
- 3.1. Commercial
- 3.2. Military & Government
- 3.3. Other
-
4. Propulsion Tech
- 4.1. Electric
- 4.2. Gas based
- 4.3. Liquid Fuel
GEO Satellite Market Segmentation By Geography
-
1. North America
- 1.1. United States
- 1.2. Canada
- 1.3. Mexico
-
2. South America
- 2.1. Brazil
- 2.2. Argentina
- 2.3. Rest of South America
-
3. Europe
- 3.1. United Kingdom
- 3.2. Germany
- 3.3. France
- 3.4. Italy
- 3.5. Spain
- 3.6. Russia
- 3.7. Benelux
- 3.8. Nordics
- 3.9. Rest of Europe
-
4. Middle East & Africa
- 4.1. Turkey
- 4.2. Israel
- 4.3. GCC
- 4.4. North Africa
- 4.5. South Africa
- 4.6. Rest of Middle East & Africa
-
5. Asia Pacific
- 5.1. China
- 5.2. India
- 5.3. Japan
- 5.4. South Korea
- 5.5. ASEAN
- 5.6. Oceania
- 5.7. Rest of Asia Pacific
GEO Satellite Market Regional Market Share
Geographic Coverage of GEO Satellite Market
GEO Satellite Market REPORT HIGHLIGHTS
| Aspects | Details |
|---|---|
| Study Period | 2020-2034 |
| Base Year | 2025 |
| Estimated Year | 2026 |
| Forecast Period | 2026-2034 |
| Historical Period | 2020-2025 |
| Growth Rate | CAGR of 18.1% from 2020-2034 |
| Segmentation |
|
Table of Contents
- 1. Introduction
- 1.1. Research Scope
- 1.2. Market Segmentation
- 1.3. Research Objective
- 1.4. Definitions and Assumptions
- 2. Executive Summary
- 2.1. Market Snapshot
- 3. Market Dynamics
- 3.1. Market Drivers
- 3.2. Market Restrains
- 3.3. Market Trends
- 3.4. Market Opportunities
- 4. Market Factor Analysis
- 4.1. Porters Five Forces
- 4.1.1. Bargaining Power of Suppliers
- 4.1.2. Bargaining Power of Buyers
- 4.1.3. Threat of New Entrants
- 4.1.4. Threat of Substitutes
- 4.1.5. Competitive Rivalry
- 4.2. PESTEL analysis
- 4.3. BCG Analysis
- 4.3.1. Stars (High Growth, High Market Share)
- 4.3.2. Cash Cows (Low Growth, High Market Share)
- 4.3.3. Question Mark (High Growth, Low Market Share)
- 4.3.4. Dogs (Low Growth, Low Market Share)
- 4.4. Ansoff Matrix Analysis
- 4.5. Supply Chain Analysis
- 4.6. Regulatory Landscape
- 4.7. Current Market Potential and Opportunity Assessment (TAM–SAM–SOM Framework)
- 4.8. DMV Analyst Note
- 4.1. Porters Five Forces
- 5. Market Analysis, Insights and Forecast 2021-2033
- 5.1. Market Analysis, Insights and Forecast - by Application
- 5.1.1. Communication
- 5.1.2. Earth Observation
- 5.1.3. Navigation
- 5.1.4. Space Observation
- 5.1.5. Others
- 5.2. Market Analysis, Insights and Forecast - by Satellite Mass
- 5.2.1. 10-100kg
- 5.2.2. 100-500kg
- 5.2.3. 500-1000kg
- 5.2.4. above 1000kg
- 5.3. Market Analysis, Insights and Forecast - by End User
- 5.3.1. Commercial
- 5.3.2. Military & Government
- 5.3.3. Other
- 5.4. Market Analysis, Insights and Forecast - by Propulsion Tech
- 5.4.1. Electric
- 5.4.2. Gas based
- 5.4.3. Liquid Fuel
- 5.5. Market Analysis, Insights and Forecast - by Region
- 5.5.1. North America
- 5.5.2. South America
- 5.5.3. Europe
- 5.5.4. Middle East & Africa
- 5.5.5. Asia Pacific
- 5.1. Market Analysis, Insights and Forecast - by Application
- 6. Global GEO Satellite Market Analysis, Insights and Forecast, 2021-2033
- 6.1. Market Analysis, Insights and Forecast - by Application
- 6.1.1. Communication
- 6.1.2. Earth Observation
- 6.1.3. Navigation
- 6.1.4. Space Observation
- 6.1.5. Others
- 6.2. Market Analysis, Insights and Forecast - by Satellite Mass
- 6.2.1. 10-100kg
- 6.2.2. 100-500kg
- 6.2.3. 500-1000kg
- 6.2.4. above 1000kg
- 6.3. Market Analysis, Insights and Forecast - by End User
- 6.3.1. Commercial
- 6.3.2. Military & Government
- 6.3.3. Other
- 6.4. Market Analysis, Insights and Forecast - by Propulsion Tech
- 6.4.1. Electric
- 6.4.2. Gas based
- 6.4.3. Liquid Fuel
- 6.1. Market Analysis, Insights and Forecast - by Application
- 7. North America GEO Satellite Market Analysis, Insights and Forecast, 2020-2032
- 7.1. Market Analysis, Insights and Forecast - by Application
- 7.1.1. Communication
- 7.1.2. Earth Observation
- 7.1.3. Navigation
- 7.1.4. Space Observation
- 7.1.5. Others
- 7.2. Market Analysis, Insights and Forecast - by Satellite Mass
- 7.2.1. 10-100kg
- 7.2.2. 100-500kg
- 7.2.3. 500-1000kg
- 7.2.4. above 1000kg
- 7.3. Market Analysis, Insights and Forecast - by End User
- 7.3.1. Commercial
- 7.3.2. Military & Government
- 7.3.3. Other
- 7.4. Market Analysis, Insights and Forecast - by Propulsion Tech
- 7.4.1. Electric
- 7.4.2. Gas based
- 7.4.3. Liquid Fuel
- 7.1. Market Analysis, Insights and Forecast - by Application
- 8. South America GEO Satellite Market Analysis, Insights and Forecast, 2020-2032
- 8.1. Market Analysis, Insights and Forecast - by Application
- 8.1.1. Communication
- 8.1.2. Earth Observation
- 8.1.3. Navigation
- 8.1.4. Space Observation
- 8.1.5. Others
- 8.2. Market Analysis, Insights and Forecast - by Satellite Mass
- 8.2.1. 10-100kg
- 8.2.2. 100-500kg
- 8.2.3. 500-1000kg
- 8.2.4. above 1000kg
- 8.3. Market Analysis, Insights and Forecast - by End User
- 8.3.1. Commercial
- 8.3.2. Military & Government
- 8.3.3. Other
- 8.4. Market Analysis, Insights and Forecast - by Propulsion Tech
- 8.4.1. Electric
- 8.4.2. Gas based
- 8.4.3. Liquid Fuel
- 8.1. Market Analysis, Insights and Forecast - by Application
- 9. Europe GEO Satellite Market Analysis, Insights and Forecast, 2020-2032
- 9.1. Market Analysis, Insights and Forecast - by Application
- 9.1.1. Communication
- 9.1.2. Earth Observation
- 9.1.3. Navigation
- 9.1.4. Space Observation
- 9.1.5. Others
- 9.2. Market Analysis, Insights and Forecast - by Satellite Mass
- 9.2.1. 10-100kg
- 9.2.2. 100-500kg
- 9.2.3. 500-1000kg
- 9.2.4. above 1000kg
- 9.3. Market Analysis, Insights and Forecast - by End User
- 9.3.1. Commercial
- 9.3.2. Military & Government
- 9.3.3. Other
- 9.4. Market Analysis, Insights and Forecast - by Propulsion Tech
- 9.4.1. Electric
- 9.4.2. Gas based
- 9.4.3. Liquid Fuel
- 9.1. Market Analysis, Insights and Forecast - by Application
- 10. Middle East & Africa GEO Satellite Market Analysis, Insights and Forecast, 2020-2032
- 10.1. Market Analysis, Insights and Forecast - by Application
- 10.1.1. Communication
- 10.1.2. Earth Observation
- 10.1.3. Navigation
- 10.1.4. Space Observation
- 10.1.5. Others
- 10.2. Market Analysis, Insights and Forecast - by Satellite Mass
- 10.2.1. 10-100kg
- 10.2.2. 100-500kg
- 10.2.3. 500-1000kg
- 10.2.4. above 1000kg
- 10.3. Market Analysis, Insights and Forecast - by End User
- 10.3.1. Commercial
- 10.3.2. Military & Government
- 10.3.3. Other
- 10.4. Market Analysis, Insights and Forecast - by Propulsion Tech
- 10.4.1. Electric
- 10.4.2. Gas based
- 10.4.3. Liquid Fuel
- 10.1. Market Analysis, Insights and Forecast - by Application
- 11. Asia Pacific GEO Satellite Market Analysis, Insights and Forecast, 2020-2032
- 11.1. Market Analysis, Insights and Forecast - by Application
- 11.1.1. Communication
- 11.1.2. Earth Observation
- 11.1.3. Navigation
- 11.1.4. Space Observation
- 11.1.5. Others
- 11.2. Market Analysis, Insights and Forecast - by Satellite Mass
- 11.2.1. 10-100kg
- 11.2.2. 100-500kg
- 11.2.3. 500-1000kg
- 11.2.4. above 1000kg
- 11.3. Market Analysis, Insights and Forecast - by End User
- 11.3.1. Commercial
- 11.3.2. Military & Government
- 11.3.3. Other
- 11.4. Market Analysis, Insights and Forecast - by Propulsion Tech
- 11.4.1. Electric
- 11.4.2. Gas based
- 11.4.3. Liquid Fuel
- 11.1. Market Analysis, Insights and Forecast - by Application
- 12. Competitive Analysis
- 12.1. Company Profiles
- 12.1.1 Mitsubishi Heavy Industries
- 12.1.1.1. Company Overview
- 12.1.1.2. Products
- 12.1.1.3. Company Financials
- 12.1.1.4. SWOT Analysis
- 12.1.2 Lockheed Martin Corporation
- 12.1.2.1. Company Overview
- 12.1.2.2. Products
- 12.1.2.3. Company Financials
- 12.1.2.4. SWOT Analysis
- 12.1.3 Airbus SE
- 12.1.3.1. Company Overview
- 12.1.3.2. Products
- 12.1.3.3. Company Financials
- 12.1.3.4. SWOT Analysis
- 12.1.4 Japan Aerospace Exploration Agency (JAXA)
- 12.1.4.1. Company Overview
- 12.1.4.2. Products
- 12.1.4.3. Company Financials
- 12.1.4.4. SWOT Analysis
- 12.1.5 The Boeing Compan
- 12.1.5.1. Company Overview
- 12.1.5.2. Products
- 12.1.5.3. Company Financials
- 12.1.5.4. SWOT Analysis
- 12.1.6 China Aerospace Science and Technology Corporation (CASC)
- 12.1.6.1. Company Overview
- 12.1.6.2. Products
- 12.1.6.3. Company Financials
- 12.1.6.4. SWOT Analysis
- 12.1.7 Thales
- 12.1.7.1. Company Overview
- 12.1.7.2. Products
- 12.1.7.3. Company Financials
- 12.1.7.4. SWOT Analysis
- 12.1.8 Maxar Technologies Inc
- 12.1.8.1. Company Overview
- 12.1.8.2. Products
- 12.1.8.3. Company Financials
- 12.1.8.4. SWOT Analysis
- 12.1.9 Northrop Grumman Corporation
- 12.1.9.1. Company Overview
- 12.1.9.2. Products
- 12.1.9.3. Company Financials
- 12.1.9.4. SWOT Analysis
- 12.1.10 Indian Space Research Organisation (ISRO)
- 12.1.10.1. Company Overview
- 12.1.10.2. Products
- 12.1.10.3. Company Financials
- 12.1.10.4. SWOT Analysis
- 12.1.1 Mitsubishi Heavy Industries
- 12.2. Market Entropy
- 12.2.1 Company's Key Areas Served
- 12.2.2 Recent Developments
- 12.3. Company Market Share Analysis 2025
- 12.3.1 Top 5 Companies Market Share Analysis
- 12.3.2 Top 3 Companies Market Share Analysis
- 12.4. List of Potential Customers
- 13. Research Methodology
List of Figures
- Figure 1: Global GEO Satellite Market Revenue Breakdown (billion, %) by Region 2025 & 2033
- Figure 2: North America GEO Satellite Market Revenue (billion), by Application 2025 & 2033
- Figure 3: North America GEO Satellite Market Revenue Share (%), by Application 2025 & 2033
- Figure 4: North America GEO Satellite Market Revenue (billion), by Satellite Mass 2025 & 2033
- Figure 5: North America GEO Satellite Market Revenue Share (%), by Satellite Mass 2025 & 2033
- Figure 6: North America GEO Satellite Market Revenue (billion), by End User 2025 & 2033
- Figure 7: North America GEO Satellite Market Revenue Share (%), by End User 2025 & 2033
- Figure 8: North America GEO Satellite Market Revenue (billion), by Propulsion Tech 2025 & 2033
- Figure 9: North America GEO Satellite Market Revenue Share (%), by Propulsion Tech 2025 & 2033
- Figure 10: North America GEO Satellite Market Revenue (billion), by Country 2025 & 2033
- Figure 11: North America GEO Satellite Market Revenue Share (%), by Country 2025 & 2033
- Figure 12: South America GEO Satellite Market Revenue (billion), by Application 2025 & 2033
- Figure 13: South America GEO Satellite Market Revenue Share (%), by Application 2025 & 2033
- Figure 14: South America GEO Satellite Market Revenue (billion), by Satellite Mass 2025 & 2033
- Figure 15: South America GEO Satellite Market Revenue Share (%), by Satellite Mass 2025 & 2033
- Figure 16: South America GEO Satellite Market Revenue (billion), by End User 2025 & 2033
- Figure 17: South America GEO Satellite Market Revenue Share (%), by End User 2025 & 2033
- Figure 18: South America GEO Satellite Market Revenue (billion), by Propulsion Tech 2025 & 2033
- Figure 19: South America GEO Satellite Market Revenue Share (%), by Propulsion Tech 2025 & 2033
- Figure 20: South America GEO Satellite Market Revenue (billion), by Country 2025 & 2033
- Figure 21: South America GEO Satellite Market Revenue Share (%), by Country 2025 & 2033
- Figure 22: Europe GEO Satellite Market Revenue (billion), by Application 2025 & 2033
- Figure 23: Europe GEO Satellite Market Revenue Share (%), by Application 2025 & 2033
- Figure 24: Europe GEO Satellite Market Revenue (billion), by Satellite Mass 2025 & 2033
- Figure 25: Europe GEO Satellite Market Revenue Share (%), by Satellite Mass 2025 & 2033
- Figure 26: Europe GEO Satellite Market Revenue (billion), by End User 2025 & 2033
- Figure 27: Europe GEO Satellite Market Revenue Share (%), by End User 2025 & 2033
- Figure 28: Europe GEO Satellite Market Revenue (billion), by Propulsion Tech 2025 & 2033
- Figure 29: Europe GEO Satellite Market Revenue Share (%), by Propulsion Tech 2025 & 2033
- Figure 30: Europe GEO Satellite Market Revenue (billion), by Country 2025 & 2033
- Figure 31: Europe GEO Satellite Market Revenue Share (%), by Country 2025 & 2033
- Figure 32: Middle East & Africa GEO Satellite Market Revenue (billion), by Application 2025 & 2033
- Figure 33: Middle East & Africa GEO Satellite Market Revenue Share (%), by Application 2025 & 2033
- Figure 34: Middle East & Africa GEO Satellite Market Revenue (billion), by Satellite Mass 2025 & 2033
- Figure 35: Middle East & Africa GEO Satellite Market Revenue Share (%), by Satellite Mass 2025 & 2033
- Figure 36: Middle East & Africa GEO Satellite Market Revenue (billion), by End User 2025 & 2033
- Figure 37: Middle East & Africa GEO Satellite Market Revenue Share (%), by End User 2025 & 2033
- Figure 38: Middle East & Africa GEO Satellite Market Revenue (billion), by Propulsion Tech 2025 & 2033
- Figure 39: Middle East & Africa GEO Satellite Market Revenue Share (%), by Propulsion Tech 2025 & 2033
- Figure 40: Middle East & Africa GEO Satellite Market Revenue (billion), by Country 2025 & 2033
- Figure 41: Middle East & Africa GEO Satellite Market Revenue Share (%), by Country 2025 & 2033
- Figure 42: Asia Pacific GEO Satellite Market Revenue (billion), by Application 2025 & 2033
- Figure 43: Asia Pacific GEO Satellite Market Revenue Share (%), by Application 2025 & 2033
- Figure 44: Asia Pacific GEO Satellite Market Revenue (billion), by Satellite Mass 2025 & 2033
- Figure 45: Asia Pacific GEO Satellite Market Revenue Share (%), by Satellite Mass 2025 & 2033
- Figure 46: Asia Pacific GEO Satellite Market Revenue (billion), by End User 2025 & 2033
- Figure 47: Asia Pacific GEO Satellite Market Revenue Share (%), by End User 2025 & 2033
- Figure 48: Asia Pacific GEO Satellite Market Revenue (billion), by Propulsion Tech 2025 & 2033
- Figure 49: Asia Pacific GEO Satellite Market Revenue Share (%), by Propulsion Tech 2025 & 2033
- Figure 50: Asia Pacific GEO Satellite Market Revenue (billion), by Country 2025 & 2033
- Figure 51: Asia Pacific GEO Satellite Market Revenue Share (%), by Country 2025 & 2033
List of Tables
- Table 1: Global GEO Satellite Market Revenue billion Forecast, by Application 2020 & 2033
- Table 2: Global GEO Satellite Market Revenue billion Forecast, by Satellite Mass 2020 & 2033
- Table 3: Global GEO Satellite Market Revenue billion Forecast, by End User 2020 & 2033
- Table 4: Global GEO Satellite Market Revenue billion Forecast, by Propulsion Tech 2020 & 2033
- Table 5: Global GEO Satellite Market Revenue billion Forecast, by Region 2020 & 2033
- Table 6: Global GEO Satellite Market Revenue billion Forecast, by Application 2020 & 2033
- Table 7: Global GEO Satellite Market Revenue billion Forecast, by Satellite Mass 2020 & 2033
- Table 8: Global GEO Satellite Market Revenue billion Forecast, by End User 2020 & 2033
- Table 9: Global GEO Satellite Market Revenue billion Forecast, by Propulsion Tech 2020 & 2033
- Table 10: Global GEO Satellite Market Revenue billion Forecast, by Country 2020 & 2033
- Table 11: United States GEO Satellite Market Revenue (billion) Forecast, by Application 2020 & 2033
- Table 12: Canada GEO Satellite Market Revenue (billion) Forecast, by Application 2020 & 2033
- Table 13: Mexico GEO Satellite Market Revenue (billion) Forecast, by Application 2020 & 2033
- Table 14: Global GEO Satellite Market Revenue billion Forecast, by Application 2020 & 2033
- Table 15: Global GEO Satellite Market Revenue billion Forecast, by Satellite Mass 2020 & 2033
- Table 16: Global GEO Satellite Market Revenue billion Forecast, by End User 2020 & 2033
- Table 17: Global GEO Satellite Market Revenue billion Forecast, by Propulsion Tech 2020 & 2033
- Table 18: Global GEO Satellite Market Revenue billion Forecast, by Country 2020 & 2033
- Table 19: Brazil GEO Satellite Market Revenue (billion) Forecast, by Application 2020 & 2033
- Table 20: Argentina GEO Satellite Market Revenue (billion) Forecast, by Application 2020 & 2033
- Table 21: Rest of South America GEO Satellite Market Revenue (billion) Forecast, by Application 2020 & 2033
- Table 22: Global GEO Satellite Market Revenue billion Forecast, by Application 2020 & 2033
- Table 23: Global GEO Satellite Market Revenue billion Forecast, by Satellite Mass 2020 & 2033
- Table 24: Global GEO Satellite Market Revenue billion Forecast, by End User 2020 & 2033
- Table 25: Global GEO Satellite Market Revenue billion Forecast, by Propulsion Tech 2020 & 2033
- Table 26: Global GEO Satellite Market Revenue billion Forecast, by Country 2020 & 2033
- Table 27: United Kingdom GEO Satellite Market Revenue (billion) Forecast, by Application 2020 & 2033
- Table 28: Germany GEO Satellite Market Revenue (billion) Forecast, by Application 2020 & 2033
- Table 29: France GEO Satellite Market Revenue (billion) Forecast, by Application 2020 & 2033
- Table 30: Italy GEO Satellite Market Revenue (billion) Forecast, by Application 2020 & 2033
- Table 31: Spain GEO Satellite Market Revenue (billion) Forecast, by Application 2020 & 2033
- Table 32: Russia GEO Satellite Market Revenue (billion) Forecast, by Application 2020 & 2033
- Table 33: Benelux GEO Satellite Market Revenue (billion) Forecast, by Application 2020 & 2033
- Table 34: Nordics GEO Satellite Market Revenue (billion) Forecast, by Application 2020 & 2033
- Table 35: Rest of Europe GEO Satellite Market Revenue (billion) Forecast, by Application 2020 & 2033
- Table 36: Global GEO Satellite Market Revenue billion Forecast, by Application 2020 & 2033
- Table 37: Global GEO Satellite Market Revenue billion Forecast, by Satellite Mass 2020 & 2033
- Table 38: Global GEO Satellite Market Revenue billion Forecast, by End User 2020 & 2033
- Table 39: Global GEO Satellite Market Revenue billion Forecast, by Propulsion Tech 2020 & 2033
- Table 40: Global GEO Satellite Market Revenue billion Forecast, by Country 2020 & 2033
- Table 41: Turkey GEO Satellite Market Revenue (billion) Forecast, by Application 2020 & 2033
- Table 42: Israel GEO Satellite Market Revenue (billion) Forecast, by Application 2020 & 2033
- Table 43: GCC GEO Satellite Market Revenue (billion) Forecast, by Application 2020 & 2033
- Table 44: North Africa GEO Satellite Market Revenue (billion) Forecast, by Application 2020 & 2033
- Table 45: South Africa GEO Satellite Market Revenue (billion) Forecast, by Application 2020 & 2033
- Table 46: Rest of Middle East & Africa GEO Satellite Market Revenue (billion) Forecast, by Application 2020 & 2033
- Table 47: Global GEO Satellite Market Revenue billion Forecast, by Application 2020 & 2033
- Table 48: Global GEO Satellite Market Revenue billion Forecast, by Satellite Mass 2020 & 2033
- Table 49: Global GEO Satellite Market Revenue billion Forecast, by End User 2020 & 2033
- Table 50: Global GEO Satellite Market Revenue billion Forecast, by Propulsion Tech 2020 & 2033
- Table 51: Global GEO Satellite Market Revenue billion Forecast, by Country 2020 & 2033
- Table 52: China GEO Satellite Market Revenue (billion) Forecast, by Application 2020 & 2033
- Table 53: India GEO Satellite Market Revenue (billion) Forecast, by Application 2020 & 2033
- Table 54: Japan GEO Satellite Market Revenue (billion) Forecast, by Application 2020 & 2033
- Table 55: South Korea GEO Satellite Market Revenue (billion) Forecast, by Application 2020 & 2033
- Table 56: ASEAN GEO Satellite Market Revenue (billion) Forecast, by Application 2020 & 2033
- Table 57: Oceania GEO Satellite Market Revenue (billion) Forecast, by Application 2020 & 2033
- Table 58: Rest of Asia Pacific GEO Satellite Market Revenue (billion) Forecast, by Application 2020 & 2033
Frequently Asked Questions
1. What is the projected Compound Annual Growth Rate (CAGR) of the GEO Satellite Market?
The projected CAGR is approximately 18.1%.
2. Which companies are prominent players in the GEO Satellite Market?
Key companies in the market include Mitsubishi Heavy Industries, Lockheed Martin Corporation, Airbus SE, Japan Aerospace Exploration Agency (JAXA), The Boeing Compan, China Aerospace Science and Technology Corporation (CASC), Thales, Maxar Technologies Inc, Northrop Grumman Corporation, Indian Space Research Organisation (ISRO).
3. What are the main segments of the GEO Satellite Market?
The market segments include Application, Satellite Mass, End User, Propulsion Tech.
4. Can you provide details about the market size?
The market size is estimated to be USD 14.56 billion as of 2022.
5. What are some drivers contributing to market growth?
N/A
6. What are the notable trends driving market growth?
Liquid fuel propulsion is expected to surge during the forecast period.
7. Are there any restraints impacting market growth?
N/A
8. Can you provide examples of recent developments in the market?
February 2023: China sent the Zhongxing-26 communications satellite into orbit,it is expected to be a military satelliteJanuary 2023: Airbus was awarded to build a geostationary telecommunications satellite by Inmarsat. The Airbus-built Inmarsat-6 telecommunications satellite (I-6 F2) has brought on board an Airbus Beluga at the Kennedy Space Center in Florida ready for its launch in February 2023.December 2022: Airbus has successfully achieved the System Critical Design Review on the EGNOS V3 (European Geostationary Navigation Overlay Service) satellite-based augmentation system. The new V3 generation of EGNOS being developed by Airbus will introduce new services based on multiple frequencies of multiple constellations (GPS, Galileo), and will embed sophisticated security protection against cyber-attacks.
9. What pricing options are available for accessing the report?
Pricing options include single-user, multi-user, and enterprise licenses priced at USD 3800, USD 4500, and USD 5800 respectively.
10. Is the market size provided in terms of value or volume?
The market size is provided in terms of value, measured in billion.
11. Are there any specific market keywords associated with the report?
Yes, the market keyword associated with the report is "GEO Satellite Market," which aids in identifying and referencing the specific market segment covered.
12. How do I determine which pricing option suits my needs best?
The pricing options vary based on user requirements and access needs. Individual users may opt for single-user licenses, while businesses requiring broader access may choose multi-user or enterprise licenses for cost-effective access to the report.
13. Are there any additional resources or data provided in the GEO Satellite Market report?
While the report offers comprehensive insights, it's advisable to review the specific contents or supplementary materials provided to ascertain if additional resources or data are available.
14. How can I stay updated on further developments or reports in the GEO Satellite Market?
To stay informed about further developments, trends, and reports in the GEO Satellite Market, consider subscribing to industry newsletters, following relevant companies and organizations, or regularly checking reputable industry news sources and publications.
Methodology
Step 1 - Identification of Relevant Samples Size from Population Database


Step 2 - Approaches for Defining Global Market Size (Value, Volume* & Price*)

Note*: In applicable scenarios
Step 3 - Data Sources
Primary Research
- Web Analytics
- Survey Reports
- Research Institute
- Latest Research Reports
- Opinion Leaders
Secondary Research
- Annual Reports
- White Paper
- Latest Press Release
- Industry Association
- Paid Database
- Investor Presentations

Step 4 - Data Triangulation
Involves using different sources of information in order to increase the validity of a study
These sources are likely to be stakeholders in a program - participants, other researchers, program staff, other community members, and so on.
Then we put all data in single framework & apply various statistical tools to find out the dynamic on the market.
During the analysis stage, feedback from the stakeholder groups would be compared to determine areas of agreement as well as areas of divergence