

Key Insights
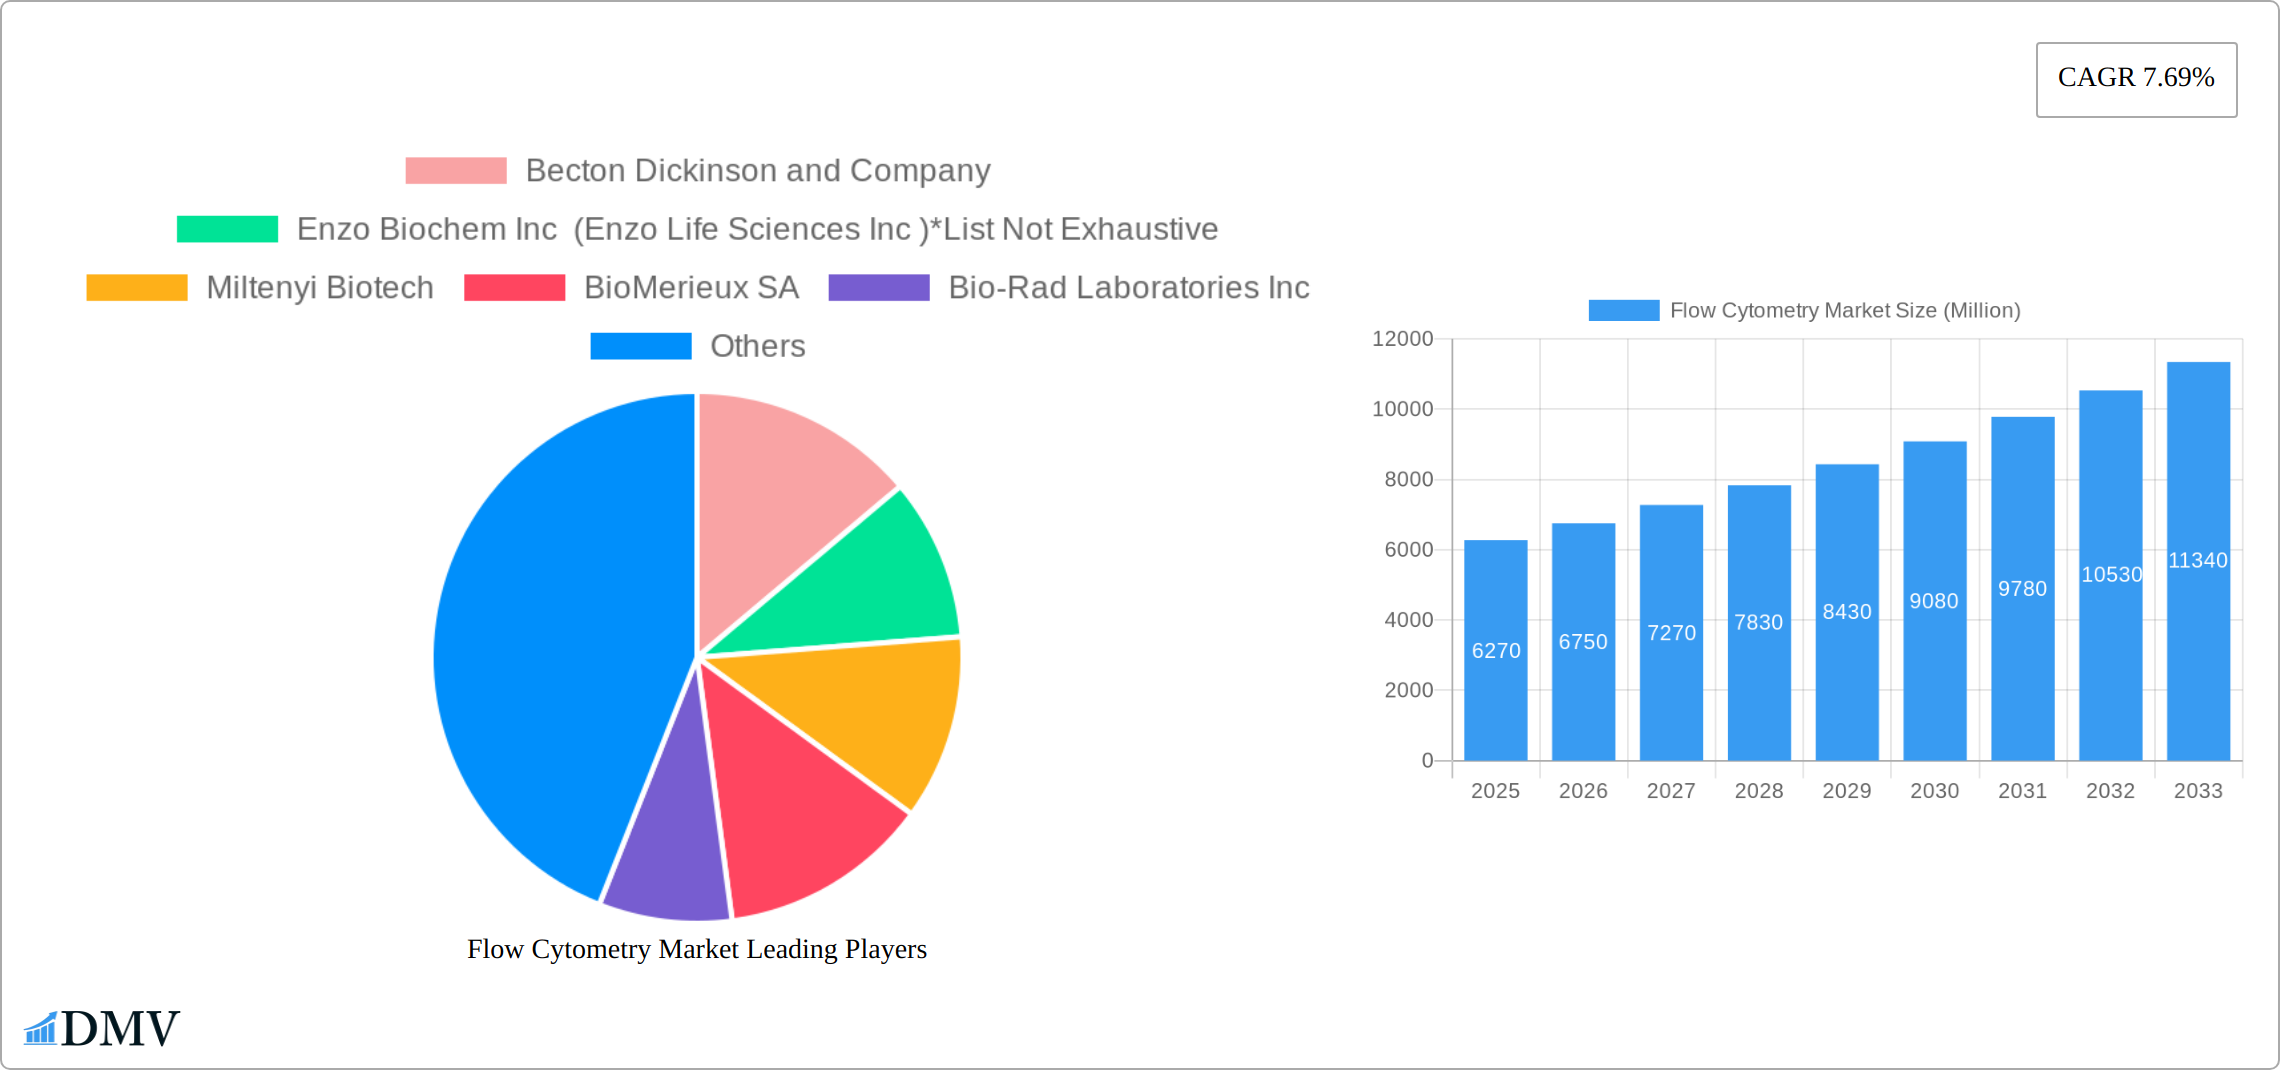
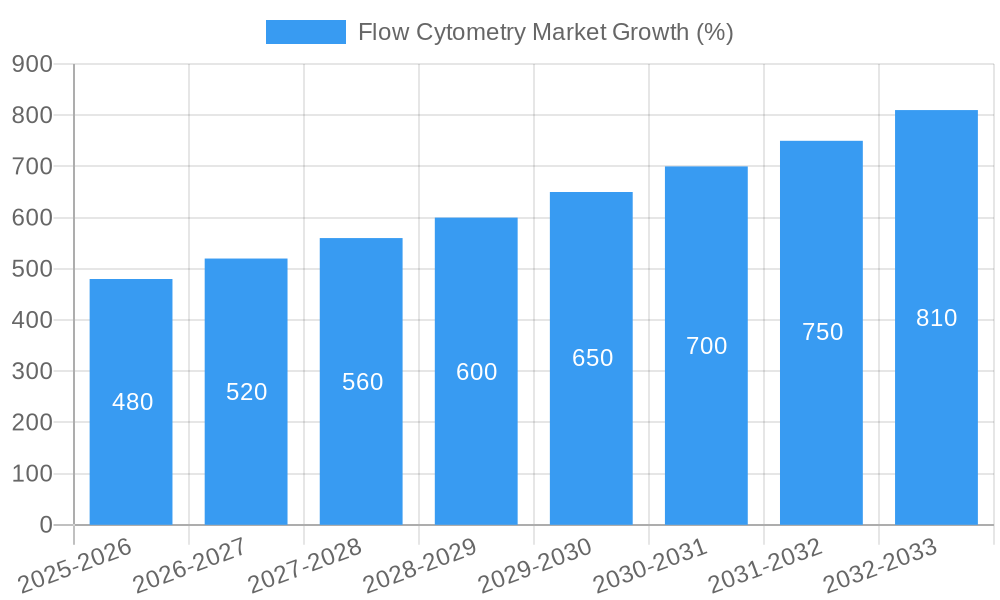
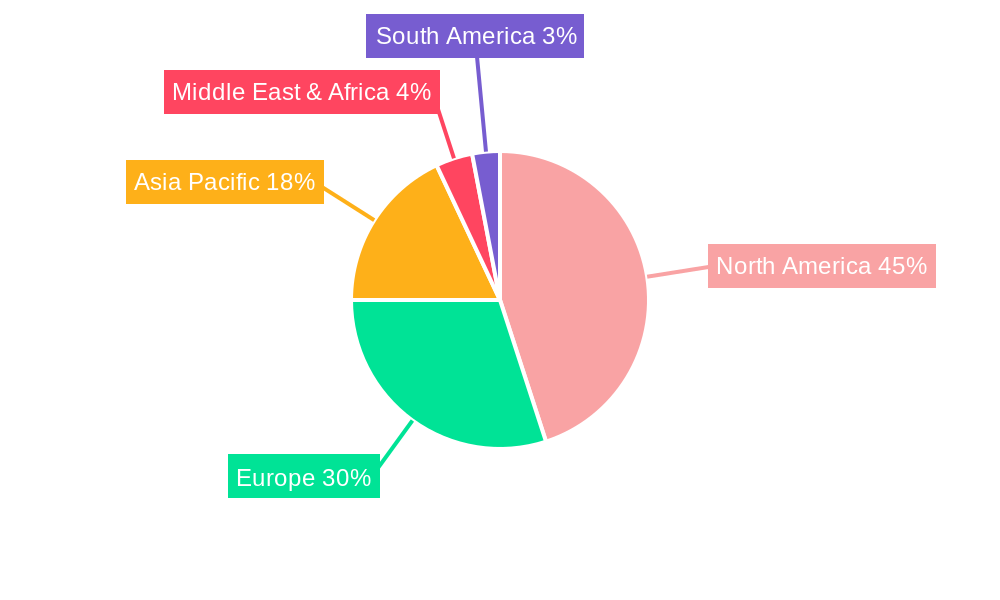
The global flow cytometry market, valued at $6.27 billion in 2025, is projected to experience robust growth, exhibiting a Compound Annual Growth Rate (CAGR) of 7.69% from 2025 to 2033. This expansion is fueled by several key drivers. The increasing prevalence of chronic diseases like cancer and autoimmune disorders necessitates advanced diagnostic tools, significantly boosting demand for flow cytometry. Furthermore, advancements in technology, such as the development of high-throughput systems and sophisticated software for data analysis, are enhancing the efficiency and capabilities of flow cytometry, attracting wider adoption across research and clinical settings. The rising investment in research and development within the pharmaceutical and biotechnology sectors, coupled with the increasing focus on personalized medicine and targeted therapies, is further propelling market growth. While the high cost of instruments and reagents can present a restraint, the long-term benefits in terms of improved diagnostics and treatment outcomes are outweighing this factor for many users. The market is segmented by end-user (hospitals & clinics, academia, pharma/biotech, others), product type (instruments, kits & reagents, software & services), technology (cell-based, bead-based), and application (oncology, drug discovery, stem cell therapy, etc.). North America currently holds a significant market share due to established healthcare infrastructure and high technological adoption. However, the Asia-Pacific region is anticipated to witness substantial growth in the coming years driven by rising healthcare expenditure and increasing awareness of advanced diagnostic techniques.
The competitive landscape is characterized by the presence of both established players like Becton Dickinson, Thermo Fisher Scientific, and Danaher Corporation (Beckman Coulter), and specialized companies such as Miltenyi Biotec and Bio-Rad Laboratories. These companies are engaged in strategic initiatives including product innovation, acquisitions, and partnerships to maintain their market positions and capitalize on the growing market opportunities. Future growth will depend on continued technological advancements, expansion into emerging markets, and the development of user-friendly, cost-effective solutions to broaden accessibility. The integration of artificial intelligence and machine learning in flow cytometry data analysis is expected to further revolutionize the field, leading to more accurate and efficient diagnostics. The development of novel applications, such as in immunology and infectious disease research, will also contribute to continued market expansion over the forecast period.
Flow Cytometry Market: A Comprehensive Report (2019-2033)
This insightful report provides a detailed analysis of the Flow Cytometry Market, offering a comprehensive overview of its current state, future trajectory, and key players. The study period spans from 2019 to 2033, with 2025 serving as the base and estimated year. The forecast period covers 2025-2033, and the historical period encompasses 2019-2024. The global market is projected to reach xx Million by 2033, exhibiting a CAGR of xx% during the forecast period. This report is essential for stakeholders seeking to understand the market's dynamics and capitalize on emerging opportunities.
Flow Cytometry Market Composition & Trends
The Flow Cytometry market is characterized by a moderately concentrated landscape, with key players like Becton Dickinson and Company, BD, ThermoFisher Scientific Inc, and Danaher Corporation (Beckman Coulter Inc) holding significant market share. The market share distribution is dynamic, with ongoing mergers and acquisitions (M&A) reshaping the competitive dynamics. Recent M&A activities, totaling an estimated xx Million in deal value in the past three years, have focused on expanding product portfolios and geographical reach. Innovation is a crucial driver, with companies continuously developing advanced instruments, reagents, and software solutions to enhance the capabilities and applications of flow cytometry. The regulatory landscape varies across regions, impacting market access and adoption. Substitute technologies exist, but flow cytometry's versatility and accuracy maintain its dominant position. End-users, primarily hospitals and clinics, academia and research institutes, and pharmaceutical and biotechnology companies, drive market demand.
- Market Concentration: Moderately concentrated, with top players holding xx% market share.
- Innovation Catalysts: Development of cloud-based data analysis platforms, advanced instrumentation, and novel reagents.
- Regulatory Landscape: Varied across regions, influencing market access and adoption rates.
- Substitute Products: Limited direct substitutes; existing alternatives lack the versatility and accuracy of flow cytometry.
- End-User Profiles: Hospitals and clinics, academia, pharmaceutical and biotech companies, and other end-users constitute the primary market.
- M&A Activities: Significant M&A activity in recent years, focused on expanding portfolios and geographical reach; total deal value approximately xx Million in the last three years.
Flow Cytometry Market Industry Evolution
The Flow Cytometry market has demonstrated remarkable and consistent growth over the past five years, primarily propelled by groundbreaking technological advancements and the expanding utility of flow cytometry techniques across a diverse spectrum of scientific and clinical disciplines. This upward trajectory is poised for continued acceleration, significantly influenced by the increasing incidence of diseases that necessitate highly precise cellular analysis, the escalating demand for tailored personalized medicine approaches, and the robust expansion of fundamental and applied research endeavors. Key technological innovations, encompassing the development of high-throughput analytical instruments, sophisticated software solutions for data interpretation, and novel, highly specific reagents, have profoundly amplified the efficiency, sensitivity, and overall capabilities of flow cytometry. Concurrently, a discernible shift in consumer demand is evident, with a growing preference for more intuitive, automated systems and the adoption of cloud-based data analysis platforms. This trend is further amplified by the imperative for expedited turnaround times in diagnostics and research, coupled with enhanced data management and security capabilities. The market experienced a substantial growth rate of approximately [Insert Current Percentage]% between 2019 and 2024, and is projected to expand at a Compound Annual Growth Rate (CAGR) of approximately [Insert Projected Percentage]% from 2025 to 2033. The increasing adoption of advanced flow cytometry technologies in emerging economies is also acting as a significant catalyst for market expansion, with an observed increase in adoption rates of approximately [Insert Adoption Percentage]% in the Asia-Pacific region since 2019.
Leading Regions, Countries, or Segments in Flow Cytometry Market
North America currently commands the largest share of the flow cytometry market, a position bolstered by substantial investments in research and development, the established presence of leading global players, and a highly developed and sophisticated healthcare infrastructure. However, the Asia-Pacific region is exhibiting the most dynamic growth, driven by escalating healthcare expenditures, a rising burden of chronic diseases, and an increasing focus on scientific research and technological adoption.
By End-User:
- Hospitals and Clinics: This segment represents the largest market share due to the extensive volume of diagnostic testing, patient monitoring, and therapeutic assessment conducted within these settings. Key drivers include increasing healthcare spending, a growing global population, and the rising prevalence of both infectious and chronic diseases requiring detailed cellular profiling.
- Academia and Research Institutes: A critical and consistent contributor to market growth, fueled by extensive basic and applied research activities and a dedicated focus on exploring novel applications and refining existing techniques. Major drivers include robust government funding for scientific research, private grants, and the continuous pursuit of scientific discovery.
- Pharmaceutical and Biotechnology Companies: This segment is experiencing robust expansion, directly linked to the indispensable role of flow cytometry in modern drug discovery, preclinical research, and the optimization of biopharmaceutical development. Key drivers include the growing pharmaceutical R&D pipelines, the increasing complexity of clinical trials, and the demand for high-throughput screening capabilities.
By Product Type:
- Instruments: This remains the dominant segment, representing the foundational technology of the flow cytometry market. Key drivers for its continued growth include ongoing technological innovation leading to higher sensitivity and specificity, the demand for increased throughput to handle larger sample volumes, and the development of more compact and user-friendly benchtop instruments.
- Kits and Reagents: A vital and significant segment, essential for the execution of a wide array of flow cytometry assays. Growth in this area is propelled by the continuous development of novel antibodies, fluorescent dyes, and specialized assay kits designed for specific applications, including multiplexing and the detection of rare cell populations.
- Software and Services: This segment is experiencing rapid expansion, reflecting the escalating demand for advanced data analysis capabilities, sophisticated workflow management, and comprehensive technical support. Key drivers include the rise of cloud-based data analysis platforms, the integration of AI and machine learning for interpretation, and the increasing need for remote diagnostics and system maintenance.
By Technology:
- Cell-based Flow Cytometry: This represents the well-established and dominant technology, forming the cornerstone of traditional flow cytometry applications.
- Bead-based Flow Cytometry: This segment is witnessing significant growth, offering distinct advantages for specific applications such as high-throughput screening, immunoassay development, and the detection of soluble analytes.
By Application:
- Oncology: This remains the largest and most critical application driving substantial demand for flow cytometry systems. Key drivers include the unparalleled precision of flow cytometry in identifying and characterizing cancer cells, monitoring treatment efficacy, and enabling personalized therapeutic strategies.
- Drug Discovery and Development: A significant and growing segment, where flow cytometry plays a crucial role in efficient compound screening, target validation, and the assessment of drug effects at the cellular level, contributing to faster and more effective drug development cycles.
- Stem Cell Therapy and Regenerative Medicine: This is a rapidly expanding application area, driven by significant advancements in regenerative medicine and cell-based therapies. Flow cytometry is indispensable for the precise characterization, quality control, and research applications involving stem cells and other therapeutic cell populations.
Flow Cytometry Market Product Innovations
Recent innovations have significantly transformed the flow cytometry landscape. The introduction of advanced cloud-based software solutions, such as Sony Corporation's SFA-Life Sciences Cloud Platform and BD Research Cloud from Becton, Dickinson and Company, is revolutionizing data management, analysis, and collaborative research efforts. These platforms empower researchers with streamlined workflows, enhanced data accessibility, and improved interdisciplinary collaboration. Concurrently, cutting-edge instrumentation features are pushing the boundaries of what's possible, offering higher throughput capabilities, unprecedented sensitivity for detecting even rare cellular events, and increasingly sophisticated automated functions that reduce manual labor and potential errors. Furthermore, the development of novel reagents and kits is enabling greater specificity and enhanced performance across a wider array of applications, including advanced multiplexing techniques for simultaneous analysis of multiple cellular markers and highly sensitive methods for detecting rare cell populations in complex biological samples. These advancements collectively provide researchers with unique selling propositions, allowing for the analysis of larger sample volumes, the execution of more complex and intricate experiments, and the attainment of more accurate and reliable results in significantly reduced timeframes.
Propelling Factors for Flow Cytometry Market Growth
Technological advancements, such as the development of high-throughput instruments and sophisticated software, significantly enhance the speed and efficiency of analysis. The growing prevalence of chronic diseases and the expanding need for personalized medicine fuels demand for precise cell analysis. Increased research funding in fields like oncology, immunology, and stem cell therapy drives market expansion. Favorable regulatory environments in some regions promote the wider adoption of flow cytometry technologies.
Obstacles in the Flow Cytometry Market
High initial investment costs for advanced instruments and related software can act as a barrier for some potential users. Supply chain disruptions can affect the availability of reagents and consumables, impacting research and diagnostic workflows. Intense competition among major players leads to price pressures and affects profitability. Complex regulatory approval processes and varying regulatory landscapes across regions can create challenges for market entry and expansion. The skilled labor needed to operate and interpret the results of flow cytometry is a significant resource constraint.
Future Opportunities in Flow Cytometry Market
The integration of cutting-edge artificial intelligence (AI) and machine learning (ML) algorithms into the data analysis pipeline of flow cytometry promises to unlock unprecedented levels of accuracy, efficiency, and predictive power. This synergy will enable deeper insights from complex datasets. The strategic expansion into new and emerging markets, particularly in developing economies with growing healthcare infrastructures and research capabilities, presents a substantial opportunity for widespread adoption and market growth. The continuous exploration and development of novel applications in rapidly evolving fields such as advanced immunotherapy, personalized cancer vaccines, and emerging infectious disease research will further stimulate demand for sophisticated flow cytometry solutions. Moreover, the advancement and commercialization of point-of-care (POC) flow cytometry systems hold immense potential to democratize access to advanced cellular analysis, enabling faster, more localized diagnostics and empowering healthcare professionals in diverse clinical settings.
Major Players in the Flow Cytometry Market Ecosystem
- Becton Dickinson and Company (BD)
- Enzo Biochem Inc (Enzo Life Sciences Inc)
- Miltenyi Biotech
- BioMerieux SA
- Bio-Rad Laboratories Inc
- Stratedigm Inc
- Sony Biotechnology Inc (Sony Corporation of America)
- Agilent Technologies Inc
- Sysmex Corporation
- Danaher corporation (Beckman Coulter Inc)
- Luminex Corporation
- ThermoFisher Scientific Inc
Key Developments in Flow Cytometry Market Industry
- September 2022: Becton, Dickinson, and Company released BD Research Cloud, a cloud-based software solution streamlining flow cytometry workflows.
- November 2022: Sony Corporation released SFA-Life Sciences Cloud Platform, a cloud-based solution for analyzing flow cytometry data, facilitating rare cell detection.
Strategic Flow Cytometry Market Forecast
The Flow Cytometry market is poised for significant growth in the coming years, driven by continuous technological advancements, increasing applications across diverse fields, and rising healthcare expenditure globally. Emerging opportunities, such as AI-driven data analysis and expansion into new markets, will further fuel market expansion. The market is expected to witness substantial growth, with continued demand from research, diagnostics, and therapeutics applications across the globe. The strategic adoption of innovative solutions and strategic partnerships will be key for companies to successfully navigate this dynamic market.
Flow Cytometry Market Segmentation
-
1. Product Type
- 1.1. Instrument
- 1.2. Kit and Reagent
- 1.3. Software and Services
-
2. Technology
- 2.1. Cell-based Flow Cytometry
- 2.2. Bead-based Flow Cytometry
-
3. Application
- 3.1. Oncology
- 3.2. Drug Discovery
- 3.3. Stem Cell Therapy
- 3.4. Organ Transplantation
- 3.5. Hematology
- 3.6. Other Applications
-
4. End-User
- 4.1. Hospitals and Clinics
- 4.2. Academia and Research Institutes
- 4.3. Pharmaceutical and Biotechnology Companies
- 4.4. Other End-Users
Flow Cytometry Market Segmentation By Geography
-
1. North America
- 1.1. United States
- 1.2. Canada
- 1.3. Mexico
-
2. Europe
- 2.1. Germany
- 2.2. United Kingdom
- 2.3. France
- 2.4. Italy
- 2.5. Spain
- 2.6. Rest of Europe
-
3. Asia Pacific
- 3.1. China
- 3.2. Japan
- 3.3. India
- 3.4. Australia
- 3.5. South Korea
- 3.6. Rest of Asia Pacific
-
4. Middle East and Africa
- 4.1. GCC
- 4.2. South Africa
- 4.3. Rest of Middle East and Africa
-
5. South America
- 5.1. Brazil
- 5.2. Argentina
- 5.3. Rest of South America
Flow Cytometry Market REPORT HIGHLIGHTS
| Aspects | Details |
|---|---|
| Study Period | 2019-2033 |
| Base Year | 2024 |
| Estimated Year | 2025 |
| Forecast Period | 2025-2033 |
| Historical Period | 2019-2024 |
| Growth Rate | CAGR of 7.69% from 2019-2033 |
| Segmentation |
|
Table of Contents
- 1. Introduction
- 1.1. Research Scope
- 1.2. Market Segmentation
- 1.3. Research Methodology
- 1.4. Definitions and Assumptions
- 2. Executive Summary
- 2.1. Introduction
- 3. Market Dynamics
- 3.1. Introduction
- 3.2. Market Drivers
- 3.2.1. Growing Adoption of Flow Cytometry in Stem Cell Research; Increasing Applications of Flow Cytometry in Clinical Research
- 3.3. Market Restrains
- 3.3.1. Lack of Awareness about the Potential Benefits of Flow Cytometry Techniques; High Cost of the Equipment
- 3.4. Market Trends
- 3.4.1. Stem Cell Therapy Segment is Expected to Witness a Significant Growth Over the Forecast Period.
- 4. Market Factor Analysis
- 4.1. Porters Five Forces
- 4.2. Supply/Value Chain
- 4.3. PESTEL analysis
- 4.4. Market Entropy
- 4.5. Patent/Trademark Analysis
- 5. Global Flow Cytometry Market Analysis, Insights and Forecast, 2019-2031
- 5.1. Market Analysis, Insights and Forecast - by Product Type
- 5.1.1. Instrument
- 5.1.2. Kit and Reagent
- 5.1.3. Software and Services
- 5.2. Market Analysis, Insights and Forecast - by Technology
- 5.2.1. Cell-based Flow Cytometry
- 5.2.2. Bead-based Flow Cytometry
- 5.3. Market Analysis, Insights and Forecast - by Application
- 5.3.1. Oncology
- 5.3.2. Drug Discovery
- 5.3.3. Stem Cell Therapy
- 5.3.4. Organ Transplantation
- 5.3.5. Hematology
- 5.3.6. Other Applications
- 5.4. Market Analysis, Insights and Forecast - by End-User
- 5.4.1. Hospitals and Clinics
- 5.4.2. Academia and Research Institutes
- 5.4.3. Pharmaceutical and Biotechnology Companies
- 5.4.4. Other End-Users
- 5.5. Market Analysis, Insights and Forecast - by Region
- 5.5.1. North America
- 5.5.2. Europe
- 5.5.3. Asia Pacific
- 5.5.4. Middle East and Africa
- 5.5.5. South America
- 5.1. Market Analysis, Insights and Forecast - by Product Type
- 6. North America Flow Cytometry Market Analysis, Insights and Forecast, 2019-2031
- 6.1. Market Analysis, Insights and Forecast - by Product Type
- 6.1.1. Instrument
- 6.1.2. Kit and Reagent
- 6.1.3. Software and Services
- 6.2. Market Analysis, Insights and Forecast - by Technology
- 6.2.1. Cell-based Flow Cytometry
- 6.2.2. Bead-based Flow Cytometry
- 6.3. Market Analysis, Insights and Forecast - by Application
- 6.3.1. Oncology
- 6.3.2. Drug Discovery
- 6.3.3. Stem Cell Therapy
- 6.3.4. Organ Transplantation
- 6.3.5. Hematology
- 6.3.6. Other Applications
- 6.4. Market Analysis, Insights and Forecast - by End-User
- 6.4.1. Hospitals and Clinics
- 6.4.2. Academia and Research Institutes
- 6.4.3. Pharmaceutical and Biotechnology Companies
- 6.4.4. Other End-Users
- 6.1. Market Analysis, Insights and Forecast - by Product Type
- 7. Europe Flow Cytometry Market Analysis, Insights and Forecast, 2019-2031
- 7.1. Market Analysis, Insights and Forecast - by Product Type
- 7.1.1. Instrument
- 7.1.2. Kit and Reagent
- 7.1.3. Software and Services
- 7.2. Market Analysis, Insights and Forecast - by Technology
- 7.2.1. Cell-based Flow Cytometry
- 7.2.2. Bead-based Flow Cytometry
- 7.3. Market Analysis, Insights and Forecast - by Application
- 7.3.1. Oncology
- 7.3.2. Drug Discovery
- 7.3.3. Stem Cell Therapy
- 7.3.4. Organ Transplantation
- 7.3.5. Hematology
- 7.3.6. Other Applications
- 7.4. Market Analysis, Insights and Forecast - by End-User
- 7.4.1. Hospitals and Clinics
- 7.4.2. Academia and Research Institutes
- 7.4.3. Pharmaceutical and Biotechnology Companies
- 7.4.4. Other End-Users
- 7.1. Market Analysis, Insights and Forecast - by Product Type
- 8. Asia Pacific Flow Cytometry Market Analysis, Insights and Forecast, 2019-2031
- 8.1. Market Analysis, Insights and Forecast - by Product Type
- 8.1.1. Instrument
- 8.1.2. Kit and Reagent
- 8.1.3. Software and Services
- 8.2. Market Analysis, Insights and Forecast - by Technology
- 8.2.1. Cell-based Flow Cytometry
- 8.2.2. Bead-based Flow Cytometry
- 8.3. Market Analysis, Insights and Forecast - by Application
- 8.3.1. Oncology
- 8.3.2. Drug Discovery
- 8.3.3. Stem Cell Therapy
- 8.3.4. Organ Transplantation
- 8.3.5. Hematology
- 8.3.6. Other Applications
- 8.4. Market Analysis, Insights and Forecast - by End-User
- 8.4.1. Hospitals and Clinics
- 8.4.2. Academia and Research Institutes
- 8.4.3. Pharmaceutical and Biotechnology Companies
- 8.4.4. Other End-Users
- 8.1. Market Analysis, Insights and Forecast - by Product Type
- 9. Middle East and Africa Flow Cytometry Market Analysis, Insights and Forecast, 2019-2031
- 9.1. Market Analysis, Insights and Forecast - by Product Type
- 9.1.1. Instrument
- 9.1.2. Kit and Reagent
- 9.1.3. Software and Services
- 9.2. Market Analysis, Insights and Forecast - by Technology
- 9.2.1. Cell-based Flow Cytometry
- 9.2.2. Bead-based Flow Cytometry
- 9.3. Market Analysis, Insights and Forecast - by Application
- 9.3.1. Oncology
- 9.3.2. Drug Discovery
- 9.3.3. Stem Cell Therapy
- 9.3.4. Organ Transplantation
- 9.3.5. Hematology
- 9.3.6. Other Applications
- 9.4. Market Analysis, Insights and Forecast - by End-User
- 9.4.1. Hospitals and Clinics
- 9.4.2. Academia and Research Institutes
- 9.4.3. Pharmaceutical and Biotechnology Companies
- 9.4.4. Other End-Users
- 9.1. Market Analysis, Insights and Forecast - by Product Type
- 10. South America Flow Cytometry Market Analysis, Insights and Forecast, 2019-2031
- 10.1. Market Analysis, Insights and Forecast - by Product Type
- 10.1.1. Instrument
- 10.1.2. Kit and Reagent
- 10.1.3. Software and Services
- 10.2. Market Analysis, Insights and Forecast - by Technology
- 10.2.1. Cell-based Flow Cytometry
- 10.2.2. Bead-based Flow Cytometry
- 10.3. Market Analysis, Insights and Forecast - by Application
- 10.3.1. Oncology
- 10.3.2. Drug Discovery
- 10.3.3. Stem Cell Therapy
- 10.3.4. Organ Transplantation
- 10.3.5. Hematology
- 10.3.6. Other Applications
- 10.4. Market Analysis, Insights and Forecast - by End-User
- 10.4.1. Hospitals and Clinics
- 10.4.2. Academia and Research Institutes
- 10.4.3. Pharmaceutical and Biotechnology Companies
- 10.4.4. Other End-Users
- 10.1. Market Analysis, Insights and Forecast - by Product Type
- 11. North America Flow Cytometry Market Analysis, Insights and Forecast, 2019-2031
- 11.1. Market Analysis, Insights and Forecast - By Country/Sub-region
- 11.1.1 United States
- 11.1.2 Canada
- 11.1.3 Mexico
- 12. Europe Flow Cytometry Market Analysis, Insights and Forecast, 2019-2031
- 12.1. Market Analysis, Insights and Forecast - By Country/Sub-region
- 12.1.1 Germany
- 12.1.2 United Kingdom
- 12.1.3 France
- 12.1.4 Italy
- 12.1.5 Spain
- 12.1.6 Rest of Europe
- 13. Asia Pacific Flow Cytometry Market Analysis, Insights and Forecast, 2019-2031
- 13.1. Market Analysis, Insights and Forecast - By Country/Sub-region
- 13.1.1 China
- 13.1.2 Japan
- 13.1.3 India
- 13.1.4 Australia
- 13.1.5 South Korea
- 13.1.6 Rest of Asia Pacific
- 14. Middle East and Africa Flow Cytometry Market Analysis, Insights and Forecast, 2019-2031
- 14.1. Market Analysis, Insights and Forecast - By Country/Sub-region
- 14.1.1 GCC
- 14.1.2 South Africa
- 14.1.3 Rest of Middle East and Africa
- 15. South America Flow Cytometry Market Analysis, Insights and Forecast, 2019-2031
- 15.1. Market Analysis, Insights and Forecast - By Country/Sub-region
- 15.1.1 Brazil
- 15.1.2 Argentina
- 15.1.3 Rest of South America
- 16. Competitive Analysis
- 16.1. Global Market Share Analysis 2024
- 16.2. Company Profiles
- 16.2.1 Becton Dickinson and Company
- 16.2.1.1. Overview
- 16.2.1.2. Products
- 16.2.1.3. SWOT Analysis
- 16.2.1.4. Recent Developments
- 16.2.1.5. Financials (Based on Availability)
- 16.2.2 Enzo Biochem Inc (Enzo Life Sciences Inc )*List Not Exhaustive
- 16.2.2.1. Overview
- 16.2.2.2. Products
- 16.2.2.3. SWOT Analysis
- 16.2.2.4. Recent Developments
- 16.2.2.5. Financials (Based on Availability)
- 16.2.3 Miltenyi Biotech
- 16.2.3.1. Overview
- 16.2.3.2. Products
- 16.2.3.3. SWOT Analysis
- 16.2.3.4. Recent Developments
- 16.2.3.5. Financials (Based on Availability)
- 16.2.4 BioMerieux SA
- 16.2.4.1. Overview
- 16.2.4.2. Products
- 16.2.4.3. SWOT Analysis
- 16.2.4.4. Recent Developments
- 16.2.4.5. Financials (Based on Availability)
- 16.2.5 Bio-Rad Laboratories Inc
- 16.2.5.1. Overview
- 16.2.5.2. Products
- 16.2.5.3. SWOT Analysis
- 16.2.5.4. Recent Developments
- 16.2.5.5. Financials (Based on Availability)
- 16.2.6 Stratedigm Inc
- 16.2.6.1. Overview
- 16.2.6.2. Products
- 16.2.6.3. SWOT Analysis
- 16.2.6.4. Recent Developments
- 16.2.6.5. Financials (Based on Availability)
- 16.2.7 Sony Biotechnology Inc (Sony Corporation of America)
- 16.2.7.1. Overview
- 16.2.7.2. Products
- 16.2.7.3. SWOT Analysis
- 16.2.7.4. Recent Developments
- 16.2.7.5. Financials (Based on Availability)
- 16.2.8 Agilent Technologies Inc
- 16.2.8.1. Overview
- 16.2.8.2. Products
- 16.2.8.3. SWOT Analysis
- 16.2.8.4. Recent Developments
- 16.2.8.5. Financials (Based on Availability)
- 16.2.9 Sysmex Corporation
- 16.2.9.1. Overview
- 16.2.9.2. Products
- 16.2.9.3. SWOT Analysis
- 16.2.9.4. Recent Developments
- 16.2.9.5. Financials (Based on Availability)
- 16.2.10 Danaher corporation (Beckman Coulter Inc )
- 16.2.10.1. Overview
- 16.2.10.2. Products
- 16.2.10.3. SWOT Analysis
- 16.2.10.4. Recent Developments
- 16.2.10.5. Financials (Based on Availability)
- 16.2.11 Luminex Corporation
- 16.2.11.1. Overview
- 16.2.11.2. Products
- 16.2.11.3. SWOT Analysis
- 16.2.11.4. Recent Developments
- 16.2.11.5. Financials (Based on Availability)
- 16.2.12 ThermoFisher Scientific Inc
- 16.2.12.1. Overview
- 16.2.12.2. Products
- 16.2.12.3. SWOT Analysis
- 16.2.12.4. Recent Developments
- 16.2.12.5. Financials (Based on Availability)
- 16.2.1 Becton Dickinson and Company
List of Figures
- Figure 1: Global Flow Cytometry Market Revenue Breakdown (Million, %) by Region 2024 & 2032
- Figure 2: North America Flow Cytometry Market Revenue (Million), by Country 2024 & 2032
- Figure 3: North America Flow Cytometry Market Revenue Share (%), by Country 2024 & 2032
- Figure 4: Europe Flow Cytometry Market Revenue (Million), by Country 2024 & 2032
- Figure 5: Europe Flow Cytometry Market Revenue Share (%), by Country 2024 & 2032
- Figure 6: Asia Pacific Flow Cytometry Market Revenue (Million), by Country 2024 & 2032
- Figure 7: Asia Pacific Flow Cytometry Market Revenue Share (%), by Country 2024 & 2032
- Figure 8: Middle East and Africa Flow Cytometry Market Revenue (Million), by Country 2024 & 2032
- Figure 9: Middle East and Africa Flow Cytometry Market Revenue Share (%), by Country 2024 & 2032
- Figure 10: South America Flow Cytometry Market Revenue (Million), by Country 2024 & 2032
- Figure 11: South America Flow Cytometry Market Revenue Share (%), by Country 2024 & 2032
- Figure 12: North America Flow Cytometry Market Revenue (Million), by Product Type 2024 & 2032
- Figure 13: North America Flow Cytometry Market Revenue Share (%), by Product Type 2024 & 2032
- Figure 14: North America Flow Cytometry Market Revenue (Million), by Technology 2024 & 2032
- Figure 15: North America Flow Cytometry Market Revenue Share (%), by Technology 2024 & 2032
- Figure 16: North America Flow Cytometry Market Revenue (Million), by Application 2024 & 2032
- Figure 17: North America Flow Cytometry Market Revenue Share (%), by Application 2024 & 2032
- Figure 18: North America Flow Cytometry Market Revenue (Million), by End-User 2024 & 2032
- Figure 19: North America Flow Cytometry Market Revenue Share (%), by End-User 2024 & 2032
- Figure 20: North America Flow Cytometry Market Revenue (Million), by Country 2024 & 2032
- Figure 21: North America Flow Cytometry Market Revenue Share (%), by Country 2024 & 2032
- Figure 22: Europe Flow Cytometry Market Revenue (Million), by Product Type 2024 & 2032
- Figure 23: Europe Flow Cytometry Market Revenue Share (%), by Product Type 2024 & 2032
- Figure 24: Europe Flow Cytometry Market Revenue (Million), by Technology 2024 & 2032
- Figure 25: Europe Flow Cytometry Market Revenue Share (%), by Technology 2024 & 2032
- Figure 26: Europe Flow Cytometry Market Revenue (Million), by Application 2024 & 2032
- Figure 27: Europe Flow Cytometry Market Revenue Share (%), by Application 2024 & 2032
- Figure 28: Europe Flow Cytometry Market Revenue (Million), by End-User 2024 & 2032
- Figure 29: Europe Flow Cytometry Market Revenue Share (%), by End-User 2024 & 2032
- Figure 30: Europe Flow Cytometry Market Revenue (Million), by Country 2024 & 2032
- Figure 31: Europe Flow Cytometry Market Revenue Share (%), by Country 2024 & 2032
- Figure 32: Asia Pacific Flow Cytometry Market Revenue (Million), by Product Type 2024 & 2032
- Figure 33: Asia Pacific Flow Cytometry Market Revenue Share (%), by Product Type 2024 & 2032
- Figure 34: Asia Pacific Flow Cytometry Market Revenue (Million), by Technology 2024 & 2032
- Figure 35: Asia Pacific Flow Cytometry Market Revenue Share (%), by Technology 2024 & 2032
- Figure 36: Asia Pacific Flow Cytometry Market Revenue (Million), by Application 2024 & 2032
- Figure 37: Asia Pacific Flow Cytometry Market Revenue Share (%), by Application 2024 & 2032
- Figure 38: Asia Pacific Flow Cytometry Market Revenue (Million), by End-User 2024 & 2032
- Figure 39: Asia Pacific Flow Cytometry Market Revenue Share (%), by End-User 2024 & 2032
- Figure 40: Asia Pacific Flow Cytometry Market Revenue (Million), by Country 2024 & 2032
- Figure 41: Asia Pacific Flow Cytometry Market Revenue Share (%), by Country 2024 & 2032
- Figure 42: Middle East and Africa Flow Cytometry Market Revenue (Million), by Product Type 2024 & 2032
- Figure 43: Middle East and Africa Flow Cytometry Market Revenue Share (%), by Product Type 2024 & 2032
- Figure 44: Middle East and Africa Flow Cytometry Market Revenue (Million), by Technology 2024 & 2032
- Figure 45: Middle East and Africa Flow Cytometry Market Revenue Share (%), by Technology 2024 & 2032
- Figure 46: Middle East and Africa Flow Cytometry Market Revenue (Million), by Application 2024 & 2032
- Figure 47: Middle East and Africa Flow Cytometry Market Revenue Share (%), by Application 2024 & 2032
- Figure 48: Middle East and Africa Flow Cytometry Market Revenue (Million), by End-User 2024 & 2032
- Figure 49: Middle East and Africa Flow Cytometry Market Revenue Share (%), by End-User 2024 & 2032
- Figure 50: Middle East and Africa Flow Cytometry Market Revenue (Million), by Country 2024 & 2032
- Figure 51: Middle East and Africa Flow Cytometry Market Revenue Share (%), by Country 2024 & 2032
- Figure 52: South America Flow Cytometry Market Revenue (Million), by Product Type 2024 & 2032
- Figure 53: South America Flow Cytometry Market Revenue Share (%), by Product Type 2024 & 2032
- Figure 54: South America Flow Cytometry Market Revenue (Million), by Technology 2024 & 2032
- Figure 55: South America Flow Cytometry Market Revenue Share (%), by Technology 2024 & 2032
- Figure 56: South America Flow Cytometry Market Revenue (Million), by Application 2024 & 2032
- Figure 57: South America Flow Cytometry Market Revenue Share (%), by Application 2024 & 2032
- Figure 58: South America Flow Cytometry Market Revenue (Million), by End-User 2024 & 2032
- Figure 59: South America Flow Cytometry Market Revenue Share (%), by End-User 2024 & 2032
- Figure 60: South America Flow Cytometry Market Revenue (Million), by Country 2024 & 2032
- Figure 61: South America Flow Cytometry Market Revenue Share (%), by Country 2024 & 2032
List of Tables
- Table 1: Global Flow Cytometry Market Revenue Million Forecast, by Region 2019 & 2032
- Table 2: Global Flow Cytometry Market Revenue Million Forecast, by Product Type 2019 & 2032
- Table 3: Global Flow Cytometry Market Revenue Million Forecast, by Technology 2019 & 2032
- Table 4: Global Flow Cytometry Market Revenue Million Forecast, by Application 2019 & 2032
- Table 5: Global Flow Cytometry Market Revenue Million Forecast, by End-User 2019 & 2032
- Table 6: Global Flow Cytometry Market Revenue Million Forecast, by Region 2019 & 2032
- Table 7: Global Flow Cytometry Market Revenue Million Forecast, by Country 2019 & 2032
- Table 8: United States Flow Cytometry Market Revenue (Million) Forecast, by Application 2019 & 2032
- Table 9: Canada Flow Cytometry Market Revenue (Million) Forecast, by Application 2019 & 2032
- Table 10: Mexico Flow Cytometry Market Revenue (Million) Forecast, by Application 2019 & 2032
- Table 11: Global Flow Cytometry Market Revenue Million Forecast, by Country 2019 & 2032
- Table 12: Germany Flow Cytometry Market Revenue (Million) Forecast, by Application 2019 & 2032
- Table 13: United Kingdom Flow Cytometry Market Revenue (Million) Forecast, by Application 2019 & 2032
- Table 14: France Flow Cytometry Market Revenue (Million) Forecast, by Application 2019 & 2032
- Table 15: Italy Flow Cytometry Market Revenue (Million) Forecast, by Application 2019 & 2032
- Table 16: Spain Flow Cytometry Market Revenue (Million) Forecast, by Application 2019 & 2032
- Table 17: Rest of Europe Flow Cytometry Market Revenue (Million) Forecast, by Application 2019 & 2032
- Table 18: Global Flow Cytometry Market Revenue Million Forecast, by Country 2019 & 2032
- Table 19: China Flow Cytometry Market Revenue (Million) Forecast, by Application 2019 & 2032
- Table 20: Japan Flow Cytometry Market Revenue (Million) Forecast, by Application 2019 & 2032
- Table 21: India Flow Cytometry Market Revenue (Million) Forecast, by Application 2019 & 2032
- Table 22: Australia Flow Cytometry Market Revenue (Million) Forecast, by Application 2019 & 2032
- Table 23: South Korea Flow Cytometry Market Revenue (Million) Forecast, by Application 2019 & 2032
- Table 24: Rest of Asia Pacific Flow Cytometry Market Revenue (Million) Forecast, by Application 2019 & 2032
- Table 25: Global Flow Cytometry Market Revenue Million Forecast, by Country 2019 & 2032
- Table 26: GCC Flow Cytometry Market Revenue (Million) Forecast, by Application 2019 & 2032
- Table 27: South Africa Flow Cytometry Market Revenue (Million) Forecast, by Application 2019 & 2032
- Table 28: Rest of Middle East and Africa Flow Cytometry Market Revenue (Million) Forecast, by Application 2019 & 2032
- Table 29: Global Flow Cytometry Market Revenue Million Forecast, by Country 2019 & 2032
- Table 30: Brazil Flow Cytometry Market Revenue (Million) Forecast, by Application 2019 & 2032
- Table 31: Argentina Flow Cytometry Market Revenue (Million) Forecast, by Application 2019 & 2032
- Table 32: Rest of South America Flow Cytometry Market Revenue (Million) Forecast, by Application 2019 & 2032
- Table 33: Global Flow Cytometry Market Revenue Million Forecast, by Product Type 2019 & 2032
- Table 34: Global Flow Cytometry Market Revenue Million Forecast, by Technology 2019 & 2032
- Table 35: Global Flow Cytometry Market Revenue Million Forecast, by Application 2019 & 2032
- Table 36: Global Flow Cytometry Market Revenue Million Forecast, by End-User 2019 & 2032
- Table 37: Global Flow Cytometry Market Revenue Million Forecast, by Country 2019 & 2032
- Table 38: United States Flow Cytometry Market Revenue (Million) Forecast, by Application 2019 & 2032
- Table 39: Canada Flow Cytometry Market Revenue (Million) Forecast, by Application 2019 & 2032
- Table 40: Mexico Flow Cytometry Market Revenue (Million) Forecast, by Application 2019 & 2032
- Table 41: Global Flow Cytometry Market Revenue Million Forecast, by Product Type 2019 & 2032
- Table 42: Global Flow Cytometry Market Revenue Million Forecast, by Technology 2019 & 2032
- Table 43: Global Flow Cytometry Market Revenue Million Forecast, by Application 2019 & 2032
- Table 44: Global Flow Cytometry Market Revenue Million Forecast, by End-User 2019 & 2032
- Table 45: Global Flow Cytometry Market Revenue Million Forecast, by Country 2019 & 2032
- Table 46: Germany Flow Cytometry Market Revenue (Million) Forecast, by Application 2019 & 2032
- Table 47: United Kingdom Flow Cytometry Market Revenue (Million) Forecast, by Application 2019 & 2032
- Table 48: France Flow Cytometry Market Revenue (Million) Forecast, by Application 2019 & 2032
- Table 49: Italy Flow Cytometry Market Revenue (Million) Forecast, by Application 2019 & 2032
- Table 50: Spain Flow Cytometry Market Revenue (Million) Forecast, by Application 2019 & 2032
- Table 51: Rest of Europe Flow Cytometry Market Revenue (Million) Forecast, by Application 2019 & 2032
- Table 52: Global Flow Cytometry Market Revenue Million Forecast, by Product Type 2019 & 2032
- Table 53: Global Flow Cytometry Market Revenue Million Forecast, by Technology 2019 & 2032
- Table 54: Global Flow Cytometry Market Revenue Million Forecast, by Application 2019 & 2032
- Table 55: Global Flow Cytometry Market Revenue Million Forecast, by End-User 2019 & 2032
- Table 56: Global Flow Cytometry Market Revenue Million Forecast, by Country 2019 & 2032
- Table 57: China Flow Cytometry Market Revenue (Million) Forecast, by Application 2019 & 2032
- Table 58: Japan Flow Cytometry Market Revenue (Million) Forecast, by Application 2019 & 2032
- Table 59: India Flow Cytometry Market Revenue (Million) Forecast, by Application 2019 & 2032
- Table 60: Australia Flow Cytometry Market Revenue (Million) Forecast, by Application 2019 & 2032
- Table 61: South Korea Flow Cytometry Market Revenue (Million) Forecast, by Application 2019 & 2032
- Table 62: Rest of Asia Pacific Flow Cytometry Market Revenue (Million) Forecast, by Application 2019 & 2032
- Table 63: Global Flow Cytometry Market Revenue Million Forecast, by Product Type 2019 & 2032
- Table 64: Global Flow Cytometry Market Revenue Million Forecast, by Technology 2019 & 2032
- Table 65: Global Flow Cytometry Market Revenue Million Forecast, by Application 2019 & 2032
- Table 66: Global Flow Cytometry Market Revenue Million Forecast, by End-User 2019 & 2032
- Table 67: Global Flow Cytometry Market Revenue Million Forecast, by Country 2019 & 2032
- Table 68: GCC Flow Cytometry Market Revenue (Million) Forecast, by Application 2019 & 2032
- Table 69: South Africa Flow Cytometry Market Revenue (Million) Forecast, by Application 2019 & 2032
- Table 70: Rest of Middle East and Africa Flow Cytometry Market Revenue (Million) Forecast, by Application 2019 & 2032
- Table 71: Global Flow Cytometry Market Revenue Million Forecast, by Product Type 2019 & 2032
- Table 72: Global Flow Cytometry Market Revenue Million Forecast, by Technology 2019 & 2032
- Table 73: Global Flow Cytometry Market Revenue Million Forecast, by Application 2019 & 2032
- Table 74: Global Flow Cytometry Market Revenue Million Forecast, by End-User 2019 & 2032
- Table 75: Global Flow Cytometry Market Revenue Million Forecast, by Country 2019 & 2032
- Table 76: Brazil Flow Cytometry Market Revenue (Million) Forecast, by Application 2019 & 2032
- Table 77: Argentina Flow Cytometry Market Revenue (Million) Forecast, by Application 2019 & 2032
- Table 78: Rest of South America Flow Cytometry Market Revenue (Million) Forecast, by Application 2019 & 2032
Frequently Asked Questions
1. What is the projected Compound Annual Growth Rate (CAGR) of the Flow Cytometry Market?
The projected CAGR is approximately 7.69%.
2. Which companies are prominent players in the Flow Cytometry Market?
Key companies in the market include Becton Dickinson and Company, Enzo Biochem Inc (Enzo Life Sciences Inc )*List Not Exhaustive, Miltenyi Biotech, BioMerieux SA, Bio-Rad Laboratories Inc, Stratedigm Inc, Sony Biotechnology Inc (Sony Corporation of America), Agilent Technologies Inc, Sysmex Corporation, Danaher corporation (Beckman Coulter Inc ), Luminex Corporation, ThermoFisher Scientific Inc.
3. What are the main segments of the Flow Cytometry Market?
The market segments include Product Type, Technology, Application, End-User.
4. Can you provide details about the market size?
The market size is estimated to be USD 6.27 Million as of 2022.
5. What are some drivers contributing to market growth?
Growing Adoption of Flow Cytometry in Stem Cell Research; Increasing Applications of Flow Cytometry in Clinical Research.
6. What are the notable trends driving market growth?
Stem Cell Therapy Segment is Expected to Witness a Significant Growth Over the Forecast Period..
7. Are there any restraints impacting market growth?
Lack of Awareness about the Potential Benefits of Flow Cytometry Techniques; High Cost of the Equipment.
8. Can you provide examples of recent developments in the market?
November 2022: Sony Corporation released SFA-Life Sciences Cloud Platform, a cloud-based solution for analyzing flow cytometry data that makes it easy to find rare cells like cancer cells and stem cells in a large number of cell populations. The solution uses data from flow cytometers to do this.
9. What pricing options are available for accessing the report?
Pricing options include single-user, multi-user, and enterprise licenses priced at USD 4750, USD 5250, and USD 8750 respectively.
10. Is the market size provided in terms of value or volume?
The market size is provided in terms of value, measured in Million.
11. Are there any specific market keywords associated with the report?
Yes, the market keyword associated with the report is "Flow Cytometry Market," which aids in identifying and referencing the specific market segment covered.
12. How do I determine which pricing option suits my needs best?
The pricing options vary based on user requirements and access needs. Individual users may opt for single-user licenses, while businesses requiring broader access may choose multi-user or enterprise licenses for cost-effective access to the report.
13. Are there any additional resources or data provided in the Flow Cytometry Market report?
While the report offers comprehensive insights, it's advisable to review the specific contents or supplementary materials provided to ascertain if additional resources or data are available.
14. How can I stay updated on further developments or reports in the Flow Cytometry Market?
To stay informed about further developments, trends, and reports in the Flow Cytometry Market, consider subscribing to industry newsletters, following relevant companies and organizations, or regularly checking reputable industry news sources and publications.
Methodology
Step 1 - Identification of Relevant Samples Size from Population Database


Step 2 - Approaches for Defining Global Market Size (Value, Volume* & Price*)

Note*: In applicable scenarios
Step 3 - Data Sources
Primary Research
- Web Analytics
- Survey Reports
- Research Institute
- Latest Research Reports
- Opinion Leaders
Secondary Research
- Annual Reports
- White Paper
- Latest Press Release
- Industry Association
- Paid Database
- Investor Presentations

Step 4 - Data Triangulation
Involves using different sources of information in order to increase the validity of a study
These sources are likely to be stakeholders in a program - participants, other researchers, program staff, other community members, and so on.
Then we put all data in single framework & apply various statistical tools to find out the dynamic on the market.
During the analysis stage, feedback from the stakeholder groups would be compared to determine areas of agreement as well as areas of divergence
