

Key Insights
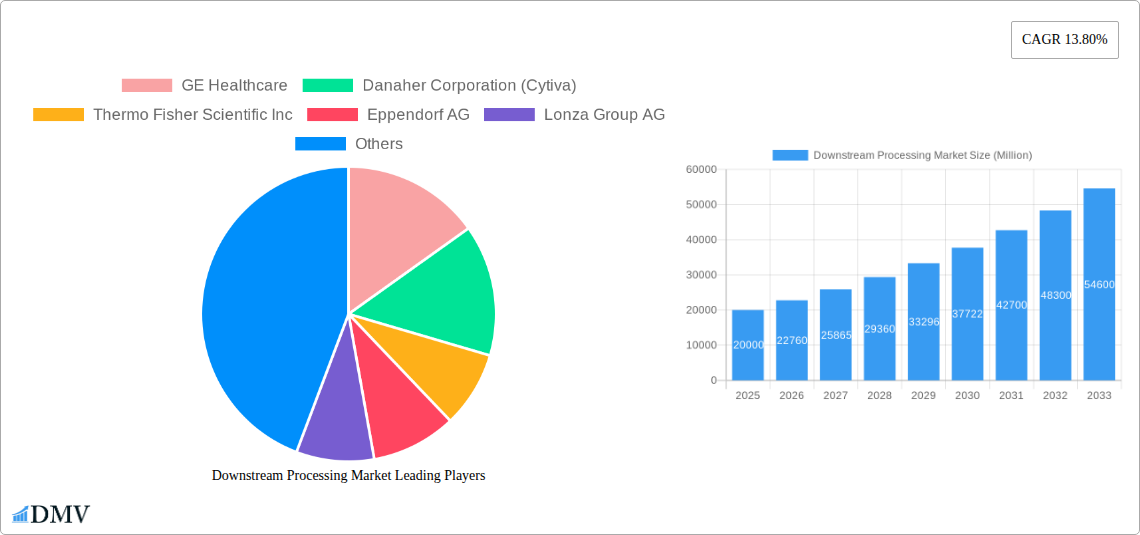
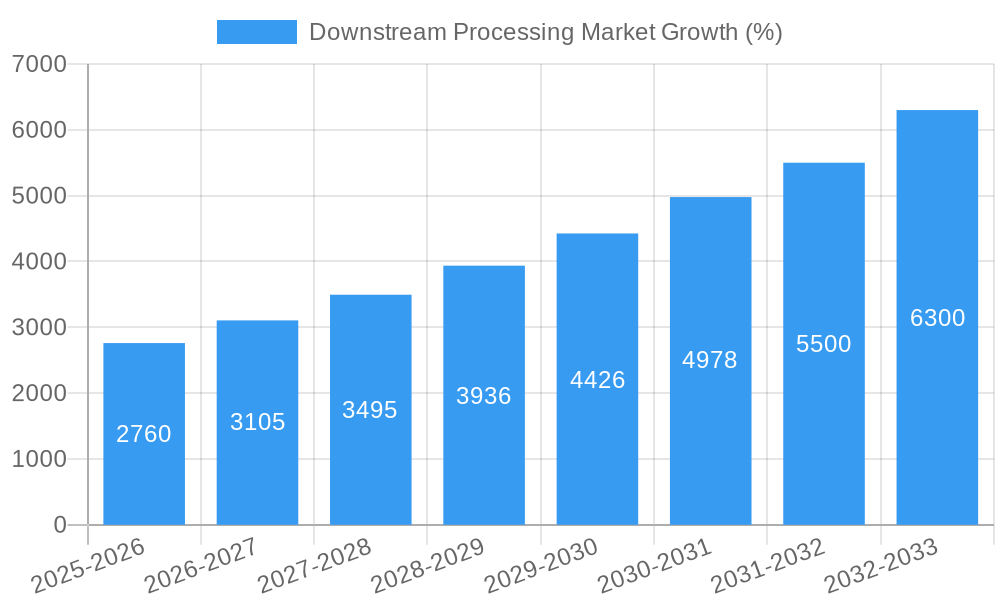
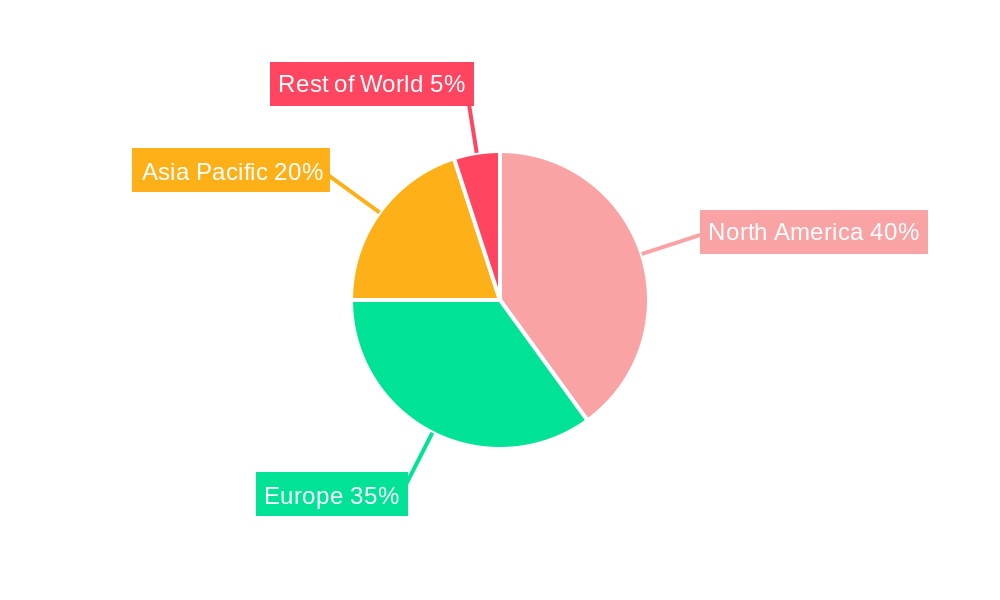
The downstream processing market, encompassing purification, separation, and concentration techniques for biopharmaceuticals, is experiencing robust growth, projected at a 13.80% CAGR from 2025 to 2033. This expansion is fueled by several key factors. The surging demand for biologics, including antibodies, vaccines, and insulin, is a primary driver. Technological advancements in chromatography, filtration, and centrifugation are enhancing efficiency and yield, further stimulating market growth. Increasing outsourcing of downstream processing activities by pharmaceutical companies to contract manufacturing organizations (CMOs) is another significant contributor. The market is segmented by technique (purification, solid-liquid separation, clarification/concentration), product (chromatography columns, filters, evaporators, centrifuges), and application (antibody, vaccine, insulin production). North America and Europe currently hold significant market share, driven by established biopharmaceutical industries and robust regulatory frameworks. However, the Asia-Pacific region is poised for rapid growth, fueled by increasing investment in biopharmaceutical manufacturing and a burgeoning middle class demanding better healthcare access.
Despite this positive outlook, the market faces challenges. High capital investment required for advanced equipment and stringent regulatory compliance can present barriers to entry for smaller players. Furthermore, the complexity of downstream processing for advanced therapeutics, such as cell and gene therapies, necessitates continuous innovation and technological improvements. Competition among established players like GE Healthcare, Danaher Corporation (Cytiva), Thermo Fisher Scientific, and Sartorius Stedim Biotech is intense, driving the need for differentiation through technological advancements and specialized services. The market's future hinges on addressing these challenges while leveraging the immense potential of emerging biopharmaceutical products and advancements in processing technologies. The overall market demonstrates a strong upward trajectory, supported by continuous innovation and growing demand in the biopharmaceutical sector.
Downstream Processing Market: A Comprehensive Report (2019-2033)
This insightful report provides a detailed analysis of the Downstream Processing Market, offering a comprehensive overview of market trends, key players, technological advancements, and future growth prospects. With a study period spanning 2019-2033, a base year of 2025, and a forecast period of 2025-2033, this report is an invaluable resource for stakeholders seeking to understand and capitalize on opportunities within this dynamic market. The global market size was valued at xx Million in 2024 and is projected to reach xx Million by 2033, exhibiting a robust CAGR of xx% during the forecast period.
Downstream Processing Market Composition & Trends
This section delves into the competitive landscape of the downstream processing market, analyzing market concentration, innovation drivers, regulatory frameworks, substitute products, and end-user profiles. We examine the impact of mergers and acquisitions (M&A) activities on market dynamics, providing insights into deal values and their influence on market share distribution. Key players like GE Healthcare, Danaher Corporation (Cytiva), and Thermo Fisher Scientific Inc. dominate the market, but several smaller players are also making significant contributions. The market is characterized by a moderate level of concentration, with the top five players holding an estimated xx% market share in 2024. Innovation is primarily driven by the need for increased efficiency, reduced processing times, and improved product yields, particularly in the biopharmaceutical sector. Stringent regulatory landscapes, particularly in regions like North America and Europe, influence market practices and product development. The emergence of alternative technologies poses a moderate threat, with some companies seeking to disrupt existing methods.
- Market Concentration: Highly concentrated with the top 5 players holding xx% market share in 2024.
- Innovation Catalysts: Demand for higher efficiency, reduced processing times, and improved yields.
- Regulatory Landscape: Stringent regulations in North America and Europe drive compliance and innovation.
- Substitute Products: Emerging alternative technologies present a moderate competitive threat.
- End-User Profiles: Primarily pharmaceutical and biotechnology companies focusing on biopharmaceutical production.
- M&A Activity: Significant M&A activity observed in recent years with deal values exceeding xx Million in the last 5 years. Examples include Sartorius Stedim Biotech's acquisition of Novasep's chromatography division.
Downstream Processing Market Industry Evolution
This section offers a detailed analysis of the Downstream Processing Market's evolution, exploring market growth trajectories, technological advancements, and changing consumer demands. The market has witnessed substantial growth driven by the rising demand for biologics, including monoclonal antibodies, vaccines, and recombinant proteins. Technological advancements, such as the adoption of single-use technologies and continuous processing, have significantly improved efficiency and reduced costs. Shifting consumer demands, including the need for personalized medicine and advanced therapies, are also shaping market dynamics. The market experienced a growth rate of xx% from 2019 to 2024, and this trend is expected to continue in the forecast period. Adoption of automation and digitalization is also increasing at an average rate of xx% annually. The rise of contract development and manufacturing organizations (CDMOs) has also significantly influenced the market's growth trajectory.
Leading Regions, Countries, or Segments in Downstream Processing Market
North America currently holds the largest market share, driven by a strong presence of pharmaceutical and biotechnology companies, substantial investments in R&D, and favorable regulatory environments. Europe follows closely, with a strong emphasis on biopharmaceutical manufacturing. The Asia-Pacific region is experiencing rapid growth, propelled by increasing healthcare expenditure and the expansion of biopharmaceutical manufacturing facilities.
- By Technique: Purification techniques dominate the market, followed by solid-liquid separation and clarification/concentration.
- By Product: Chromatography columns and resins are the leading product segment, closely followed by filters.
- By Application: Antibodies production accounts for the largest share, followed by vaccines production.
- Key Drivers (North America): High R&D spending, strong regulatory support, and a large biopharmaceutical industry.
- Key Drivers (Europe): Established biopharmaceutical manufacturing base, strong regulatory framework, and skilled workforce.
- Key Drivers (Asia-Pacific): Rising healthcare expenditure, government initiatives promoting biopharmaceutical production, and a growing middle class.
Downstream Processing Market Product Innovations
Recent innovations include the development of advanced chromatography resins with enhanced selectivity and binding capacity, improved filtration systems with higher throughput and reduced fouling, and automated process control systems enabling real-time monitoring and optimization. These innovations focus on improving efficiency, reducing processing time, and enhancing product quality and yield. The integration of artificial intelligence and machine learning is also gaining traction, further optimizing downstream processing workflows.
Propelling Factors for Downstream Processing Market Growth
The market is driven by several factors: the increasing demand for biologics, technological advancements leading to improved efficiency and reduced costs, supportive government regulations promoting biopharmaceutical manufacturing, and rising investments in R&D activities within the pharmaceutical and biotechnology industries. The growing prevalence of chronic diseases also contributes significantly to market growth.
Obstacles in the Downstream Processing Market
Significant challenges include stringent regulatory requirements, complexities associated with scaling up processes, potential supply chain disruptions impacting raw material availability, and intense competition among established players. These factors can impact production timelines and profitability.
Future Opportunities in Downstream Processing Market
Emerging opportunities lie in the development of advanced continuous processing technologies, the integration of AI and machine learning for process optimization, and the expansion into new therapeutic areas such as gene therapy and cell therapy. Further penetration into emerging markets in Asia-Pacific and Latin America also offers significant growth potential.
Major Players in the Downstream Processing Market Ecosystem
- GE Healthcare
- Danaher Corporation (Cytiva)
- Thermo Fisher Scientific Inc
- Eppendorf AG
- Lonza Group AG
- 3M Company
- Repligen Corporation
- Sartorius Stedim Biotech S A
- Merck KGaA (Merck Millipore)
Key Developments in Downstream Processing Market Industry
- June 2022: Merck and Agilent Technologies collaborate to improve process analytical technologies (PAT) for downstream processing.
- February 2022: Sartorius Stedim Biotech acquires Novasep's chromatography division, expanding its capabilities in smaller biomolecule processing.
Strategic Downstream Processing Market Forecast
The Downstream Processing Market is poised for significant growth, driven by technological innovations, increasing demand for biologics, and expanding global healthcare spending. The market is expected to witness substantial expansion across various segments, with continuous processing technologies and advanced analytics playing a crucial role in shaping future market dynamics. The forecast period promises strong growth, primarily fueled by advancements in purification techniques, increased automation, and the development of more efficient and cost-effective solutions.
Downstream Processing Market Segmentation
-
1. Technique
- 1.1. Purification Techniques
- 1.2. Solid-Liquid Separation
- 1.3. Clarification/Concentration
-
2. Product
- 2.1. Chromatography Columns and Resins
- 2.2. Filters
- 2.3. Evaporators
- 2.4. Centrifuges
- 2.5. Other Products
-
3. Application
- 3.1. Antibodies Production
- 3.2. Vaccines Production
- 3.3. Insulin Production
- 3.4. Other Applications
Downstream Processing Market Segmentation By Geography
-
1. North America
- 1.1. United States
- 1.2. Canada
- 1.3. Mexico
-
2. Europe
- 2.1. Germany
- 2.2. United Kingdom
- 2.3. France
- 2.4. Italy
- 2.5. Spain
- 2.6. Rest of Europe
-
3. Asia Pacific
- 3.1. China
- 3.2. Japan
- 3.3. India
- 3.4. Australia
- 3.5. South Korea
- 3.6. Rest of Asia Pacific
-
4. Middle East and Africa
- 4.1. GCC
- 4.2. South Africa
- 4.3. Rest of Middle East and Africa
-
5. South America
- 5.1. Brazil
- 5.2. Argentina
- 5.3. Rest of South America
Downstream Processing Market REPORT HIGHLIGHTS
| Aspects | Details |
|---|---|
| Study Period | 2019-2033 |
| Base Year | 2024 |
| Estimated Year | 2025 |
| Forecast Period | 2025-2033 |
| Historical Period | 2019-2024 |
| Growth Rate | CAGR of 13.80% from 2019-2033 |
| Segmentation |
|
Table of Contents
- 1. Introduction
- 1.1. Research Scope
- 1.2. Market Segmentation
- 1.3. Research Methodology
- 1.4. Definitions and Assumptions
- 2. Executive Summary
- 2.1. Introduction
- 3. Market Dynamics
- 3.1. Introduction
- 3.2. Market Drivers
- 3.2.1. Growth of Biotechnology Sector Globally; Rising R&D Expenditure in Biopharmaceutical Companies; Increase in the Prominence of Contract Manufacturing Organizations
- 3.3. Market Restrains
- 3.3.1. High Cost of Instruments; Purification Bottleneck
- 3.4. Market Trends
- 3.4.1. Antibodies Production is Expected to Dominate the Downstream Processing Market During the Forecast Period
- 4. Market Factor Analysis
- 4.1. Porters Five Forces
- 4.2. Supply/Value Chain
- 4.3. PESTEL analysis
- 4.4. Market Entropy
- 4.5. Patent/Trademark Analysis
- 5. Global Downstream Processing Market Analysis, Insights and Forecast, 2019-2031
- 5.1. Market Analysis, Insights and Forecast - by Technique
- 5.1.1. Purification Techniques
- 5.1.2. Solid-Liquid Separation
- 5.1.3. Clarification/Concentration
- 5.2. Market Analysis, Insights and Forecast - by Product
- 5.2.1. Chromatography Columns and Resins
- 5.2.2. Filters
- 5.2.3. Evaporators
- 5.2.4. Centrifuges
- 5.2.5. Other Products
- 5.3. Market Analysis, Insights and Forecast - by Application
- 5.3.1. Antibodies Production
- 5.3.2. Vaccines Production
- 5.3.3. Insulin Production
- 5.3.4. Other Applications
- 5.4. Market Analysis, Insights and Forecast - by Region
- 5.4.1. North America
- 5.4.2. Europe
- 5.4.3. Asia Pacific
- 5.4.4. Middle East and Africa
- 5.4.5. South America
- 5.1. Market Analysis, Insights and Forecast - by Technique
- 6. North America Downstream Processing Market Analysis, Insights and Forecast, 2019-2031
- 6.1. Market Analysis, Insights and Forecast - by Technique
- 6.1.1. Purification Techniques
- 6.1.2. Solid-Liquid Separation
- 6.1.3. Clarification/Concentration
- 6.2. Market Analysis, Insights and Forecast - by Product
- 6.2.1. Chromatography Columns and Resins
- 6.2.2. Filters
- 6.2.3. Evaporators
- 6.2.4. Centrifuges
- 6.2.5. Other Products
- 6.3. Market Analysis, Insights and Forecast - by Application
- 6.3.1. Antibodies Production
- 6.3.2. Vaccines Production
- 6.3.3. Insulin Production
- 6.3.4. Other Applications
- 6.1. Market Analysis, Insights and Forecast - by Technique
- 7. Europe Downstream Processing Market Analysis, Insights and Forecast, 2019-2031
- 7.1. Market Analysis, Insights and Forecast - by Technique
- 7.1.1. Purification Techniques
- 7.1.2. Solid-Liquid Separation
- 7.1.3. Clarification/Concentration
- 7.2. Market Analysis, Insights and Forecast - by Product
- 7.2.1. Chromatography Columns and Resins
- 7.2.2. Filters
- 7.2.3. Evaporators
- 7.2.4. Centrifuges
- 7.2.5. Other Products
- 7.3. Market Analysis, Insights and Forecast - by Application
- 7.3.1. Antibodies Production
- 7.3.2. Vaccines Production
- 7.3.3. Insulin Production
- 7.3.4. Other Applications
- 7.1. Market Analysis, Insights and Forecast - by Technique
- 8. Asia Pacific Downstream Processing Market Analysis, Insights and Forecast, 2019-2031
- 8.1. Market Analysis, Insights and Forecast - by Technique
- 8.1.1. Purification Techniques
- 8.1.2. Solid-Liquid Separation
- 8.1.3. Clarification/Concentration
- 8.2. Market Analysis, Insights and Forecast - by Product
- 8.2.1. Chromatography Columns and Resins
- 8.2.2. Filters
- 8.2.3. Evaporators
- 8.2.4. Centrifuges
- 8.2.5. Other Products
- 8.3. Market Analysis, Insights and Forecast - by Application
- 8.3.1. Antibodies Production
- 8.3.2. Vaccines Production
- 8.3.3. Insulin Production
- 8.3.4. Other Applications
- 8.1. Market Analysis, Insights and Forecast - by Technique
- 9. Middle East and Africa Downstream Processing Market Analysis, Insights and Forecast, 2019-2031
- 9.1. Market Analysis, Insights and Forecast - by Technique
- 9.1.1. Purification Techniques
- 9.1.2. Solid-Liquid Separation
- 9.1.3. Clarification/Concentration
- 9.2. Market Analysis, Insights and Forecast - by Product
- 9.2.1. Chromatography Columns and Resins
- 9.2.2. Filters
- 9.2.3. Evaporators
- 9.2.4. Centrifuges
- 9.2.5. Other Products
- 9.3. Market Analysis, Insights and Forecast - by Application
- 9.3.1. Antibodies Production
- 9.3.2. Vaccines Production
- 9.3.3. Insulin Production
- 9.3.4. Other Applications
- 9.1. Market Analysis, Insights and Forecast - by Technique
- 10. South America Downstream Processing Market Analysis, Insights and Forecast, 2019-2031
- 10.1. Market Analysis, Insights and Forecast - by Technique
- 10.1.1. Purification Techniques
- 10.1.2. Solid-Liquid Separation
- 10.1.3. Clarification/Concentration
- 10.2. Market Analysis, Insights and Forecast - by Product
- 10.2.1. Chromatography Columns and Resins
- 10.2.2. Filters
- 10.2.3. Evaporators
- 10.2.4. Centrifuges
- 10.2.5. Other Products
- 10.3. Market Analysis, Insights and Forecast - by Application
- 10.3.1. Antibodies Production
- 10.3.2. Vaccines Production
- 10.3.3. Insulin Production
- 10.3.4. Other Applications
- 10.1. Market Analysis, Insights and Forecast - by Technique
- 11. North America Downstream Processing Market Analysis, Insights and Forecast, 2019-2031
- 11.1. Market Analysis, Insights and Forecast - By Country/Sub-region
- 11.1.1 United States
- 11.1.2 Canada
- 11.1.3 Mexico
- 12. Europe Downstream Processing Market Analysis, Insights and Forecast, 2019-2031
- 12.1. Market Analysis, Insights and Forecast - By Country/Sub-region
- 12.1.1 Germany
- 12.1.2 United Kingdom
- 12.1.3 France
- 12.1.4 Italy
- 12.1.5 Spain
- 12.1.6 Rest of Europe
- 13. Asia Pacific Downstream Processing Market Analysis, Insights and Forecast, 2019-2031
- 13.1. Market Analysis, Insights and Forecast - By Country/Sub-region
- 13.1.1 China
- 13.1.2 Japan
- 13.1.3 India
- 13.1.4 Australia
- 13.1.5 South Korea
- 13.1.6 Rest of Asia Pacific
- 14. Middle East and Africa Downstream Processing Market Analysis, Insights and Forecast, 2019-2031
- 14.1. Market Analysis, Insights and Forecast - By Country/Sub-region
- 14.1.1 GCC
- 14.1.2 South Africa
- 14.1.3 Rest of Middle East and Africa
- 15. South America Downstream Processing Market Analysis, Insights and Forecast, 2019-2031
- 15.1. Market Analysis, Insights and Forecast - By Country/Sub-region
- 15.1.1 Brazil
- 15.1.2 Argentina
- 15.1.3 Rest of South America
- 16. Competitive Analysis
- 16.1. Global Market Share Analysis 2024
- 16.2. Company Profiles
- 16.2.1 GE Healthcare
- 16.2.1.1. Overview
- 16.2.1.2. Products
- 16.2.1.3. SWOT Analysis
- 16.2.1.4. Recent Developments
- 16.2.1.5. Financials (Based on Availability)
- 16.2.2 Danaher Corporation (Cytiva)
- 16.2.2.1. Overview
- 16.2.2.2. Products
- 16.2.2.3. SWOT Analysis
- 16.2.2.4. Recent Developments
- 16.2.2.5. Financials (Based on Availability)
- 16.2.3 Thermo Fisher Scientific Inc
- 16.2.3.1. Overview
- 16.2.3.2. Products
- 16.2.3.3. SWOT Analysis
- 16.2.3.4. Recent Developments
- 16.2.3.5. Financials (Based on Availability)
- 16.2.4 Eppendorf AG
- 16.2.4.1. Overview
- 16.2.4.2. Products
- 16.2.4.3. SWOT Analysis
- 16.2.4.4. Recent Developments
- 16.2.4.5. Financials (Based on Availability)
- 16.2.5 Lonza Group AG
- 16.2.5.1. Overview
- 16.2.5.2. Products
- 16.2.5.3. SWOT Analysis
- 16.2.5.4. Recent Developments
- 16.2.5.5. Financials (Based on Availability)
- 16.2.6 3M Company
- 16.2.6.1. Overview
- 16.2.6.2. Products
- 16.2.6.3. SWOT Analysis
- 16.2.6.4. Recent Developments
- 16.2.6.5. Financials (Based on Availability)
- 16.2.7 Repligen Corporation
- 16.2.7.1. Overview
- 16.2.7.2. Products
- 16.2.7.3. SWOT Analysis
- 16.2.7.4. Recent Developments
- 16.2.7.5. Financials (Based on Availability)
- 16.2.8 Sartorius Stedim Biotech S A
- 16.2.8.1. Overview
- 16.2.8.2. Products
- 16.2.8.3. SWOT Analysis
- 16.2.8.4. Recent Developments
- 16.2.8.5. Financials (Based on Availability)
- 16.2.9 Merck KGaA (Merck Millipore)
- 16.2.9.1. Overview
- 16.2.9.2. Products
- 16.2.9.3. SWOT Analysis
- 16.2.9.4. Recent Developments
- 16.2.9.5. Financials (Based on Availability)
- 16.2.1 GE Healthcare
List of Figures
- Figure 1: Global Downstream Processing Market Revenue Breakdown (Million, %) by Region 2024 & 2032
- Figure 2: Global Downstream Processing Market Volume Breakdown (K Unit, %) by Region 2024 & 2032
- Figure 3: North America Downstream Processing Market Revenue (Million), by Country 2024 & 2032
- Figure 4: North America Downstream Processing Market Volume (K Unit), by Country 2024 & 2032
- Figure 5: North America Downstream Processing Market Revenue Share (%), by Country 2024 & 2032
- Figure 6: North America Downstream Processing Market Volume Share (%), by Country 2024 & 2032
- Figure 7: Europe Downstream Processing Market Revenue (Million), by Country 2024 & 2032
- Figure 8: Europe Downstream Processing Market Volume (K Unit), by Country 2024 & 2032
- Figure 9: Europe Downstream Processing Market Revenue Share (%), by Country 2024 & 2032
- Figure 10: Europe Downstream Processing Market Volume Share (%), by Country 2024 & 2032
- Figure 11: Asia Pacific Downstream Processing Market Revenue (Million), by Country 2024 & 2032
- Figure 12: Asia Pacific Downstream Processing Market Volume (K Unit), by Country 2024 & 2032
- Figure 13: Asia Pacific Downstream Processing Market Revenue Share (%), by Country 2024 & 2032
- Figure 14: Asia Pacific Downstream Processing Market Volume Share (%), by Country 2024 & 2032
- Figure 15: Middle East and Africa Downstream Processing Market Revenue (Million), by Country 2024 & 2032
- Figure 16: Middle East and Africa Downstream Processing Market Volume (K Unit), by Country 2024 & 2032
- Figure 17: Middle East and Africa Downstream Processing Market Revenue Share (%), by Country 2024 & 2032
- Figure 18: Middle East and Africa Downstream Processing Market Volume Share (%), by Country 2024 & 2032
- Figure 19: South America Downstream Processing Market Revenue (Million), by Country 2024 & 2032
- Figure 20: South America Downstream Processing Market Volume (K Unit), by Country 2024 & 2032
- Figure 21: South America Downstream Processing Market Revenue Share (%), by Country 2024 & 2032
- Figure 22: South America Downstream Processing Market Volume Share (%), by Country 2024 & 2032
- Figure 23: North America Downstream Processing Market Revenue (Million), by Technique 2024 & 2032
- Figure 24: North America Downstream Processing Market Volume (K Unit), by Technique 2024 & 2032
- Figure 25: North America Downstream Processing Market Revenue Share (%), by Technique 2024 & 2032
- Figure 26: North America Downstream Processing Market Volume Share (%), by Technique 2024 & 2032
- Figure 27: North America Downstream Processing Market Revenue (Million), by Product 2024 & 2032
- Figure 28: North America Downstream Processing Market Volume (K Unit), by Product 2024 & 2032
- Figure 29: North America Downstream Processing Market Revenue Share (%), by Product 2024 & 2032
- Figure 30: North America Downstream Processing Market Volume Share (%), by Product 2024 & 2032
- Figure 31: North America Downstream Processing Market Revenue (Million), by Application 2024 & 2032
- Figure 32: North America Downstream Processing Market Volume (K Unit), by Application 2024 & 2032
- Figure 33: North America Downstream Processing Market Revenue Share (%), by Application 2024 & 2032
- Figure 34: North America Downstream Processing Market Volume Share (%), by Application 2024 & 2032
- Figure 35: North America Downstream Processing Market Revenue (Million), by Country 2024 & 2032
- Figure 36: North America Downstream Processing Market Volume (K Unit), by Country 2024 & 2032
- Figure 37: North America Downstream Processing Market Revenue Share (%), by Country 2024 & 2032
- Figure 38: North America Downstream Processing Market Volume Share (%), by Country 2024 & 2032
- Figure 39: Europe Downstream Processing Market Revenue (Million), by Technique 2024 & 2032
- Figure 40: Europe Downstream Processing Market Volume (K Unit), by Technique 2024 & 2032
- Figure 41: Europe Downstream Processing Market Revenue Share (%), by Technique 2024 & 2032
- Figure 42: Europe Downstream Processing Market Volume Share (%), by Technique 2024 & 2032
- Figure 43: Europe Downstream Processing Market Revenue (Million), by Product 2024 & 2032
- Figure 44: Europe Downstream Processing Market Volume (K Unit), by Product 2024 & 2032
- Figure 45: Europe Downstream Processing Market Revenue Share (%), by Product 2024 & 2032
- Figure 46: Europe Downstream Processing Market Volume Share (%), by Product 2024 & 2032
- Figure 47: Europe Downstream Processing Market Revenue (Million), by Application 2024 & 2032
- Figure 48: Europe Downstream Processing Market Volume (K Unit), by Application 2024 & 2032
- Figure 49: Europe Downstream Processing Market Revenue Share (%), by Application 2024 & 2032
- Figure 50: Europe Downstream Processing Market Volume Share (%), by Application 2024 & 2032
- Figure 51: Europe Downstream Processing Market Revenue (Million), by Country 2024 & 2032
- Figure 52: Europe Downstream Processing Market Volume (K Unit), by Country 2024 & 2032
- Figure 53: Europe Downstream Processing Market Revenue Share (%), by Country 2024 & 2032
- Figure 54: Europe Downstream Processing Market Volume Share (%), by Country 2024 & 2032
- Figure 55: Asia Pacific Downstream Processing Market Revenue (Million), by Technique 2024 & 2032
- Figure 56: Asia Pacific Downstream Processing Market Volume (K Unit), by Technique 2024 & 2032
- Figure 57: Asia Pacific Downstream Processing Market Revenue Share (%), by Technique 2024 & 2032
- Figure 58: Asia Pacific Downstream Processing Market Volume Share (%), by Technique 2024 & 2032
- Figure 59: Asia Pacific Downstream Processing Market Revenue (Million), by Product 2024 & 2032
- Figure 60: Asia Pacific Downstream Processing Market Volume (K Unit), by Product 2024 & 2032
- Figure 61: Asia Pacific Downstream Processing Market Revenue Share (%), by Product 2024 & 2032
- Figure 62: Asia Pacific Downstream Processing Market Volume Share (%), by Product 2024 & 2032
- Figure 63: Asia Pacific Downstream Processing Market Revenue (Million), by Application 2024 & 2032
- Figure 64: Asia Pacific Downstream Processing Market Volume (K Unit), by Application 2024 & 2032
- Figure 65: Asia Pacific Downstream Processing Market Revenue Share (%), by Application 2024 & 2032
- Figure 66: Asia Pacific Downstream Processing Market Volume Share (%), by Application 2024 & 2032
- Figure 67: Asia Pacific Downstream Processing Market Revenue (Million), by Country 2024 & 2032
- Figure 68: Asia Pacific Downstream Processing Market Volume (K Unit), by Country 2024 & 2032
- Figure 69: Asia Pacific Downstream Processing Market Revenue Share (%), by Country 2024 & 2032
- Figure 70: Asia Pacific Downstream Processing Market Volume Share (%), by Country 2024 & 2032
- Figure 71: Middle East and Africa Downstream Processing Market Revenue (Million), by Technique 2024 & 2032
- Figure 72: Middle East and Africa Downstream Processing Market Volume (K Unit), by Technique 2024 & 2032
- Figure 73: Middle East and Africa Downstream Processing Market Revenue Share (%), by Technique 2024 & 2032
- Figure 74: Middle East and Africa Downstream Processing Market Volume Share (%), by Technique 2024 & 2032
- Figure 75: Middle East and Africa Downstream Processing Market Revenue (Million), by Product 2024 & 2032
- Figure 76: Middle East and Africa Downstream Processing Market Volume (K Unit), by Product 2024 & 2032
- Figure 77: Middle East and Africa Downstream Processing Market Revenue Share (%), by Product 2024 & 2032
- Figure 78: Middle East and Africa Downstream Processing Market Volume Share (%), by Product 2024 & 2032
- Figure 79: Middle East and Africa Downstream Processing Market Revenue (Million), by Application 2024 & 2032
- Figure 80: Middle East and Africa Downstream Processing Market Volume (K Unit), by Application 2024 & 2032
- Figure 81: Middle East and Africa Downstream Processing Market Revenue Share (%), by Application 2024 & 2032
- Figure 82: Middle East and Africa Downstream Processing Market Volume Share (%), by Application 2024 & 2032
- Figure 83: Middle East and Africa Downstream Processing Market Revenue (Million), by Country 2024 & 2032
- Figure 84: Middle East and Africa Downstream Processing Market Volume (K Unit), by Country 2024 & 2032
- Figure 85: Middle East and Africa Downstream Processing Market Revenue Share (%), by Country 2024 & 2032
- Figure 86: Middle East and Africa Downstream Processing Market Volume Share (%), by Country 2024 & 2032
- Figure 87: South America Downstream Processing Market Revenue (Million), by Technique 2024 & 2032
- Figure 88: South America Downstream Processing Market Volume (K Unit), by Technique 2024 & 2032
- Figure 89: South America Downstream Processing Market Revenue Share (%), by Technique 2024 & 2032
- Figure 90: South America Downstream Processing Market Volume Share (%), by Technique 2024 & 2032
- Figure 91: South America Downstream Processing Market Revenue (Million), by Product 2024 & 2032
- Figure 92: South America Downstream Processing Market Volume (K Unit), by Product 2024 & 2032
- Figure 93: South America Downstream Processing Market Revenue Share (%), by Product 2024 & 2032
- Figure 94: South America Downstream Processing Market Volume Share (%), by Product 2024 & 2032
- Figure 95: South America Downstream Processing Market Revenue (Million), by Application 2024 & 2032
- Figure 96: South America Downstream Processing Market Volume (K Unit), by Application 2024 & 2032
- Figure 97: South America Downstream Processing Market Revenue Share (%), by Application 2024 & 2032
- Figure 98: South America Downstream Processing Market Volume Share (%), by Application 2024 & 2032
- Figure 99: South America Downstream Processing Market Revenue (Million), by Country 2024 & 2032
- Figure 100: South America Downstream Processing Market Volume (K Unit), by Country 2024 & 2032
- Figure 101: South America Downstream Processing Market Revenue Share (%), by Country 2024 & 2032
- Figure 102: South America Downstream Processing Market Volume Share (%), by Country 2024 & 2032
List of Tables
- Table 1: Global Downstream Processing Market Revenue Million Forecast, by Region 2019 & 2032
- Table 2: Global Downstream Processing Market Volume K Unit Forecast, by Region 2019 & 2032
- Table 3: Global Downstream Processing Market Revenue Million Forecast, by Technique 2019 & 2032
- Table 4: Global Downstream Processing Market Volume K Unit Forecast, by Technique 2019 & 2032
- Table 5: Global Downstream Processing Market Revenue Million Forecast, by Product 2019 & 2032
- Table 6: Global Downstream Processing Market Volume K Unit Forecast, by Product 2019 & 2032
- Table 7: Global Downstream Processing Market Revenue Million Forecast, by Application 2019 & 2032
- Table 8: Global Downstream Processing Market Volume K Unit Forecast, by Application 2019 & 2032
- Table 9: Global Downstream Processing Market Revenue Million Forecast, by Region 2019 & 2032
- Table 10: Global Downstream Processing Market Volume K Unit Forecast, by Region 2019 & 2032
- Table 11: Global Downstream Processing Market Revenue Million Forecast, by Country 2019 & 2032
- Table 12: Global Downstream Processing Market Volume K Unit Forecast, by Country 2019 & 2032
- Table 13: United States Downstream Processing Market Revenue (Million) Forecast, by Application 2019 & 2032
- Table 14: United States Downstream Processing Market Volume (K Unit) Forecast, by Application 2019 & 2032
- Table 15: Canada Downstream Processing Market Revenue (Million) Forecast, by Application 2019 & 2032
- Table 16: Canada Downstream Processing Market Volume (K Unit) Forecast, by Application 2019 & 2032
- Table 17: Mexico Downstream Processing Market Revenue (Million) Forecast, by Application 2019 & 2032
- Table 18: Mexico Downstream Processing Market Volume (K Unit) Forecast, by Application 2019 & 2032
- Table 19: Global Downstream Processing Market Revenue Million Forecast, by Country 2019 & 2032
- Table 20: Global Downstream Processing Market Volume K Unit Forecast, by Country 2019 & 2032
- Table 21: Germany Downstream Processing Market Revenue (Million) Forecast, by Application 2019 & 2032
- Table 22: Germany Downstream Processing Market Volume (K Unit) Forecast, by Application 2019 & 2032
- Table 23: United Kingdom Downstream Processing Market Revenue (Million) Forecast, by Application 2019 & 2032
- Table 24: United Kingdom Downstream Processing Market Volume (K Unit) Forecast, by Application 2019 & 2032
- Table 25: France Downstream Processing Market Revenue (Million) Forecast, by Application 2019 & 2032
- Table 26: France Downstream Processing Market Volume (K Unit) Forecast, by Application 2019 & 2032
- Table 27: Italy Downstream Processing Market Revenue (Million) Forecast, by Application 2019 & 2032
- Table 28: Italy Downstream Processing Market Volume (K Unit) Forecast, by Application 2019 & 2032
- Table 29: Spain Downstream Processing Market Revenue (Million) Forecast, by Application 2019 & 2032
- Table 30: Spain Downstream Processing Market Volume (K Unit) Forecast, by Application 2019 & 2032
- Table 31: Rest of Europe Downstream Processing Market Revenue (Million) Forecast, by Application 2019 & 2032
- Table 32: Rest of Europe Downstream Processing Market Volume (K Unit) Forecast, by Application 2019 & 2032
- Table 33: Global Downstream Processing Market Revenue Million Forecast, by Country 2019 & 2032
- Table 34: Global Downstream Processing Market Volume K Unit Forecast, by Country 2019 & 2032
- Table 35: China Downstream Processing Market Revenue (Million) Forecast, by Application 2019 & 2032
- Table 36: China Downstream Processing Market Volume (K Unit) Forecast, by Application 2019 & 2032
- Table 37: Japan Downstream Processing Market Revenue (Million) Forecast, by Application 2019 & 2032
- Table 38: Japan Downstream Processing Market Volume (K Unit) Forecast, by Application 2019 & 2032
- Table 39: India Downstream Processing Market Revenue (Million) Forecast, by Application 2019 & 2032
- Table 40: India Downstream Processing Market Volume (K Unit) Forecast, by Application 2019 & 2032
- Table 41: Australia Downstream Processing Market Revenue (Million) Forecast, by Application 2019 & 2032
- Table 42: Australia Downstream Processing Market Volume (K Unit) Forecast, by Application 2019 & 2032
- Table 43: South Korea Downstream Processing Market Revenue (Million) Forecast, by Application 2019 & 2032
- Table 44: South Korea Downstream Processing Market Volume (K Unit) Forecast, by Application 2019 & 2032
- Table 45: Rest of Asia Pacific Downstream Processing Market Revenue (Million) Forecast, by Application 2019 & 2032
- Table 46: Rest of Asia Pacific Downstream Processing Market Volume (K Unit) Forecast, by Application 2019 & 2032
- Table 47: Global Downstream Processing Market Revenue Million Forecast, by Country 2019 & 2032
- Table 48: Global Downstream Processing Market Volume K Unit Forecast, by Country 2019 & 2032
- Table 49: GCC Downstream Processing Market Revenue (Million) Forecast, by Application 2019 & 2032
- Table 50: GCC Downstream Processing Market Volume (K Unit) Forecast, by Application 2019 & 2032
- Table 51: South Africa Downstream Processing Market Revenue (Million) Forecast, by Application 2019 & 2032
- Table 52: South Africa Downstream Processing Market Volume (K Unit) Forecast, by Application 2019 & 2032
- Table 53: Rest of Middle East and Africa Downstream Processing Market Revenue (Million) Forecast, by Application 2019 & 2032
- Table 54: Rest of Middle East and Africa Downstream Processing Market Volume (K Unit) Forecast, by Application 2019 & 2032
- Table 55: Global Downstream Processing Market Revenue Million Forecast, by Country 2019 & 2032
- Table 56: Global Downstream Processing Market Volume K Unit Forecast, by Country 2019 & 2032
- Table 57: Brazil Downstream Processing Market Revenue (Million) Forecast, by Application 2019 & 2032
- Table 58: Brazil Downstream Processing Market Volume (K Unit) Forecast, by Application 2019 & 2032
- Table 59: Argentina Downstream Processing Market Revenue (Million) Forecast, by Application 2019 & 2032
- Table 60: Argentina Downstream Processing Market Volume (K Unit) Forecast, by Application 2019 & 2032
- Table 61: Rest of South America Downstream Processing Market Revenue (Million) Forecast, by Application 2019 & 2032
- Table 62: Rest of South America Downstream Processing Market Volume (K Unit) Forecast, by Application 2019 & 2032
- Table 63: Global Downstream Processing Market Revenue Million Forecast, by Technique 2019 & 2032
- Table 64: Global Downstream Processing Market Volume K Unit Forecast, by Technique 2019 & 2032
- Table 65: Global Downstream Processing Market Revenue Million Forecast, by Product 2019 & 2032
- Table 66: Global Downstream Processing Market Volume K Unit Forecast, by Product 2019 & 2032
- Table 67: Global Downstream Processing Market Revenue Million Forecast, by Application 2019 & 2032
- Table 68: Global Downstream Processing Market Volume K Unit Forecast, by Application 2019 & 2032
- Table 69: Global Downstream Processing Market Revenue Million Forecast, by Country 2019 & 2032
- Table 70: Global Downstream Processing Market Volume K Unit Forecast, by Country 2019 & 2032
- Table 71: United States Downstream Processing Market Revenue (Million) Forecast, by Application 2019 & 2032
- Table 72: United States Downstream Processing Market Volume (K Unit) Forecast, by Application 2019 & 2032
- Table 73: Canada Downstream Processing Market Revenue (Million) Forecast, by Application 2019 & 2032
- Table 74: Canada Downstream Processing Market Volume (K Unit) Forecast, by Application 2019 & 2032
- Table 75: Mexico Downstream Processing Market Revenue (Million) Forecast, by Application 2019 & 2032
- Table 76: Mexico Downstream Processing Market Volume (K Unit) Forecast, by Application 2019 & 2032
- Table 77: Global Downstream Processing Market Revenue Million Forecast, by Technique 2019 & 2032
- Table 78: Global Downstream Processing Market Volume K Unit Forecast, by Technique 2019 & 2032
- Table 79: Global Downstream Processing Market Revenue Million Forecast, by Product 2019 & 2032
- Table 80: Global Downstream Processing Market Volume K Unit Forecast, by Product 2019 & 2032
- Table 81: Global Downstream Processing Market Revenue Million Forecast, by Application 2019 & 2032
- Table 82: Global Downstream Processing Market Volume K Unit Forecast, by Application 2019 & 2032
- Table 83: Global Downstream Processing Market Revenue Million Forecast, by Country 2019 & 2032
- Table 84: Global Downstream Processing Market Volume K Unit Forecast, by Country 2019 & 2032
- Table 85: Germany Downstream Processing Market Revenue (Million) Forecast, by Application 2019 & 2032
- Table 86: Germany Downstream Processing Market Volume (K Unit) Forecast, by Application 2019 & 2032
- Table 87: United Kingdom Downstream Processing Market Revenue (Million) Forecast, by Application 2019 & 2032
- Table 88: United Kingdom Downstream Processing Market Volume (K Unit) Forecast, by Application 2019 & 2032
- Table 89: France Downstream Processing Market Revenue (Million) Forecast, by Application 2019 & 2032
- Table 90: France Downstream Processing Market Volume (K Unit) Forecast, by Application 2019 & 2032
- Table 91: Italy Downstream Processing Market Revenue (Million) Forecast, by Application 2019 & 2032
- Table 92: Italy Downstream Processing Market Volume (K Unit) Forecast, by Application 2019 & 2032
- Table 93: Spain Downstream Processing Market Revenue (Million) Forecast, by Application 2019 & 2032
- Table 94: Spain Downstream Processing Market Volume (K Unit) Forecast, by Application 2019 & 2032
- Table 95: Rest of Europe Downstream Processing Market Revenue (Million) Forecast, by Application 2019 & 2032
- Table 96: Rest of Europe Downstream Processing Market Volume (K Unit) Forecast, by Application 2019 & 2032
- Table 97: Global Downstream Processing Market Revenue Million Forecast, by Technique 2019 & 2032
- Table 98: Global Downstream Processing Market Volume K Unit Forecast, by Technique 2019 & 2032
- Table 99: Global Downstream Processing Market Revenue Million Forecast, by Product 2019 & 2032
- Table 100: Global Downstream Processing Market Volume K Unit Forecast, by Product 2019 & 2032
- Table 101: Global Downstream Processing Market Revenue Million Forecast, by Application 2019 & 2032
- Table 102: Global Downstream Processing Market Volume K Unit Forecast, by Application 2019 & 2032
- Table 103: Global Downstream Processing Market Revenue Million Forecast, by Country 2019 & 2032
- Table 104: Global Downstream Processing Market Volume K Unit Forecast, by Country 2019 & 2032
- Table 105: China Downstream Processing Market Revenue (Million) Forecast, by Application 2019 & 2032
- Table 106: China Downstream Processing Market Volume (K Unit) Forecast, by Application 2019 & 2032
- Table 107: Japan Downstream Processing Market Revenue (Million) Forecast, by Application 2019 & 2032
- Table 108: Japan Downstream Processing Market Volume (K Unit) Forecast, by Application 2019 & 2032
- Table 109: India Downstream Processing Market Revenue (Million) Forecast, by Application 2019 & 2032
- Table 110: India Downstream Processing Market Volume (K Unit) Forecast, by Application 2019 & 2032
- Table 111: Australia Downstream Processing Market Revenue (Million) Forecast, by Application 2019 & 2032
- Table 112: Australia Downstream Processing Market Volume (K Unit) Forecast, by Application 2019 & 2032
- Table 113: South Korea Downstream Processing Market Revenue (Million) Forecast, by Application 2019 & 2032
- Table 114: South Korea Downstream Processing Market Volume (K Unit) Forecast, by Application 2019 & 2032
- Table 115: Rest of Asia Pacific Downstream Processing Market Revenue (Million) Forecast, by Application 2019 & 2032
- Table 116: Rest of Asia Pacific Downstream Processing Market Volume (K Unit) Forecast, by Application 2019 & 2032
- Table 117: Global Downstream Processing Market Revenue Million Forecast, by Technique 2019 & 2032
- Table 118: Global Downstream Processing Market Volume K Unit Forecast, by Technique 2019 & 2032
- Table 119: Global Downstream Processing Market Revenue Million Forecast, by Product 2019 & 2032
- Table 120: Global Downstream Processing Market Volume K Unit Forecast, by Product 2019 & 2032
- Table 121: Global Downstream Processing Market Revenue Million Forecast, by Application 2019 & 2032
- Table 122: Global Downstream Processing Market Volume K Unit Forecast, by Application 2019 & 2032
- Table 123: Global Downstream Processing Market Revenue Million Forecast, by Country 2019 & 2032
- Table 124: Global Downstream Processing Market Volume K Unit Forecast, by Country 2019 & 2032
- Table 125: GCC Downstream Processing Market Revenue (Million) Forecast, by Application 2019 & 2032
- Table 126: GCC Downstream Processing Market Volume (K Unit) Forecast, by Application 2019 & 2032
- Table 127: South Africa Downstream Processing Market Revenue (Million) Forecast, by Application 2019 & 2032
- Table 128: South Africa Downstream Processing Market Volume (K Unit) Forecast, by Application 2019 & 2032
- Table 129: Rest of Middle East and Africa Downstream Processing Market Revenue (Million) Forecast, by Application 2019 & 2032
- Table 130: Rest of Middle East and Africa Downstream Processing Market Volume (K Unit) Forecast, by Application 2019 & 2032
- Table 131: Global Downstream Processing Market Revenue Million Forecast, by Technique 2019 & 2032
- Table 132: Global Downstream Processing Market Volume K Unit Forecast, by Technique 2019 & 2032
- Table 133: Global Downstream Processing Market Revenue Million Forecast, by Product 2019 & 2032
- Table 134: Global Downstream Processing Market Volume K Unit Forecast, by Product 2019 & 2032
- Table 135: Global Downstream Processing Market Revenue Million Forecast, by Application 2019 & 2032
- Table 136: Global Downstream Processing Market Volume K Unit Forecast, by Application 2019 & 2032
- Table 137: Global Downstream Processing Market Revenue Million Forecast, by Country 2019 & 2032
- Table 138: Global Downstream Processing Market Volume K Unit Forecast, by Country 2019 & 2032
- Table 139: Brazil Downstream Processing Market Revenue (Million) Forecast, by Application 2019 & 2032
- Table 140: Brazil Downstream Processing Market Volume (K Unit) Forecast, by Application 2019 & 2032
- Table 141: Argentina Downstream Processing Market Revenue (Million) Forecast, by Application 2019 & 2032
- Table 142: Argentina Downstream Processing Market Volume (K Unit) Forecast, by Application 2019 & 2032
- Table 143: Rest of South America Downstream Processing Market Revenue (Million) Forecast, by Application 2019 & 2032
- Table 144: Rest of South America Downstream Processing Market Volume (K Unit) Forecast, by Application 2019 & 2032
Frequently Asked Questions
1. What is the projected Compound Annual Growth Rate (CAGR) of the Downstream Processing Market?
The projected CAGR is approximately 13.80%.
2. Which companies are prominent players in the Downstream Processing Market?
Key companies in the market include GE Healthcare, Danaher Corporation (Cytiva), Thermo Fisher Scientific Inc, Eppendorf AG, Lonza Group AG, 3M Company, Repligen Corporation, Sartorius Stedim Biotech S A, Merck KGaA (Merck Millipore).
3. What are the main segments of the Downstream Processing Market?
The market segments include Technique, Product, Application.
4. Can you provide details about the market size?
The market size is estimated to be USD XX Million as of 2022.
5. What are some drivers contributing to market growth?
Growth of Biotechnology Sector Globally; Rising R&D Expenditure in Biopharmaceutical Companies; Increase in the Prominence of Contract Manufacturing Organizations.
6. What are the notable trends driving market growth?
Antibodies Production is Expected to Dominate the Downstream Processing Market During the Forecast Period.
7. Are there any restraints impacting market growth?
High Cost of Instruments; Purification Bottleneck.
8. Can you provide examples of recent developments in the market?
In June 2022, Merck collaborated with Agilent Technologies to reduce the industry gap in process analytical technologies (PAT) for downstream processing. Under the collaboration, the companies combine Merck's bioprocess portfolio with Agilent Technologies' advanced analytical products to extend real-time monitoring and automated process control of critical process parameters (CPPs) and critical quality attributes (CQAs) in downstream processing (DSP).
9. What pricing options are available for accessing the report?
Pricing options include single-user, multi-user, and enterprise licenses priced at USD 4750, USD 5250, and USD 8750 respectively.
10. Is the market size provided in terms of value or volume?
The market size is provided in terms of value, measured in Million and volume, measured in K Unit.
11. Are there any specific market keywords associated with the report?
Yes, the market keyword associated with the report is "Downstream Processing Market," which aids in identifying and referencing the specific market segment covered.
12. How do I determine which pricing option suits my needs best?
The pricing options vary based on user requirements and access needs. Individual users may opt for single-user licenses, while businesses requiring broader access may choose multi-user or enterprise licenses for cost-effective access to the report.
13. Are there any additional resources or data provided in the Downstream Processing Market report?
While the report offers comprehensive insights, it's advisable to review the specific contents or supplementary materials provided to ascertain if additional resources or data are available.
14. How can I stay updated on further developments or reports in the Downstream Processing Market?
To stay informed about further developments, trends, and reports in the Downstream Processing Market, consider subscribing to industry newsletters, following relevant companies and organizations, or regularly checking reputable industry news sources and publications.
Methodology
Step 1 - Identification of Relevant Samples Size from Population Database


Step 2 - Approaches for Defining Global Market Size (Value, Volume* & Price*)

Note*: In applicable scenarios
Step 3 - Data Sources
Primary Research
- Web Analytics
- Survey Reports
- Research Institute
- Latest Research Reports
- Opinion Leaders
Secondary Research
- Annual Reports
- White Paper
- Latest Press Release
- Industry Association
- Paid Database
- Investor Presentations

Step 4 - Data Triangulation
Involves using different sources of information in order to increase the validity of a study
These sources are likely to be stakeholders in a program - participants, other researchers, program staff, other community members, and so on.
Then we put all data in single framework & apply various statistical tools to find out the dynamic on the market.
During the analysis stage, feedback from the stakeholder groups would be compared to determine areas of agreement as well as areas of divergence
