

Key Insights
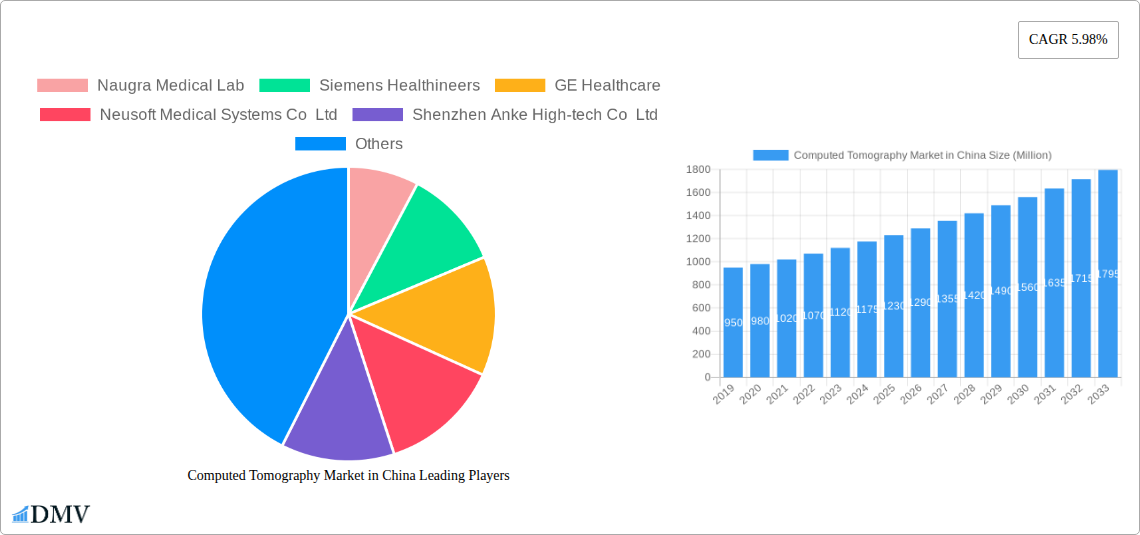
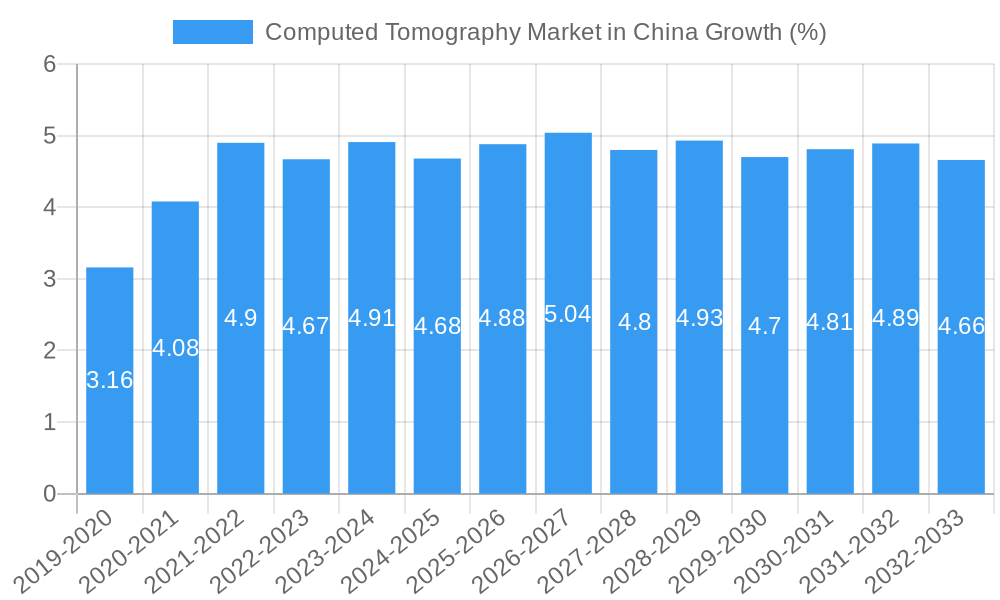
The global Computed Tomography (CT) market is poised for significant expansion, estimated at USD 1.34 billion with a robust Compound Annual Growth Rate (CAGR) of 5.98%. This growth is propelled by a confluence of factors, notably advancements in imaging technology, increasing adoption of low-slice and medium-slice CT scanners for routine diagnostics, and a growing demand for high-slice CT systems in specialized applications like oncology and neurology. The escalating burden of chronic diseases, including cardiovascular and musculoskeletal conditions, further fuels the need for advanced diagnostic imaging solutions. Furthermore, the expanding healthcare infrastructure, particularly in emerging economies, coupled with a greater emphasis on early disease detection and personalized medicine, is expected to underpin market expansion. Major market players like Siemens Healthineers, GE Healthcare, and Koninklijke Philips NV are continuously innovating, introducing more efficient and precise CT systems, contributing to the market's upward trajectory.
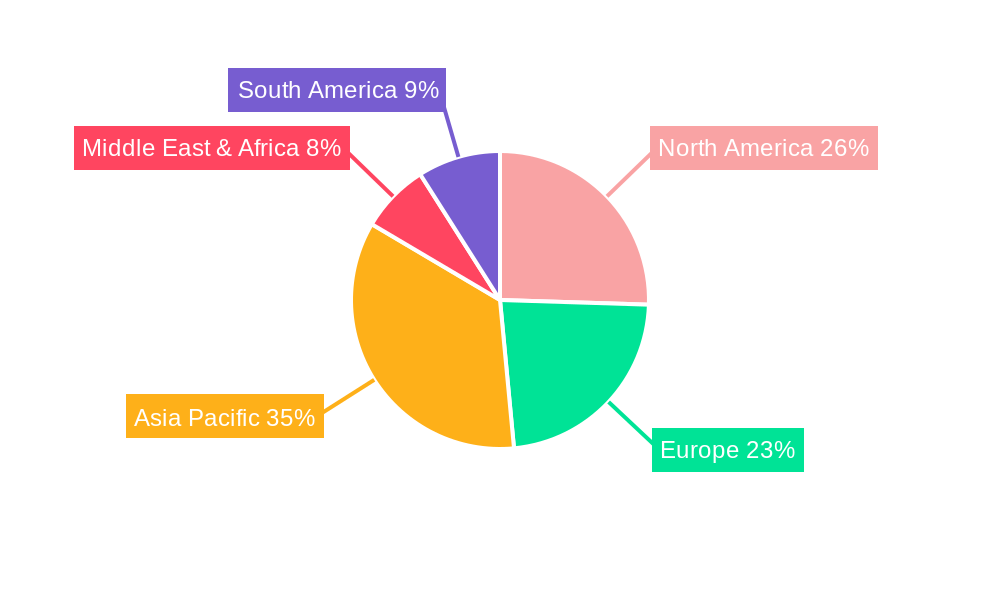
Geographically, the Asia Pacific region is anticipated to emerge as a key growth engine, driven by rising healthcare expenditure, an increasing number of diagnostic centers, and a growing awareness of the benefits of CT imaging. China, in particular, represents a substantial opportunity within this segment, with its vast population, expanding middle class, and ongoing efforts to modernize its healthcare system. While the market is energized by these drivers, challenges such as the high initial cost of CT equipment, stringent regulatory frameworks in certain regions, and the availability of alternative imaging modalities like MRI and ultrasound, present potential restraints. However, the sustained innovation in CT technology, including the development of dual-energy CT and photon-counting CT, alongside the increasing integration of AI for enhanced image analysis and workflow optimization, is expected to mitigate these challenges and sustain the market's positive growth outlook throughout the forecast period of 2025-2033.
Unlock deep insights into China's burgeoning Computed Tomography (CT) market with this definitive report. Spanning the historical period of 2019-2024 and projecting growth through 2033, this analysis delivers actionable intelligence for stakeholders navigating this dynamic landscape. Delve into market composition, industry evolution, regional dominance, product innovations, growth drivers, obstacles, and future opportunities within China's leading medical imaging sector.
Computed Tomography Market in China Market Composition & Trends
The Chinese Computed Tomography (CT) market is characterized by a dynamic and evolving landscape, driven by robust technological advancements, increasing healthcare infrastructure development, and a growing demand for advanced diagnostic imaging solutions. Market concentration is moderately high, with key global players and emerging domestic manufacturers vying for market share. Innovation is a primary catalyst, fueled by substantial R&D investments aimed at developing higher resolution, faster scanning, and lower radiation dose CT systems. The regulatory environment, while becoming more structured, still presents complexities, influencing market entry and product approvals. Substitute products, primarily MRI and ultrasound, offer alternatives for certain diagnostic needs, but CT's versatility in emergency care and detailed anatomical visualization ensures its continued relevance. End-user profiles are diverse, with hospitals forming the largest segment due to their comprehensive diagnostic and treatment capabilities, followed by specialized diagnostic centers. Mergers and acquisitions (M&A) activities are on the rise, as both international and domestic companies seek to consolidate their market position, expand their product portfolios, and gain access to China's vast patient base. M&A deal values are expected to grow as strategic alliances become more critical for competitive advantage. For instance, the market share distribution sees a significant portion held by leading players such as Siemens Healthineers, GE Healthcare, and Canon Medical Systems Corporation, alongside rapidly growing Chinese companies like Neusoft Medical Systems Co Ltd and Shenzhen Anke High-tech Co Ltd.
- Market Concentration: Moderately high, with a mix of global giants and strong domestic contenders.
- Innovation Catalysts: Significant R&D expenditure, demand for AI-powered CT, and advancements in detector technology.
- Regulatory Landscapes: Evolving policies, with increased emphasis on domestic production and quality standards.
- Substitute Products: MRI, Ultrasound, X-ray – limited in comprehensive trauma and acute care scenarios.
- End-User Profiles: Predominantly hospitals, followed by dedicated diagnostic imaging centers.
- M&A Activities: Increasing, driven by market consolidation and expansion strategies.
Computed Tomography Market in China Industry Evolution
The Computed Tomography (CT) market in China has witnessed a remarkable evolution, transforming from a nascent sector to a powerhouse in global medical imaging. Over the historical period of 2019-2024, the market has experienced consistent and robust growth, largely propelled by an accelerating healthcare reform agenda, surging investments in medical infrastructure, and a burgeoning middle class with increased access to healthcare services. The trajectory has been one of rapid adoption of advanced CT technologies, driven by the need for more accurate and efficient disease diagnosis and treatment. Technological advancements have been central to this evolution. Early adoption of multi-slice CT scanners (from 16-slice to 64-slice and beyond) paved the way for high-slice CT systems (e.g., 256-slice, 320-slice, and even 1024-slice technologies) that offer superior spatial resolution, faster scan times, and reduced radiation exposure, crucial for pediatric and interventional procedures. The integration of Artificial Intelligence (AI) and machine learning into CT imaging workflows has further revolutionized the market, enabling enhanced image reconstruction, automated lesion detection, and predictive diagnostics, thereby improving diagnostic accuracy and operational efficiency.
Shifting consumer demands, influenced by greater health awareness and the desire for early disease detection, have also played a pivotal role. The rising incidence of chronic diseases, particularly in oncology, neurology, and cardiovascular fields, has fueled the demand for advanced CT imaging. The government's strategic focus on improving healthcare accessibility, especially in rural and lower-tier cities, has led to increased procurement of CT equipment by public hospitals and the establishment of new diagnostic centers. This expansion in infrastructure has created a substantial market for both high-end, sophisticated CT scanners and more affordable, basic models. The COVID-19 pandemic, while disruptive initially, also underscored the critical importance of CT in diagnosing and monitoring respiratory illnesses, further accelerating its adoption and innovation in chest CT applications. Furthermore, the government's policies supporting domestic manufacturing and innovation have fostered the growth of local players like Neusoft Medical Systems and Shenzhen Anke High-tech, who are increasingly competing with international giants like Siemens Healthineers, GE Healthcare, and Canon Medical Systems. This competitive dynamism has spurred price competitiveness and accelerated the pace of technological integration, benefiting end-users. The overall market growth rate has been consistently in the double digits, with projections indicating continued strong expansion driven by technological upgrades, an aging population, and the ongoing expansion of healthcare networks across China. Adoption metrics for advanced CT technologies, such as dual-energy and photon-counting CT, are expected to rise significantly in the forecast period, indicating a continuous drive towards cutting-edge diagnostic capabilities.
Leading Regions, Countries, or Segments in Computed Tomography Market in China
Within the expansive Computed Tomography (CT) market in China, several key segments and regions stand out due to their significant market share, rapid growth, and the underlying drivers of their dominance. At the segment level, the Hospitals end-user category holds a commanding position. This dominance is attributed to several intertwined factors:
- Primary Healthcare Hubs: Hospitals are the primary points of access for a vast majority of the Chinese population, serving as centers for diagnosis, treatment, and emergency care. Their comprehensive nature necessitates a wide range of imaging modalities, with CT being indispensable for a multitude of applications.
- Infrastructure and Investment: Government initiatives focused on upgrading public hospital infrastructure and expanding healthcare services have led to substantial investments in advanced medical equipment, including high-end CT scanners. Lower-tier cities, in particular, are seeing accelerated development, boosting CT procurement.
- Specialized Applications: The increasing prevalence of chronic diseases and the growing demand for specialized medical interventions (e.g., interventional radiology, oncology treatment planning) mandate the use of sophisticated CT systems, which are predominantly housed within hospital settings.
Examining the application segments, Oncology emerges as a major driver for CT market growth. This is fueled by:
- High Incidence and Mortality: Cancer remains a significant public health concern in China, driving a continuous need for accurate diagnosis, staging, treatment planning, and follow-up imaging.
- Technological Advancements: CT's role in detecting and characterizing tumors, monitoring treatment response (e.g., chemotherapy, radiation therapy), and guiding biopsies is paramount. Innovations in CT, such as functional imaging and AI-assisted lesion detection, are particularly impactful in oncology.
- Early Detection Programs: Increased focus on early cancer screening programs further bolsters the demand for CT.
In terms of Type, High Slice CT scanners represent a significant and growing segment. The drivers behind this include:
- Diagnostic Accuracy: High-slice CT offers superior resolution and faster scan times, enabling more precise visualization of anatomical structures and pathologies, which is critical for complex diagnoses.
- Reduced Radiation Dose: Advanced reconstruction algorithms and detector technologies in high-slice systems help to minimize patient radiation exposure, a growing concern for both clinicians and patients, especially in repeated scanning scenarios.
- Expanding Applications: The capabilities of high-slice CT are crucial for intricate procedures like cardiovascular imaging (CT angiography), neurological assessments, and interventional radiology.
Geographically, while detailed regional data for the entire country is extensive, it is widely acknowledged that the Eastern and Southern coastal regions of China (e.g., Beijing, Shanghai, Guangdong) represent the most mature and lucrative markets for CT equipment. These regions typically exhibit:
- Higher Disposable Income and Healthcare Spending: Leading to greater demand for advanced medical services and equipment.
- Concentration of Top-Tier Hospitals and Research Institutions: These facilities are early adopters of cutting-edge technologies and drive demand for high-performance CT systems.
- Strong Presence of Global and Domestic Manufacturers: A well-established ecosystem of sales, service, and support networks.
However, the government's push for equitable healthcare access is rapidly elevating the importance of lower-tier cities and inland provinces. This is driven by:
- Governmental Investment and Policy Support: Initiatives aimed at bridging the healthcare gap are leading to substantial infrastructure development and equipment procurement in these regions.
- Large Population Base: These areas represent a significant portion of the Chinese population, presenting immense untapped market potential.
- Emergence of Regional Medical Hubs: Development of regional medical centers is creating demand for advanced diagnostic capabilities.
The Medium Slice segment continues to hold a substantial market share due to its balance of cost-effectiveness and diagnostic capability, making it a popular choice for general diagnostic purposes across a wide range of healthcare facilities. The Neurology and Cardiovascular application segments are also experiencing robust growth due to an aging population and lifestyle-related disease burdens.
Computed Tomography Market in China Product Innovations
The Chinese CT market is a hotbed of product innovation, consistently pushing the boundaries of diagnostic imaging. Key advancements include the widespread adoption of AI-powered CT systems that offer enhanced image reconstruction, automated lesion detection, and dose reduction technologies. Systems are increasingly incorporating photon-counting detector technology, promising unparalleled spectral information and ultra-low dose imaging for more precise diagnostics in oncology and cardiology. Furthermore, the development of mobile and point-of-care CT solutions is expanding access to advanced imaging, particularly in remote areas and emergency settings. The integration of CT with other modalities, such as PET-CT, is also gaining traction for comprehensive oncological assessments. These innovations translate to improved patient outcomes through earlier and more accurate diagnoses, reduced radiation exposure, and more efficient clinical workflows.
Propelling Factors for Computed Tomography Market in China Growth
Several critical factors are propelling the growth of the Computed Tomography (CT) market in China. Firstly, the government's unwavering commitment to modernizing its healthcare infrastructure and improving access to quality medical services, particularly in underserved regions, is a significant driver. This is evidenced by substantial investments in public hospitals and diagnostic centers, leading to increased procurement of advanced medical imaging equipment like CT scanners. Secondly, the escalating burden of chronic diseases, including cancer, cardiovascular ailments, and neurological disorders, necessitates sophisticated diagnostic tools, with CT playing a pivotal role in early detection, diagnosis, and treatment monitoring. Thirdly, continuous technological advancements, such as AI integration, dual-energy CT, and photon-counting detectors, are enhancing diagnostic accuracy, reducing radiation doses, and improving workflow efficiency, thereby stimulating demand for newer, more advanced CT systems. The growing disposable income and rising health consciousness among the Chinese population are also contributing factors, as individuals increasingly seek early and accurate diagnoses.
Obstacles in the Computed Tomography Market in China Market
Despite its robust growth, the Computed Tomography (CT) market in China faces several obstacles. Regulatory hurdles and lengthy approval processes for new medical devices can delay market entry and adoption of innovative technologies. Intense competition, both from established global players and rapidly emerging domestic manufacturers, can lead to price pressures and reduced profit margins for some segments. Supply chain disruptions, particularly in the context of global geopolitical uncertainties and raw material availability, can impact production schedules and component costs. Furthermore, the high cost of advanced CT systems can be a barrier to adoption for smaller healthcare facilities or those in less economically developed regions, despite government subsidies. Finally, a shortage of highly skilled CT technologists and radiologists capable of operating and interpreting complex CT scans can limit the full utilization of advanced equipment in certain areas.
Future Opportunities in Computed Tomography Market in China
The future for the Computed Tomography (CT) market in China is replete with significant opportunities. The ongoing push for healthcare democratization, especially in lower-tier cities and rural areas, presents a vast untapped market for both basic and advanced CT systems. The increasing focus on preventative healthcare and early disease screening will continue to drive demand for CT, particularly in oncology and cardiovascular imaging. The rapid advancements in Artificial Intelligence (AI) and machine learning are creating opportunities for AI-powered CT solutions that offer enhanced diagnostic capabilities, workflow optimization, and personalized medicine approaches. Furthermore, the development and adoption of next-generation CT technologies such as photon-counting detectors and spectral imaging will open new avenues for specialized diagnostics and research. The growing aging population in China will also continue to fuel demand for CT services for age-related conditions.
Major Players in the Computed Tomography Market in China Ecosystem
- Naugra Medical Lab
- Siemens Healthineers
- GE Healthcare
- Neusoft Medical Systems Co Ltd
- Shenzhen Anke High-tech Co Ltd
- Koninklijke Philips NV
- Canon Medical Systems Corporation
- MinFound Medical Systems Co Ltd
- Planmed Oy
- Fujifilm Holdings Corporation
Key Developments in Computed Tomography Market in China Industry
- March 2023: Elekta launched a cooperative venture with China National Pharmaceutical Group Co., Ltd. (Sinopharm) to expand the use of radiation therapy in so-called lower-tier cities, where around 70% of the population lives. This initiative, while focused on radiation therapy, indicates a broader trend of strengthening healthcare infrastructure and technology adoption in less developed regions, which indirectly benefits the CT market through increased demand for diagnostic imaging support.
- February 2022: Siemens Healthineers and Universal Medical Imaging made an agreement to promote 5G remote imaging diagnosis for primary care in China's regions. This development highlights the growing importance of connectivity and tele-radiology, enabling wider access to expert diagnoses and expanding the reach of advanced imaging technologies like CT, even in remote primary care settings.
Strategic Computed Tomography Market in China Market Forecast
The strategic outlook for the Computed Tomography (CT) market in China is overwhelmingly positive, with a forecast for sustained and robust growth driven by a confluence of strategic initiatives and market forces. The government's continued commitment to expanding healthcare infrastructure, particularly in underserved regions, will fuel substantial demand for CT equipment. The increasing burden of chronic diseases, coupled with a heightened focus on early detection and personalized medicine, will solidify CT's indispensable role in diagnostics. Technological innovation, spearheaded by AI integration and the adoption of advanced detector technologies, will create new market segments and drive upgrades of existing systems. Furthermore, the growing disposable income and health awareness among the Chinese populace will translate into higher healthcare spending and greater utilization of advanced diagnostic imaging services. The market is poised for significant expansion, with particular opportunities in high-slice CT, AI-enhanced solutions, and the development of more accessible CT technologies for primary care settings.
Computed Tomography Market in China Segmentation
-
1. Type
- 1.1. Low Slice
- 1.2. Medium Slice
- 1.3. High Slice
-
2. Application
- 2.1. Oncology
- 2.2. Neurology
- 2.3. Cardiovascular
- 2.4. Musculoskeletal
- 2.5. Other Applications
-
3. End User
- 3.1. Hospitals
- 3.2. Diagnostic Centers
- 3.3. Other End Users
Computed Tomography Market in China Segmentation By Geography
-
1. North America
- 1.1. United States
- 1.2. Canada
- 1.3. Mexico
-
2. South America
- 2.1. Brazil
- 2.2. Argentina
- 2.3. Rest of South America
-
3. Europe
- 3.1. United Kingdom
- 3.2. Germany
- 3.3. France
- 3.4. Italy
- 3.5. Spain
- 3.6. Russia
- 3.7. Benelux
- 3.8. Nordics
- 3.9. Rest of Europe
-
4. Middle East & Africa
- 4.1. Turkey
- 4.2. Israel
- 4.3. GCC
- 4.4. North Africa
- 4.5. South Africa
- 4.6. Rest of Middle East & Africa
-
5. Asia Pacific
- 5.1. China
- 5.2. India
- 5.3. Japan
- 5.4. South Korea
- 5.5. ASEAN
- 5.6. Oceania
- 5.7. Rest of Asia Pacific
Computed Tomography Market in China REPORT HIGHLIGHTS
| Aspects | Details |
|---|---|
| Study Period | 2019-2033 |
| Base Year | 2024 |
| Estimated Year | 2025 |
| Forecast Period | 2025-2033 |
| Historical Period | 2019-2024 |
| Growth Rate | CAGR of 5.98% from 2019-2033 |
| Segmentation |
|
Table of Contents
- 1. Introduction
- 1.1. Research Scope
- 1.2. Market Segmentation
- 1.3. Research Methodology
- 1.4. Definitions and Assumptions
- 2. Executive Summary
- 2.1. Introduction
- 3. Market Dynamics
- 3.1. Introduction
- 3.2. Market Drivers
- 3.2.1. Increasing Geriatric Population and Chronic Disease Burden; Technological Advancements in Computed Tomography
- 3.3. Market Restrains
- 3.3.1. High Cost Associated With CT Scan Procedure and Equipment
- 3.4. Market Trends
- 3.4.1. Diagnostic Centers to Hold Significant Share in End-User Segment Over the Forecast Period
- 4. Market Factor Analysis
- 4.1. Porters Five Forces
- 4.2. Supply/Value Chain
- 4.3. PESTEL analysis
- 4.4. Market Entropy
- 4.5. Patent/Trademark Analysis
- 5. Global Computed Tomography Market in China Analysis, Insights and Forecast, 2019-2031
- 5.1. Market Analysis, Insights and Forecast - by Type
- 5.1.1. Low Slice
- 5.1.2. Medium Slice
- 5.1.3. High Slice
- 5.2. Market Analysis, Insights and Forecast - by Application
- 5.2.1. Oncology
- 5.2.2. Neurology
- 5.2.3. Cardiovascular
- 5.2.4. Musculoskeletal
- 5.2.5. Other Applications
- 5.3. Market Analysis, Insights and Forecast - by End User
- 5.3.1. Hospitals
- 5.3.2. Diagnostic Centers
- 5.3.3. Other End Users
- 5.4. Market Analysis, Insights and Forecast - by Region
- 5.4.1. North America
- 5.4.2. South America
- 5.4.3. Europe
- 5.4.4. Middle East & Africa
- 5.4.5. Asia Pacific
- 5.1. Market Analysis, Insights and Forecast - by Type
- 6. North America Computed Tomography Market in China Analysis, Insights and Forecast, 2019-2031
- 6.1. Market Analysis, Insights and Forecast - by Type
- 6.1.1. Low Slice
- 6.1.2. Medium Slice
- 6.1.3. High Slice
- 6.2. Market Analysis, Insights and Forecast - by Application
- 6.2.1. Oncology
- 6.2.2. Neurology
- 6.2.3. Cardiovascular
- 6.2.4. Musculoskeletal
- 6.2.5. Other Applications
- 6.3. Market Analysis, Insights and Forecast - by End User
- 6.3.1. Hospitals
- 6.3.2. Diagnostic Centers
- 6.3.3. Other End Users
- 6.1. Market Analysis, Insights and Forecast - by Type
- 7. South America Computed Tomography Market in China Analysis, Insights and Forecast, 2019-2031
- 7.1. Market Analysis, Insights and Forecast - by Type
- 7.1.1. Low Slice
- 7.1.2. Medium Slice
- 7.1.3. High Slice
- 7.2. Market Analysis, Insights and Forecast - by Application
- 7.2.1. Oncology
- 7.2.2. Neurology
- 7.2.3. Cardiovascular
- 7.2.4. Musculoskeletal
- 7.2.5. Other Applications
- 7.3. Market Analysis, Insights and Forecast - by End User
- 7.3.1. Hospitals
- 7.3.2. Diagnostic Centers
- 7.3.3. Other End Users
- 7.1. Market Analysis, Insights and Forecast - by Type
- 8. Europe Computed Tomography Market in China Analysis, Insights and Forecast, 2019-2031
- 8.1. Market Analysis, Insights and Forecast - by Type
- 8.1.1. Low Slice
- 8.1.2. Medium Slice
- 8.1.3. High Slice
- 8.2. Market Analysis, Insights and Forecast - by Application
- 8.2.1. Oncology
- 8.2.2. Neurology
- 8.2.3. Cardiovascular
- 8.2.4. Musculoskeletal
- 8.2.5. Other Applications
- 8.3. Market Analysis, Insights and Forecast - by End User
- 8.3.1. Hospitals
- 8.3.2. Diagnostic Centers
- 8.3.3. Other End Users
- 8.1. Market Analysis, Insights and Forecast - by Type
- 9. Middle East & Africa Computed Tomography Market in China Analysis, Insights and Forecast, 2019-2031
- 9.1. Market Analysis, Insights and Forecast - by Type
- 9.1.1. Low Slice
- 9.1.2. Medium Slice
- 9.1.3. High Slice
- 9.2. Market Analysis, Insights and Forecast - by Application
- 9.2.1. Oncology
- 9.2.2. Neurology
- 9.2.3. Cardiovascular
- 9.2.4. Musculoskeletal
- 9.2.5. Other Applications
- 9.3. Market Analysis, Insights and Forecast - by End User
- 9.3.1. Hospitals
- 9.3.2. Diagnostic Centers
- 9.3.3. Other End Users
- 9.1. Market Analysis, Insights and Forecast - by Type
- 10. Asia Pacific Computed Tomography Market in China Analysis, Insights and Forecast, 2019-2031
- 10.1. Market Analysis, Insights and Forecast - by Type
- 10.1.1. Low Slice
- 10.1.2. Medium Slice
- 10.1.3. High Slice
- 10.2. Market Analysis, Insights and Forecast - by Application
- 10.2.1. Oncology
- 10.2.2. Neurology
- 10.2.3. Cardiovascular
- 10.2.4. Musculoskeletal
- 10.2.5. Other Applications
- 10.3. Market Analysis, Insights and Forecast - by End User
- 10.3.1. Hospitals
- 10.3.2. Diagnostic Centers
- 10.3.3. Other End Users
- 10.1. Market Analysis, Insights and Forecast - by Type
- 11. Competitive Analysis
- 11.1. Global Market Share Analysis 2024
- 11.2. Company Profiles
- 11.2.1 Naugra Medical Lab
- 11.2.1.1. Overview
- 11.2.1.2. Products
- 11.2.1.3. SWOT Analysis
- 11.2.1.4. Recent Developments
- 11.2.1.5. Financials (Based on Availability)
- 11.2.2 Siemens Healthineers
- 11.2.2.1. Overview
- 11.2.2.2. Products
- 11.2.2.3. SWOT Analysis
- 11.2.2.4. Recent Developments
- 11.2.2.5. Financials (Based on Availability)
- 11.2.3 GE Healthcare
- 11.2.3.1. Overview
- 11.2.3.2. Products
- 11.2.3.3. SWOT Analysis
- 11.2.3.4. Recent Developments
- 11.2.3.5. Financials (Based on Availability)
- 11.2.4 Neusoft Medical Systems Co Ltd
- 11.2.4.1. Overview
- 11.2.4.2. Products
- 11.2.4.3. SWOT Analysis
- 11.2.4.4. Recent Developments
- 11.2.4.5. Financials (Based on Availability)
- 11.2.5 Shenzhen Anke High-tech Co Ltd
- 11.2.5.1. Overview
- 11.2.5.2. Products
- 11.2.5.3. SWOT Analysis
- 11.2.5.4. Recent Developments
- 11.2.5.5. Financials (Based on Availability)
- 11.2.6 Koninklijke Philips NV
- 11.2.6.1. Overview
- 11.2.6.2. Products
- 11.2.6.3. SWOT Analysis
- 11.2.6.4. Recent Developments
- 11.2.6.5. Financials (Based on Availability)
- 11.2.7 Canon Medical Systems Corporation
- 11.2.7.1. Overview
- 11.2.7.2. Products
- 11.2.7.3. SWOT Analysis
- 11.2.7.4. Recent Developments
- 11.2.7.5. Financials (Based on Availability)
- 11.2.8 MinFound Medical Systems Co Ltd
- 11.2.8.1. Overview
- 11.2.8.2. Products
- 11.2.8.3. SWOT Analysis
- 11.2.8.4. Recent Developments
- 11.2.8.5. Financials (Based on Availability)
- 11.2.9 Planmed Oy
- 11.2.9.1. Overview
- 11.2.9.2. Products
- 11.2.9.3. SWOT Analysis
- 11.2.9.4. Recent Developments
- 11.2.9.5. Financials (Based on Availability)
- 11.2.10 Fujifilm Holdings Corporation
- 11.2.10.1. Overview
- 11.2.10.2. Products
- 11.2.10.3. SWOT Analysis
- 11.2.10.4. Recent Developments
- 11.2.10.5. Financials (Based on Availability)
- 11.2.1 Naugra Medical Lab
List of Figures
- Figure 1: Global Computed Tomography Market in China Revenue Breakdown (Million, %) by Region 2024 & 2032
- Figure 2: China Computed Tomography Market in China Revenue (Million), by Country 2024 & 2032
- Figure 3: China Computed Tomography Market in China Revenue Share (%), by Country 2024 & 2032
- Figure 4: North America Computed Tomography Market in China Revenue (Million), by Type 2024 & 2032
- Figure 5: North America Computed Tomography Market in China Revenue Share (%), by Type 2024 & 2032
- Figure 6: North America Computed Tomography Market in China Revenue (Million), by Application 2024 & 2032
- Figure 7: North America Computed Tomography Market in China Revenue Share (%), by Application 2024 & 2032
- Figure 8: North America Computed Tomography Market in China Revenue (Million), by End User 2024 & 2032
- Figure 9: North America Computed Tomography Market in China Revenue Share (%), by End User 2024 & 2032
- Figure 10: North America Computed Tomography Market in China Revenue (Million), by Country 2024 & 2032
- Figure 11: North America Computed Tomography Market in China Revenue Share (%), by Country 2024 & 2032
- Figure 12: South America Computed Tomography Market in China Revenue (Million), by Type 2024 & 2032
- Figure 13: South America Computed Tomography Market in China Revenue Share (%), by Type 2024 & 2032
- Figure 14: South America Computed Tomography Market in China Revenue (Million), by Application 2024 & 2032
- Figure 15: South America Computed Tomography Market in China Revenue Share (%), by Application 2024 & 2032
- Figure 16: South America Computed Tomography Market in China Revenue (Million), by End User 2024 & 2032
- Figure 17: South America Computed Tomography Market in China Revenue Share (%), by End User 2024 & 2032
- Figure 18: South America Computed Tomography Market in China Revenue (Million), by Country 2024 & 2032
- Figure 19: South America Computed Tomography Market in China Revenue Share (%), by Country 2024 & 2032
- Figure 20: Europe Computed Tomography Market in China Revenue (Million), by Type 2024 & 2032
- Figure 21: Europe Computed Tomography Market in China Revenue Share (%), by Type 2024 & 2032
- Figure 22: Europe Computed Tomography Market in China Revenue (Million), by Application 2024 & 2032
- Figure 23: Europe Computed Tomography Market in China Revenue Share (%), by Application 2024 & 2032
- Figure 24: Europe Computed Tomography Market in China Revenue (Million), by End User 2024 & 2032
- Figure 25: Europe Computed Tomography Market in China Revenue Share (%), by End User 2024 & 2032
- Figure 26: Europe Computed Tomography Market in China Revenue (Million), by Country 2024 & 2032
- Figure 27: Europe Computed Tomography Market in China Revenue Share (%), by Country 2024 & 2032
- Figure 28: Middle East & Africa Computed Tomography Market in China Revenue (Million), by Type 2024 & 2032
- Figure 29: Middle East & Africa Computed Tomography Market in China Revenue Share (%), by Type 2024 & 2032
- Figure 30: Middle East & Africa Computed Tomography Market in China Revenue (Million), by Application 2024 & 2032
- Figure 31: Middle East & Africa Computed Tomography Market in China Revenue Share (%), by Application 2024 & 2032
- Figure 32: Middle East & Africa Computed Tomography Market in China Revenue (Million), by End User 2024 & 2032
- Figure 33: Middle East & Africa Computed Tomography Market in China Revenue Share (%), by End User 2024 & 2032
- Figure 34: Middle East & Africa Computed Tomography Market in China Revenue (Million), by Country 2024 & 2032
- Figure 35: Middle East & Africa Computed Tomography Market in China Revenue Share (%), by Country 2024 & 2032
- Figure 36: Asia Pacific Computed Tomography Market in China Revenue (Million), by Type 2024 & 2032
- Figure 37: Asia Pacific Computed Tomography Market in China Revenue Share (%), by Type 2024 & 2032
- Figure 38: Asia Pacific Computed Tomography Market in China Revenue (Million), by Application 2024 & 2032
- Figure 39: Asia Pacific Computed Tomography Market in China Revenue Share (%), by Application 2024 & 2032
- Figure 40: Asia Pacific Computed Tomography Market in China Revenue (Million), by End User 2024 & 2032
- Figure 41: Asia Pacific Computed Tomography Market in China Revenue Share (%), by End User 2024 & 2032
- Figure 42: Asia Pacific Computed Tomography Market in China Revenue (Million), by Country 2024 & 2032
- Figure 43: Asia Pacific Computed Tomography Market in China Revenue Share (%), by Country 2024 & 2032
List of Tables
- Table 1: Global Computed Tomography Market in China Revenue Million Forecast, by Region 2019 & 2032
- Table 2: Global Computed Tomography Market in China Revenue Million Forecast, by Type 2019 & 2032
- Table 3: Global Computed Tomography Market in China Revenue Million Forecast, by Application 2019 & 2032
- Table 4: Global Computed Tomography Market in China Revenue Million Forecast, by End User 2019 & 2032
- Table 5: Global Computed Tomography Market in China Revenue Million Forecast, by Region 2019 & 2032
- Table 6: Global Computed Tomography Market in China Revenue Million Forecast, by Country 2019 & 2032
- Table 7: Global Computed Tomography Market in China Revenue Million Forecast, by Type 2019 & 2032
- Table 8: Global Computed Tomography Market in China Revenue Million Forecast, by Application 2019 & 2032
- Table 9: Global Computed Tomography Market in China Revenue Million Forecast, by End User 2019 & 2032
- Table 10: Global Computed Tomography Market in China Revenue Million Forecast, by Country 2019 & 2032
- Table 11: United States Computed Tomography Market in China Revenue (Million) Forecast, by Application 2019 & 2032
- Table 12: Canada Computed Tomography Market in China Revenue (Million) Forecast, by Application 2019 & 2032
- Table 13: Mexico Computed Tomography Market in China Revenue (Million) Forecast, by Application 2019 & 2032
- Table 14: Global Computed Tomography Market in China Revenue Million Forecast, by Type 2019 & 2032
- Table 15: Global Computed Tomography Market in China Revenue Million Forecast, by Application 2019 & 2032
- Table 16: Global Computed Tomography Market in China Revenue Million Forecast, by End User 2019 & 2032
- Table 17: Global Computed Tomography Market in China Revenue Million Forecast, by Country 2019 & 2032
- Table 18: Brazil Computed Tomography Market in China Revenue (Million) Forecast, by Application 2019 & 2032
- Table 19: Argentina Computed Tomography Market in China Revenue (Million) Forecast, by Application 2019 & 2032
- Table 20: Rest of South America Computed Tomography Market in China Revenue (Million) Forecast, by Application 2019 & 2032
- Table 21: Global Computed Tomography Market in China Revenue Million Forecast, by Type 2019 & 2032
- Table 22: Global Computed Tomography Market in China Revenue Million Forecast, by Application 2019 & 2032
- Table 23: Global Computed Tomography Market in China Revenue Million Forecast, by End User 2019 & 2032
- Table 24: Global Computed Tomography Market in China Revenue Million Forecast, by Country 2019 & 2032
- Table 25: United Kingdom Computed Tomography Market in China Revenue (Million) Forecast, by Application 2019 & 2032
- Table 26: Germany Computed Tomography Market in China Revenue (Million) Forecast, by Application 2019 & 2032
- Table 27: France Computed Tomography Market in China Revenue (Million) Forecast, by Application 2019 & 2032
- Table 28: Italy Computed Tomography Market in China Revenue (Million) Forecast, by Application 2019 & 2032
- Table 29: Spain Computed Tomography Market in China Revenue (Million) Forecast, by Application 2019 & 2032
- Table 30: Russia Computed Tomography Market in China Revenue (Million) Forecast, by Application 2019 & 2032
- Table 31: Benelux Computed Tomography Market in China Revenue (Million) Forecast, by Application 2019 & 2032
- Table 32: Nordics Computed Tomography Market in China Revenue (Million) Forecast, by Application 2019 & 2032
- Table 33: Rest of Europe Computed Tomography Market in China Revenue (Million) Forecast, by Application 2019 & 2032
- Table 34: Global Computed Tomography Market in China Revenue Million Forecast, by Type 2019 & 2032
- Table 35: Global Computed Tomography Market in China Revenue Million Forecast, by Application 2019 & 2032
- Table 36: Global Computed Tomography Market in China Revenue Million Forecast, by End User 2019 & 2032
- Table 37: Global Computed Tomography Market in China Revenue Million Forecast, by Country 2019 & 2032
- Table 38: Turkey Computed Tomography Market in China Revenue (Million) Forecast, by Application 2019 & 2032
- Table 39: Israel Computed Tomography Market in China Revenue (Million) Forecast, by Application 2019 & 2032
- Table 40: GCC Computed Tomography Market in China Revenue (Million) Forecast, by Application 2019 & 2032
- Table 41: North Africa Computed Tomography Market in China Revenue (Million) Forecast, by Application 2019 & 2032
- Table 42: South Africa Computed Tomography Market in China Revenue (Million) Forecast, by Application 2019 & 2032
- Table 43: Rest of Middle East & Africa Computed Tomography Market in China Revenue (Million) Forecast, by Application 2019 & 2032
- Table 44: Global Computed Tomography Market in China Revenue Million Forecast, by Type 2019 & 2032
- Table 45: Global Computed Tomography Market in China Revenue Million Forecast, by Application 2019 & 2032
- Table 46: Global Computed Tomography Market in China Revenue Million Forecast, by End User 2019 & 2032
- Table 47: Global Computed Tomography Market in China Revenue Million Forecast, by Country 2019 & 2032
- Table 48: China Computed Tomography Market in China Revenue (Million) Forecast, by Application 2019 & 2032
- Table 49: India Computed Tomography Market in China Revenue (Million) Forecast, by Application 2019 & 2032
- Table 50: Japan Computed Tomography Market in China Revenue (Million) Forecast, by Application 2019 & 2032
- Table 51: South Korea Computed Tomography Market in China Revenue (Million) Forecast, by Application 2019 & 2032
- Table 52: ASEAN Computed Tomography Market in China Revenue (Million) Forecast, by Application 2019 & 2032
- Table 53: Oceania Computed Tomography Market in China Revenue (Million) Forecast, by Application 2019 & 2032
- Table 54: Rest of Asia Pacific Computed Tomography Market in China Revenue (Million) Forecast, by Application 2019 & 2032
Frequently Asked Questions
1. What is the projected Compound Annual Growth Rate (CAGR) of the Computed Tomography Market in China?
The projected CAGR is approximately 5.98%.
2. Which companies are prominent players in the Computed Tomography Market in China?
Key companies in the market include Naugra Medical Lab, Siemens Healthineers, GE Healthcare, Neusoft Medical Systems Co Ltd, Shenzhen Anke High-tech Co Ltd, Koninklijke Philips NV, Canon Medical Systems Corporation, MinFound Medical Systems Co Ltd, Planmed Oy, Fujifilm Holdings Corporation.
3. What are the main segments of the Computed Tomography Market in China?
The market segments include Type, Application, End User.
4. Can you provide details about the market size?
The market size is estimated to be USD 1.34 Million as of 2022.
5. What are some drivers contributing to market growth?
Increasing Geriatric Population and Chronic Disease Burden; Technological Advancements in Computed Tomography.
6. What are the notable trends driving market growth?
Diagnostic Centers to Hold Significant Share in End-User Segment Over the Forecast Period.
7. Are there any restraints impacting market growth?
High Cost Associated With CT Scan Procedure and Equipment.
8. Can you provide examples of recent developments in the market?
March 2023: Elekta launched a cooperative venture with China National Pharmaceutical Group Co., Ltd. (Sinopharm) to expand the use of radiation therapy in so-called lower-tier cities, where around 70% of the population lives.
9. What pricing options are available for accessing the report?
Pricing options include single-user, multi-user, and enterprise licenses priced at USD 3800, USD 4500, and USD 5800 respectively.
10. Is the market size provided in terms of value or volume?
The market size is provided in terms of value, measured in Million.
11. Are there any specific market keywords associated with the report?
Yes, the market keyword associated with the report is "Computed Tomography Market in China," which aids in identifying and referencing the specific market segment covered.
12. How do I determine which pricing option suits my needs best?
The pricing options vary based on user requirements and access needs. Individual users may opt for single-user licenses, while businesses requiring broader access may choose multi-user or enterprise licenses for cost-effective access to the report.
13. Are there any additional resources or data provided in the Computed Tomography Market in China report?
While the report offers comprehensive insights, it's advisable to review the specific contents or supplementary materials provided to ascertain if additional resources or data are available.
14. How can I stay updated on further developments or reports in the Computed Tomography Market in China?
To stay informed about further developments, trends, and reports in the Computed Tomography Market in China, consider subscribing to industry newsletters, following relevant companies and organizations, or regularly checking reputable industry news sources and publications.
Methodology
Step 1 - Identification of Relevant Samples Size from Population Database


Step 2 - Approaches for Defining Global Market Size (Value, Volume* & Price*)

Note*: In applicable scenarios
Step 3 - Data Sources
Primary Research
- Web Analytics
- Survey Reports
- Research Institute
- Latest Research Reports
- Opinion Leaders
Secondary Research
- Annual Reports
- White Paper
- Latest Press Release
- Industry Association
- Paid Database
- Investor Presentations

Step 4 - Data Triangulation
Involves using different sources of information in order to increase the validity of a study
These sources are likely to be stakeholders in a program - participants, other researchers, program staff, other community members, and so on.
Then we put all data in single framework & apply various statistical tools to find out the dynamic on the market.
During the analysis stage, feedback from the stakeholder groups would be compared to determine areas of agreement as well as areas of divergence
