

Key Insights
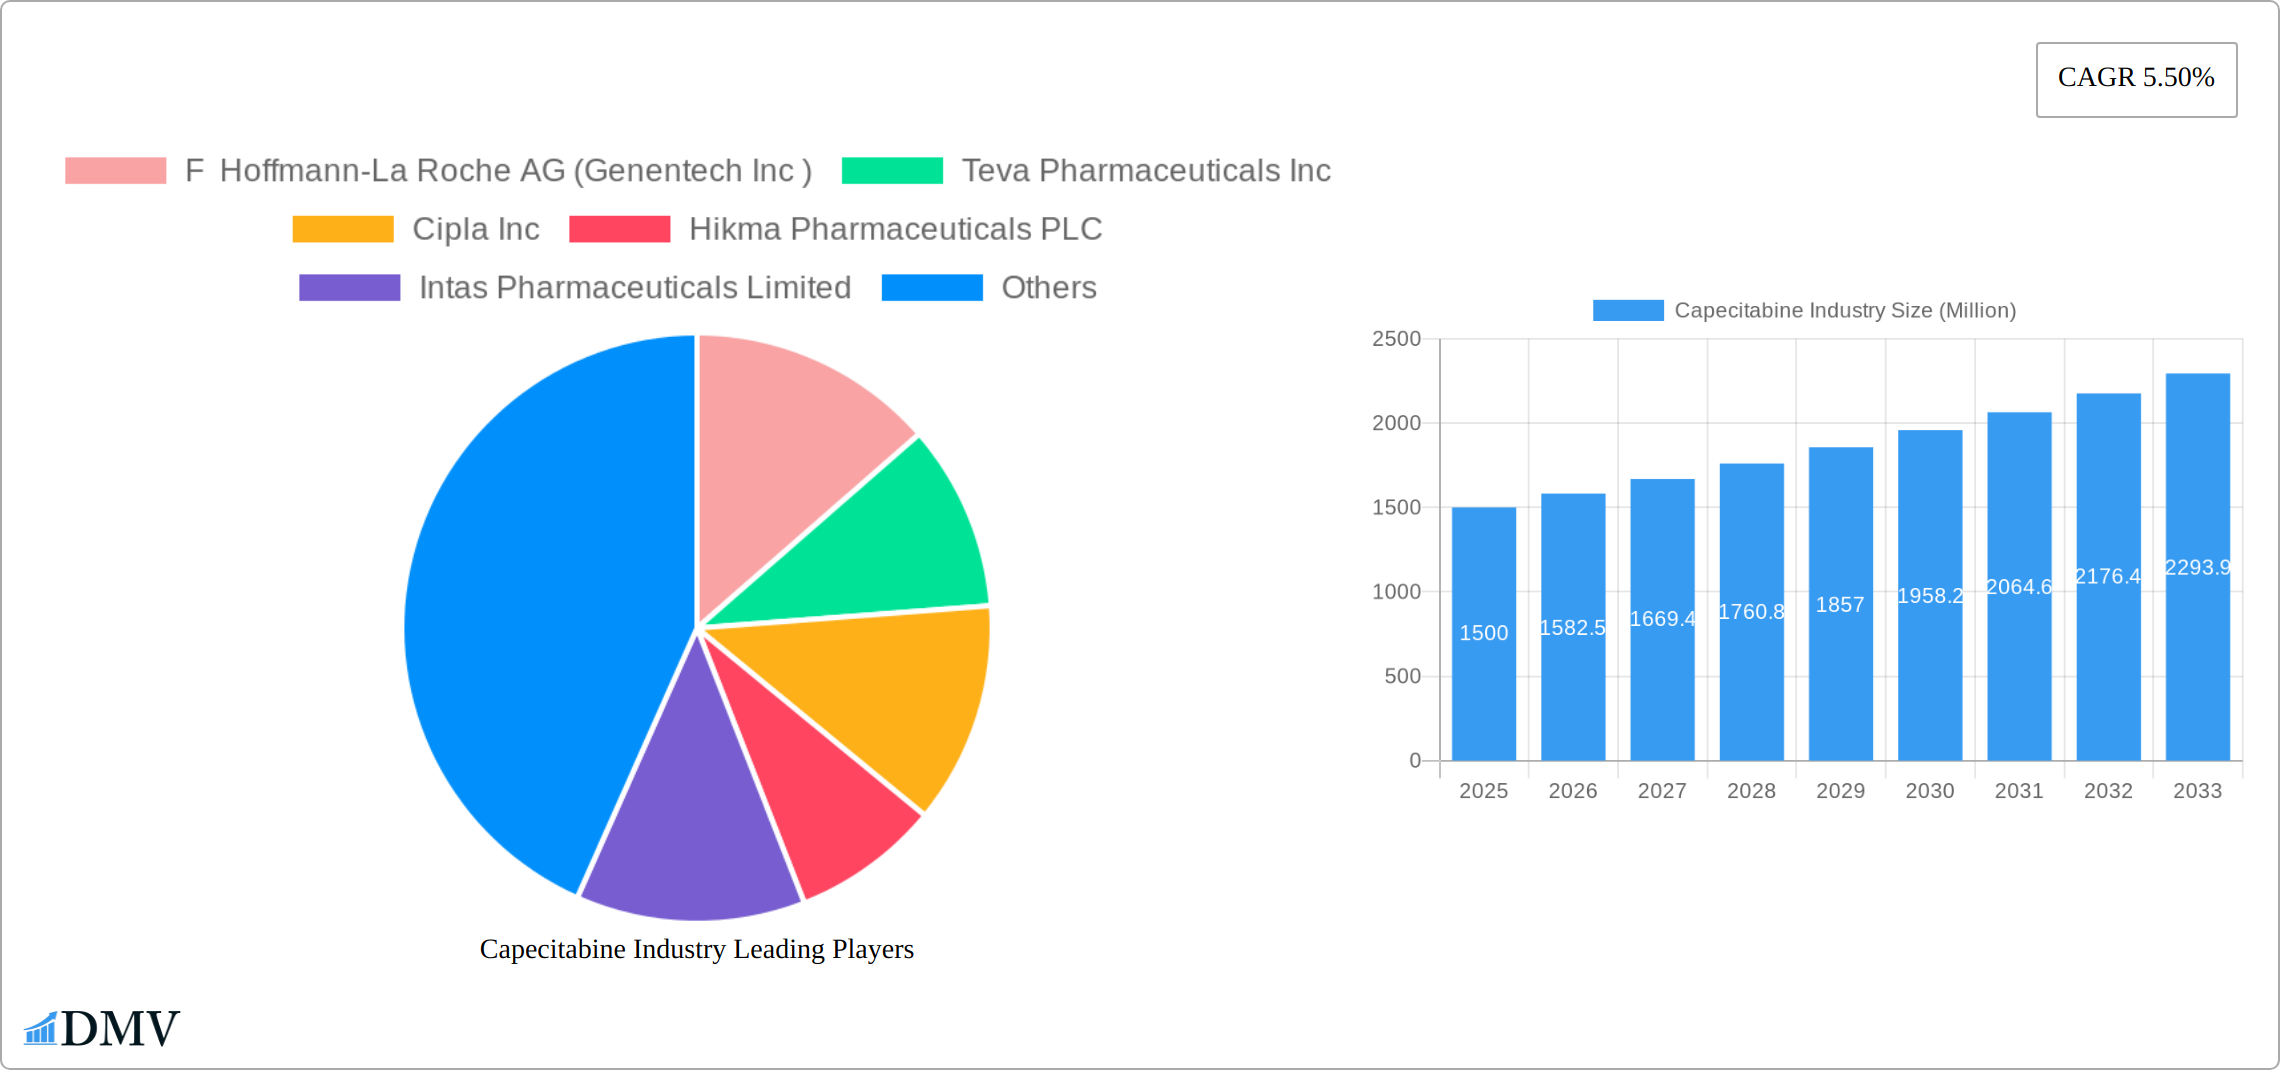
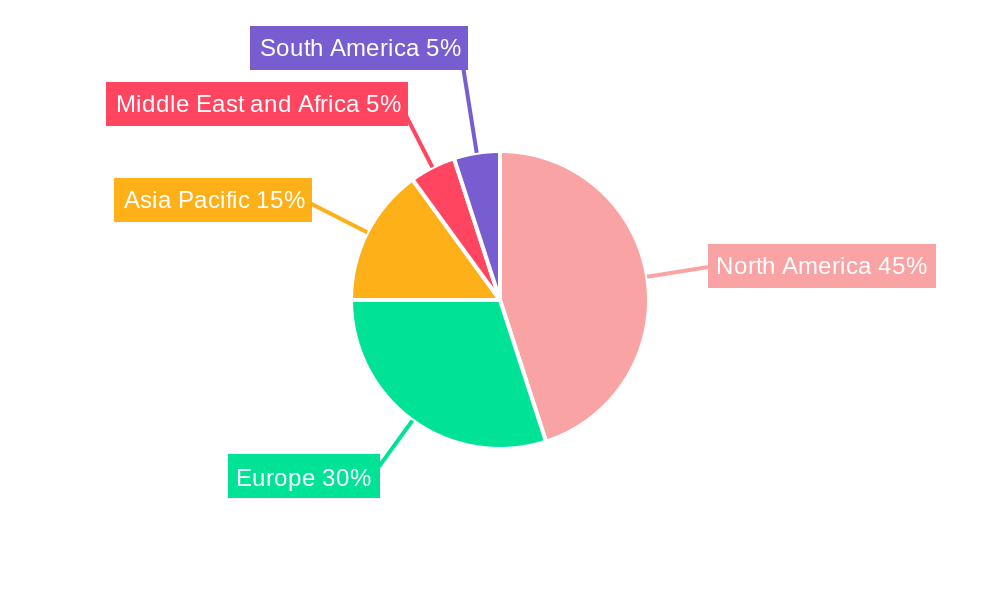
The global capecitabine market, valued at approximately $1.5 billion in 2025, is projected to experience robust growth, exhibiting a Compound Annual Growth Rate (CAGR) of 5.50% from 2025 to 2033. This expansion is fueled primarily by the rising incidence of colorectal and breast cancers, the two largest indication segments. Increasing geriatric populations globally, coupled with advancements in cancer treatment strategies that incorporate capecitabine, contribute significantly to market expansion. Hospitals and clinical laboratories constitute the dominant distribution channels, reflecting the need for controlled administration and monitoring of this chemotherapeutic agent. Competitive pressures among key players like F. Hoffmann-La Roche AG (Genentech Inc.), Teva Pharmaceuticals Inc., Cipla Inc., and others drive innovation and the development of more effective and affordable formulations. However, the market faces restraints including the emergence of alternative cancer therapies and potential side effects associated with capecitabine, necessitating careful patient selection and monitoring. Regional variations in healthcare infrastructure and access to advanced medical treatments also influence market growth; North America and Europe are currently the largest markets, but the Asia-Pacific region is projected to experience significant growth owing to increasing cancer prevalence and rising healthcare expenditure.
The forecast period (2025-2033) anticipates continued market expansion, driven by a combination of factors. The increasing prevalence of colorectal and breast cancer, coupled with ongoing research into improved treatment protocols incorporating capecitabine, will be key drivers. While the emergence of biosimilars may create price competition, the overall market size is expected to continue growing due to increased demand. Geographical expansion, particularly in emerging economies with growing healthcare infrastructure, will contribute to market growth. However, factors such as stringent regulatory approvals for new formulations and the potential for generic competition need to be considered as influencing factors within this growth trajectory. The successful launch of novel drug combinations and improved delivery systems could significantly impact future market trends.
Capecitabine Industry Market Report: 2019-2033
This comprehensive report provides an in-depth analysis of the global Capecitabine market, offering valuable insights for stakeholders seeking to understand market dynamics, growth opportunities, and competitive landscapes. Covering the period 2019-2033, with a base year of 2025 and forecast period 2025-2033, this report meticulously examines market trends, technological advancements, and key players shaping the industry's future.
Capecitabine Industry Market Composition & Trends
This section provides a comprehensive analysis of the Capecitabine market's structure, delving into market concentration, key innovation drivers, the intricate web of regulatory frameworks, the competitive landscape shaped by substitute products, and detailed end-user profiles. Our evaluation includes a thorough examination of merger and acquisition (M&A) activities that have shaped and continue to influence the industry. We forecast a robust market size of [XX] Million in 2025, projecting a Compound Annual Growth Rate (CAGR) of [XX]% from 2025 to 2033.
- Market Concentration: The Capecitabine market is characterized by a moderately concentrated structure. In 2025, the top five key players – F Hoffmann-La Roche AG (Genentech Inc), Teva Pharmaceuticals Inc, Cipla Inc, Hikma Pharmaceuticals PLC, and Intas Pharmaceuticals Limited – collectively command an estimated [XX]% market share. This indicates a significant, yet not fully monopolized, market landscape.
- Innovation Catalysts: The industry's innovation trajectory is being significantly propelled by ongoing research and development in advanced targeted therapies and sophisticated combination treatment regimens. The advent and increasing adoption of high-quality biosimilars also represent substantial growth opportunities and a key driver for wider patient access and market expansion.
- Regulatory Landscape: Navigating the stringent regulatory pathways for new drug applications (NDAs) and biosimilars is paramount, directly influencing market entry timelines and overall growth potential. Furthermore, considerable variations in regulatory requirements and approval processes across different geographical regions present unique challenges and opportunities for market access and commercialization strategies.
- Substitute Products: The competitive pressure from alternative chemotherapeutic agents and cutting-edge targeted therapies remains a significant factor, directly impacting market share dynamics and necessitating continuous product differentiation and value proposition enhancement.
- End-User Profiles: The primary demand for Capecitabine originates from hospitals and specialized clinical laboratories. Concurrently, there is a notable and expanding segment of demand emanating from ambulatory care centers, reflecting evolving healthcare delivery models.
- M&A Activities: Throughout the historical period from 2019 to 2024, M&A activity within the Capecitabine sector has been characterized by a moderate pace. These transactions have predominantly focused on strategic objectives such as expanding global geographic reach and broadening product portfolios. The aggregate estimated value of these deals during this period stands at [XX] Million.
Capecitabine Industry Evolution
This section explores the historical and projected growth trajectories of the Capecitabine market. We analyze technological advancements and the evolving demands of patients and healthcare providers. Market growth is significantly influenced by factors such as rising cancer incidence, increased healthcare spending, and the growing adoption of targeted therapies.
The market experienced a CAGR of xx% during the historical period (2019-2024), driven primarily by increased diagnosis rates and improved access to healthcare in emerging markets. Technological advancements, such as the development of more targeted and less toxic formulations, further contributed to growth. We forecast a continued growth trajectory, albeit at a slightly moderated pace, during the forecast period (2025-2033), with adoption rates influenced by factors such as generic competition and the emergence of novel therapies. The shift towards personalized medicine is also expected to shape future market dynamics. The report includes detailed sales figures and adoption metrics for each segment across different geographical regions.
Leading Regions, Countries, or Segments in Capecitabine Industry
This section identifies the leading regions, countries, and segments within the Capecitabine market.
Dominant Regions/Countries: North America (particularly the US) and Europe currently hold the largest market shares due to high cancer prevalence, robust healthcare infrastructure, and advanced medical technologies. However, emerging markets in Asia-Pacific are witnessing significant growth, fueled by increasing healthcare expenditure and rising cancer incidence.
Dominant Indications:
- Colorectal Cancer: This remains the leading indication for Capecitabine, owing to its efficacy and established treatment guidelines. Growth is fueled by increasing colorectal cancer prevalence and advancements in early detection techniques.
- Breast Cancer: Capecitabine plays a significant role in breast cancer treatment, particularly in adjuvant and neoadjuvant settings. Market growth is driven by rising breast cancer diagnosis rates and the adoption of combination therapies.
- Others: This segment includes various other oncological applications, such as gastric cancer and pancreatic cancer, with growth potential driven by increasing research and expanded approval for these indications.
Dominant Distribution Channels:
Hospitals: Hospitals remain the dominant distribution channel, due to the complexity of Capecitabine administration and the need for close medical supervision.
Clinical Laboratories: Clinical laboratories play a crucial role in testing and monitoring patients undergoing Capecitabine therapy, further reinforcing their importance in the distribution network.
Others: This includes pharmacies and specialized distribution networks, with increasing contribution from specialized pharmacies offering home delivery of medications.
Key Drivers:
- High prevalence of colorectal and breast cancers globally.
- Increasing healthcare expenditure and improved access to healthcare in emerging economies.
- Ongoing clinical trials exploring new combination therapies and applications.
- Favorable regulatory landscape in key markets.
Capecitabine Industry Product Innovations
Recent advancements in Capecitabine product development are predominantly focused on refining drug delivery systems. These innovations aim to achieve a dual objective: minimizing adverse side effects for patients and significantly enhancing therapeutic efficacy. Formulations boasting improved bioavailability and demonstrably reduced toxicity profiles are progressively gaining market acceptance and traction. The development and strategic launch of biosimilars represent another critical area of innovation, holding the potential to dramatically improve access to cost-effective Capecitabine therapy for a broader patient population. These forward-thinking innovations are anticipated to contribute positively to enhanced patient outcomes and further stimulate market expansion.
Propelling Factors for Capecitabine Industry Growth
Several factors are driving the growth of the Capecitabine market. These include the rising prevalence of colorectal and breast cancers, coupled with a growing awareness of these diseases. The increasing expenditure on healthcare, particularly in developing countries, provides substantial opportunities. Furthermore, continuous technological advancements in drug delivery systems and combination therapies contribute to growth. Finally, favorable regulatory approvals and policies in key markets further propel market expansion.
Obstacles in the Capecitabine Industry Market
The Capecitabine market is not without its inherent challenges. The stringent nature of regulatory approval processes can act as a significant bottleneck, potentially delaying the market entry of novel products. Furthermore, the inherent vulnerability of global supply chains, susceptible to disruptions stemming from geopolitical events or widespread pandemics, poses a considerable risk to market stability and consistent product availability. Intense competition from established market players, coupled with the continuous emergence of highly innovative alternative therapies, also presents a substantial hurdle for market participants. The quantifiable impact of these obstacles can manifest as delayed product launches, increased production and operational costs, and a resultant decrease in market share for individual companies.
Future Opportunities in Capecitabine Industry
Future opportunities lie in expanding into new geographic markets, particularly in developing countries with high cancer incidence and growing healthcare infrastructure. Further research into targeted therapies and combination regimens can drive product innovation. The development and launch of biosimilars have the potential to significantly increase market penetration. Finally, addressing unmet needs related to patient adherence and side-effect management offers scope for future growth.
Major Players in the Capecitabine Industry Ecosystem
- F Hoffmann-La Roche AG (Genentech Inc)
- Teva Pharmaceuticals Inc
- Cipla Inc
- Hikma Pharmaceuticals PLC
- Intas Pharmaceuticals Limited
- Fresenius SE & Co KGaA
- Armas Pharmaceuticals Inc
- Sun Pharmaceutical Industries Limited
- Dr Reddy's Laboratories Ltd
- Mylan N V
Key Developments in Capecitabine Industry Industry
- 2022-Q4: Launch of a new generic Capecitabine formulation by a major player in the Indian market.
- 2023-Q2: Approval of a new combination therapy including Capecitabine in a specific cancer indication by the FDA.
- 2024-Q1: Acquisition of a smaller biotech company specializing in Capecitabine drug delivery systems by a large pharmaceutical company.
Strategic Capecitabine Industry Market Forecast
The Capecitabine market is strategically positioned for sustained and robust growth. This optimistic outlook is underpinned by several key factors, including the persistent and concerning rise in cancer incidence rates globally, the ongoing development of innovative combination therapies that enhance treatment efficacy, and the strategic expansion of Capecitabine's application into new and emerging markets. The increasing prevalence and acceptance of biosimilars are poised to exert a significant influence on pricing strategies and the distribution of market share among key players. Looking further ahead, long-term market growth will be intrinsically linked to advancements in highly targeted therapies and the broader adoption of personalized medicine approaches. While these advancements may eventually lead to a reduced reliance on Capecitabine in specific treatment contexts, the market demonstrates substantial inherent potential for continued expansion and groundbreaking innovation. This dynamic environment creates attractive and compelling investment opportunities for all stakeholders involved.
Capecitabine Industry Segmentation
-
1. Indication
- 1.1. Colorectal Cancer
- 1.2. Breast Cancer
- 1.3. Others
-
2. Distribution Channel
- 2.1. Hospitals
- 2.2. Clinical Laboratories
- 2.3. Others
Capecitabine Industry Segmentation By Geography
-
1. North America
- 1.1. United States
- 1.2. Canada
- 1.3. Mexico
-
2. Europe
- 2.1. Germany
- 2.2. United Kingdom
- 2.3. France
- 2.4. Italy
- 2.5. Spain
- 2.6. Rest of Europe
-
3. Asia Pacific
- 3.1. China
- 3.2. Japan
- 3.3. India
- 3.4. Australia
- 3.5. South Korea
- 3.6. Rest of Asia Pacific
-
4. Middle East and Africa
- 4.1. GCC
- 4.2. South Africa
- 4.3. Rest of Middle East and Africa
-
5. South America
- 5.1. Brazil
- 5.2. Argentina
- 5.3. Rest of South America
Capecitabine Industry REPORT HIGHLIGHTS
| Aspects | Details |
|---|---|
| Study Period | 2019-2033 |
| Base Year | 2024 |
| Estimated Year | 2025 |
| Forecast Period | 2025-2033 |
| Historical Period | 2019-2024 |
| Growth Rate | CAGR of 5.50% from 2019-2033 |
| Segmentation |
|
Table of Contents
- 1. Introduction
- 1.1. Research Scope
- 1.2. Market Segmentation
- 1.3. Research Methodology
- 1.4. Definitions and Assumptions
- 2. Executive Summary
- 2.1. Introduction
- 3. Market Dynamics
- 3.1. Introduction
- 3.2. Market Drivers
- 3.2.1. ; Rising Government Initiatives to Control Growing Global Cancer Burden; Increasing Incidence of Cancers Around the World
- 3.3. Market Restrains
- 3.3.1 ; Highly Expensive Products and Treatment; Rising Adoption of Substitutes like Raltitrexed
- 3.3.2 Irinotecan and Leucovorin for Adjuvant Therapy
- 3.4. Market Trends
- 3.4.1. Breast Cancer by Indication is Expected to Hold the Largest Market Share in the Global Capecitabine Market
- 4. Market Factor Analysis
- 4.1. Porters Five Forces
- 4.2. Supply/Value Chain
- 4.3. PESTEL analysis
- 4.4. Market Entropy
- 4.5. Patent/Trademark Analysis
- 5. Global Capecitabine Industry Analysis, Insights and Forecast, 2019-2031
- 5.1. Market Analysis, Insights and Forecast - by Indication
- 5.1.1. Colorectal Cancer
- 5.1.2. Breast Cancer
- 5.1.3. Others
- 5.2. Market Analysis, Insights and Forecast - by Distribution Channel
- 5.2.1. Hospitals
- 5.2.2. Clinical Laboratories
- 5.2.3. Others
- 5.3. Market Analysis, Insights and Forecast - by Region
- 5.3.1. North America
- 5.3.2. Europe
- 5.3.3. Asia Pacific
- 5.3.4. Middle East and Africa
- 5.3.5. South America
- 5.1. Market Analysis, Insights and Forecast - by Indication
- 6. North America Capecitabine Industry Analysis, Insights and Forecast, 2019-2031
- 6.1. Market Analysis, Insights and Forecast - by Indication
- 6.1.1. Colorectal Cancer
- 6.1.2. Breast Cancer
- 6.1.3. Others
- 6.2. Market Analysis, Insights and Forecast - by Distribution Channel
- 6.2.1. Hospitals
- 6.2.2. Clinical Laboratories
- 6.2.3. Others
- 6.1. Market Analysis, Insights and Forecast - by Indication
- 7. Europe Capecitabine Industry Analysis, Insights and Forecast, 2019-2031
- 7.1. Market Analysis, Insights and Forecast - by Indication
- 7.1.1. Colorectal Cancer
- 7.1.2. Breast Cancer
- 7.1.3. Others
- 7.2. Market Analysis, Insights and Forecast - by Distribution Channel
- 7.2.1. Hospitals
- 7.2.2. Clinical Laboratories
- 7.2.3. Others
- 7.1. Market Analysis, Insights and Forecast - by Indication
- 8. Asia Pacific Capecitabine Industry Analysis, Insights and Forecast, 2019-2031
- 8.1. Market Analysis, Insights and Forecast - by Indication
- 8.1.1. Colorectal Cancer
- 8.1.2. Breast Cancer
- 8.1.3. Others
- 8.2. Market Analysis, Insights and Forecast - by Distribution Channel
- 8.2.1. Hospitals
- 8.2.2. Clinical Laboratories
- 8.2.3. Others
- 8.1. Market Analysis, Insights and Forecast - by Indication
- 9. Middle East and Africa Capecitabine Industry Analysis, Insights and Forecast, 2019-2031
- 9.1. Market Analysis, Insights and Forecast - by Indication
- 9.1.1. Colorectal Cancer
- 9.1.2. Breast Cancer
- 9.1.3. Others
- 9.2. Market Analysis, Insights and Forecast - by Distribution Channel
- 9.2.1. Hospitals
- 9.2.2. Clinical Laboratories
- 9.2.3. Others
- 9.1. Market Analysis, Insights and Forecast - by Indication
- 10. South America Capecitabine Industry Analysis, Insights and Forecast, 2019-2031
- 10.1. Market Analysis, Insights and Forecast - by Indication
- 10.1.1. Colorectal Cancer
- 10.1.2. Breast Cancer
- 10.1.3. Others
- 10.2. Market Analysis, Insights and Forecast - by Distribution Channel
- 10.2.1. Hospitals
- 10.2.2. Clinical Laboratories
- 10.2.3. Others
- 10.1. Market Analysis, Insights and Forecast - by Indication
- 11. North America Capecitabine Industry Analysis, Insights and Forecast, 2019-2031
- 11.1. Market Analysis, Insights and Forecast - By Country/Sub-region
- 11.1.1 United States
- 11.1.2 Canada
- 11.1.3 Mexico
- 12. Europe Capecitabine Industry Analysis, Insights and Forecast, 2019-2031
- 12.1. Market Analysis, Insights and Forecast - By Country/Sub-region
- 12.1.1 Germany
- 12.1.2 United Kingdom
- 12.1.3 France
- 12.1.4 Italy
- 12.1.5 Spain
- 12.1.6 Rest of Europe
- 13. Asia Pacific Capecitabine Industry Analysis, Insights and Forecast, 2019-2031
- 13.1. Market Analysis, Insights and Forecast - By Country/Sub-region
- 13.1.1 China
- 13.1.2 Japan
- 13.1.3 India
- 13.1.4 Australia
- 13.1.5 South Korea
- 13.1.6 Rest of Asia Pacific
- 14. Middle East and Africa Capecitabine Industry Analysis, Insights and Forecast, 2019-2031
- 14.1. Market Analysis, Insights and Forecast - By Country/Sub-region
- 14.1.1 GCC
- 14.1.2 South Africa
- 14.1.3 Rest of Middle East and Africa
- 15. South America Capecitabine Industry Analysis, Insights and Forecast, 2019-2031
- 15.1. Market Analysis, Insights and Forecast - By Country/Sub-region
- 15.1.1 Brazil
- 15.1.2 Argentina
- 15.1.3 Rest of South America
- 16. Competitive Analysis
- 16.1. Global Market Share Analysis 2024
- 16.2. Company Profiles
- 16.2.1 F Hoffmann-La Roche AG (Genentech Inc )
- 16.2.1.1. Overview
- 16.2.1.2. Products
- 16.2.1.3. SWOT Analysis
- 16.2.1.4. Recent Developments
- 16.2.1.5. Financials (Based on Availability)
- 16.2.2 Teva Pharmaceuticals Inc
- 16.2.2.1. Overview
- 16.2.2.2. Products
- 16.2.2.3. SWOT Analysis
- 16.2.2.4. Recent Developments
- 16.2.2.5. Financials (Based on Availability)
- 16.2.3 Cipla Inc
- 16.2.3.1. Overview
- 16.2.3.2. Products
- 16.2.3.3. SWOT Analysis
- 16.2.3.4. Recent Developments
- 16.2.3.5. Financials (Based on Availability)
- 16.2.4 Hikma Pharmaceuticals PLC
- 16.2.4.1. Overview
- 16.2.4.2. Products
- 16.2.4.3. SWOT Analysis
- 16.2.4.4. Recent Developments
- 16.2.4.5. Financials (Based on Availability)
- 16.2.5 Intas Pharmaceuticals Limited
- 16.2.5.1. Overview
- 16.2.5.2. Products
- 16.2.5.3. SWOT Analysis
- 16.2.5.4. Recent Developments
- 16.2.5.5. Financials (Based on Availability)
- 16.2.6 Fresenius SE & Co KGaA
- 16.2.6.1. Overview
- 16.2.6.2. Products
- 16.2.6.3. SWOT Analysis
- 16.2.6.4. Recent Developments
- 16.2.6.5. Financials (Based on Availability)
- 16.2.7 Armas Pharmaceuticals Inc
- 16.2.7.1. Overview
- 16.2.7.2. Products
- 16.2.7.3. SWOT Analysis
- 16.2.7.4. Recent Developments
- 16.2.7.5. Financials (Based on Availability)
- 16.2.8 Sun Pharmaceutical Industries Limited
- 16.2.8.1. Overview
- 16.2.8.2. Products
- 16.2.8.3. SWOT Analysis
- 16.2.8.4. Recent Developments
- 16.2.8.5. Financials (Based on Availability)
- 16.2.9 Dr Reddy's Laboratories Ltd
- 16.2.9.1. Overview
- 16.2.9.2. Products
- 16.2.9.3. SWOT Analysis
- 16.2.9.4. Recent Developments
- 16.2.9.5. Financials (Based on Availability)
- 16.2.10 Mylan N V
- 16.2.10.1. Overview
- 16.2.10.2. Products
- 16.2.10.3. SWOT Analysis
- 16.2.10.4. Recent Developments
- 16.2.10.5. Financials (Based on Availability)
- 16.2.1 F Hoffmann-La Roche AG (Genentech Inc )
List of Figures
- Figure 1: Global Capecitabine Industry Revenue Breakdown (Million, %) by Region 2024 & 2032
- Figure 2: Global Capecitabine Industry Volume Breakdown (K Unit, %) by Region 2024 & 2032
- Figure 3: North America Capecitabine Industry Revenue (Million), by Country 2024 & 2032
- Figure 4: North America Capecitabine Industry Volume (K Unit), by Country 2024 & 2032
- Figure 5: North America Capecitabine Industry Revenue Share (%), by Country 2024 & 2032
- Figure 6: North America Capecitabine Industry Volume Share (%), by Country 2024 & 2032
- Figure 7: Europe Capecitabine Industry Revenue (Million), by Country 2024 & 2032
- Figure 8: Europe Capecitabine Industry Volume (K Unit), by Country 2024 & 2032
- Figure 9: Europe Capecitabine Industry Revenue Share (%), by Country 2024 & 2032
- Figure 10: Europe Capecitabine Industry Volume Share (%), by Country 2024 & 2032
- Figure 11: Asia Pacific Capecitabine Industry Revenue (Million), by Country 2024 & 2032
- Figure 12: Asia Pacific Capecitabine Industry Volume (K Unit), by Country 2024 & 2032
- Figure 13: Asia Pacific Capecitabine Industry Revenue Share (%), by Country 2024 & 2032
- Figure 14: Asia Pacific Capecitabine Industry Volume Share (%), by Country 2024 & 2032
- Figure 15: Middle East and Africa Capecitabine Industry Revenue (Million), by Country 2024 & 2032
- Figure 16: Middle East and Africa Capecitabine Industry Volume (K Unit), by Country 2024 & 2032
- Figure 17: Middle East and Africa Capecitabine Industry Revenue Share (%), by Country 2024 & 2032
- Figure 18: Middle East and Africa Capecitabine Industry Volume Share (%), by Country 2024 & 2032
- Figure 19: South America Capecitabine Industry Revenue (Million), by Country 2024 & 2032
- Figure 20: South America Capecitabine Industry Volume (K Unit), by Country 2024 & 2032
- Figure 21: South America Capecitabine Industry Revenue Share (%), by Country 2024 & 2032
- Figure 22: South America Capecitabine Industry Volume Share (%), by Country 2024 & 2032
- Figure 23: North America Capecitabine Industry Revenue (Million), by Indication 2024 & 2032
- Figure 24: North America Capecitabine Industry Volume (K Unit), by Indication 2024 & 2032
- Figure 25: North America Capecitabine Industry Revenue Share (%), by Indication 2024 & 2032
- Figure 26: North America Capecitabine Industry Volume Share (%), by Indication 2024 & 2032
- Figure 27: North America Capecitabine Industry Revenue (Million), by Distribution Channel 2024 & 2032
- Figure 28: North America Capecitabine Industry Volume (K Unit), by Distribution Channel 2024 & 2032
- Figure 29: North America Capecitabine Industry Revenue Share (%), by Distribution Channel 2024 & 2032
- Figure 30: North America Capecitabine Industry Volume Share (%), by Distribution Channel 2024 & 2032
- Figure 31: North America Capecitabine Industry Revenue (Million), by Country 2024 & 2032
- Figure 32: North America Capecitabine Industry Volume (K Unit), by Country 2024 & 2032
- Figure 33: North America Capecitabine Industry Revenue Share (%), by Country 2024 & 2032
- Figure 34: North America Capecitabine Industry Volume Share (%), by Country 2024 & 2032
- Figure 35: Europe Capecitabine Industry Revenue (Million), by Indication 2024 & 2032
- Figure 36: Europe Capecitabine Industry Volume (K Unit), by Indication 2024 & 2032
- Figure 37: Europe Capecitabine Industry Revenue Share (%), by Indication 2024 & 2032
- Figure 38: Europe Capecitabine Industry Volume Share (%), by Indication 2024 & 2032
- Figure 39: Europe Capecitabine Industry Revenue (Million), by Distribution Channel 2024 & 2032
- Figure 40: Europe Capecitabine Industry Volume (K Unit), by Distribution Channel 2024 & 2032
- Figure 41: Europe Capecitabine Industry Revenue Share (%), by Distribution Channel 2024 & 2032
- Figure 42: Europe Capecitabine Industry Volume Share (%), by Distribution Channel 2024 & 2032
- Figure 43: Europe Capecitabine Industry Revenue (Million), by Country 2024 & 2032
- Figure 44: Europe Capecitabine Industry Volume (K Unit), by Country 2024 & 2032
- Figure 45: Europe Capecitabine Industry Revenue Share (%), by Country 2024 & 2032
- Figure 46: Europe Capecitabine Industry Volume Share (%), by Country 2024 & 2032
- Figure 47: Asia Pacific Capecitabine Industry Revenue (Million), by Indication 2024 & 2032
- Figure 48: Asia Pacific Capecitabine Industry Volume (K Unit), by Indication 2024 & 2032
- Figure 49: Asia Pacific Capecitabine Industry Revenue Share (%), by Indication 2024 & 2032
- Figure 50: Asia Pacific Capecitabine Industry Volume Share (%), by Indication 2024 & 2032
- Figure 51: Asia Pacific Capecitabine Industry Revenue (Million), by Distribution Channel 2024 & 2032
- Figure 52: Asia Pacific Capecitabine Industry Volume (K Unit), by Distribution Channel 2024 & 2032
- Figure 53: Asia Pacific Capecitabine Industry Revenue Share (%), by Distribution Channel 2024 & 2032
- Figure 54: Asia Pacific Capecitabine Industry Volume Share (%), by Distribution Channel 2024 & 2032
- Figure 55: Asia Pacific Capecitabine Industry Revenue (Million), by Country 2024 & 2032
- Figure 56: Asia Pacific Capecitabine Industry Volume (K Unit), by Country 2024 & 2032
- Figure 57: Asia Pacific Capecitabine Industry Revenue Share (%), by Country 2024 & 2032
- Figure 58: Asia Pacific Capecitabine Industry Volume Share (%), by Country 2024 & 2032
- Figure 59: Middle East and Africa Capecitabine Industry Revenue (Million), by Indication 2024 & 2032
- Figure 60: Middle East and Africa Capecitabine Industry Volume (K Unit), by Indication 2024 & 2032
- Figure 61: Middle East and Africa Capecitabine Industry Revenue Share (%), by Indication 2024 & 2032
- Figure 62: Middle East and Africa Capecitabine Industry Volume Share (%), by Indication 2024 & 2032
- Figure 63: Middle East and Africa Capecitabine Industry Revenue (Million), by Distribution Channel 2024 & 2032
- Figure 64: Middle East and Africa Capecitabine Industry Volume (K Unit), by Distribution Channel 2024 & 2032
- Figure 65: Middle East and Africa Capecitabine Industry Revenue Share (%), by Distribution Channel 2024 & 2032
- Figure 66: Middle East and Africa Capecitabine Industry Volume Share (%), by Distribution Channel 2024 & 2032
- Figure 67: Middle East and Africa Capecitabine Industry Revenue (Million), by Country 2024 & 2032
- Figure 68: Middle East and Africa Capecitabine Industry Volume (K Unit), by Country 2024 & 2032
- Figure 69: Middle East and Africa Capecitabine Industry Revenue Share (%), by Country 2024 & 2032
- Figure 70: Middle East and Africa Capecitabine Industry Volume Share (%), by Country 2024 & 2032
- Figure 71: South America Capecitabine Industry Revenue (Million), by Indication 2024 & 2032
- Figure 72: South America Capecitabine Industry Volume (K Unit), by Indication 2024 & 2032
- Figure 73: South America Capecitabine Industry Revenue Share (%), by Indication 2024 & 2032
- Figure 74: South America Capecitabine Industry Volume Share (%), by Indication 2024 & 2032
- Figure 75: South America Capecitabine Industry Revenue (Million), by Distribution Channel 2024 & 2032
- Figure 76: South America Capecitabine Industry Volume (K Unit), by Distribution Channel 2024 & 2032
- Figure 77: South America Capecitabine Industry Revenue Share (%), by Distribution Channel 2024 & 2032
- Figure 78: South America Capecitabine Industry Volume Share (%), by Distribution Channel 2024 & 2032
- Figure 79: South America Capecitabine Industry Revenue (Million), by Country 2024 & 2032
- Figure 80: South America Capecitabine Industry Volume (K Unit), by Country 2024 & 2032
- Figure 81: South America Capecitabine Industry Revenue Share (%), by Country 2024 & 2032
- Figure 82: South America Capecitabine Industry Volume Share (%), by Country 2024 & 2032
List of Tables
- Table 1: Global Capecitabine Industry Revenue Million Forecast, by Region 2019 & 2032
- Table 2: Global Capecitabine Industry Volume K Unit Forecast, by Region 2019 & 2032
- Table 3: Global Capecitabine Industry Revenue Million Forecast, by Indication 2019 & 2032
- Table 4: Global Capecitabine Industry Volume K Unit Forecast, by Indication 2019 & 2032
- Table 5: Global Capecitabine Industry Revenue Million Forecast, by Distribution Channel 2019 & 2032
- Table 6: Global Capecitabine Industry Volume K Unit Forecast, by Distribution Channel 2019 & 2032
- Table 7: Global Capecitabine Industry Revenue Million Forecast, by Region 2019 & 2032
- Table 8: Global Capecitabine Industry Volume K Unit Forecast, by Region 2019 & 2032
- Table 9: Global Capecitabine Industry Revenue Million Forecast, by Country 2019 & 2032
- Table 10: Global Capecitabine Industry Volume K Unit Forecast, by Country 2019 & 2032
- Table 11: United States Capecitabine Industry Revenue (Million) Forecast, by Application 2019 & 2032
- Table 12: United States Capecitabine Industry Volume (K Unit) Forecast, by Application 2019 & 2032
- Table 13: Canada Capecitabine Industry Revenue (Million) Forecast, by Application 2019 & 2032
- Table 14: Canada Capecitabine Industry Volume (K Unit) Forecast, by Application 2019 & 2032
- Table 15: Mexico Capecitabine Industry Revenue (Million) Forecast, by Application 2019 & 2032
- Table 16: Mexico Capecitabine Industry Volume (K Unit) Forecast, by Application 2019 & 2032
- Table 17: Global Capecitabine Industry Revenue Million Forecast, by Country 2019 & 2032
- Table 18: Global Capecitabine Industry Volume K Unit Forecast, by Country 2019 & 2032
- Table 19: Germany Capecitabine Industry Revenue (Million) Forecast, by Application 2019 & 2032
- Table 20: Germany Capecitabine Industry Volume (K Unit) Forecast, by Application 2019 & 2032
- Table 21: United Kingdom Capecitabine Industry Revenue (Million) Forecast, by Application 2019 & 2032
- Table 22: United Kingdom Capecitabine Industry Volume (K Unit) Forecast, by Application 2019 & 2032
- Table 23: France Capecitabine Industry Revenue (Million) Forecast, by Application 2019 & 2032
- Table 24: France Capecitabine Industry Volume (K Unit) Forecast, by Application 2019 & 2032
- Table 25: Italy Capecitabine Industry Revenue (Million) Forecast, by Application 2019 & 2032
- Table 26: Italy Capecitabine Industry Volume (K Unit) Forecast, by Application 2019 & 2032
- Table 27: Spain Capecitabine Industry Revenue (Million) Forecast, by Application 2019 & 2032
- Table 28: Spain Capecitabine Industry Volume (K Unit) Forecast, by Application 2019 & 2032
- Table 29: Rest of Europe Capecitabine Industry Revenue (Million) Forecast, by Application 2019 & 2032
- Table 30: Rest of Europe Capecitabine Industry Volume (K Unit) Forecast, by Application 2019 & 2032
- Table 31: Global Capecitabine Industry Revenue Million Forecast, by Country 2019 & 2032
- Table 32: Global Capecitabine Industry Volume K Unit Forecast, by Country 2019 & 2032
- Table 33: China Capecitabine Industry Revenue (Million) Forecast, by Application 2019 & 2032
- Table 34: China Capecitabine Industry Volume (K Unit) Forecast, by Application 2019 & 2032
- Table 35: Japan Capecitabine Industry Revenue (Million) Forecast, by Application 2019 & 2032
- Table 36: Japan Capecitabine Industry Volume (K Unit) Forecast, by Application 2019 & 2032
- Table 37: India Capecitabine Industry Revenue (Million) Forecast, by Application 2019 & 2032
- Table 38: India Capecitabine Industry Volume (K Unit) Forecast, by Application 2019 & 2032
- Table 39: Australia Capecitabine Industry Revenue (Million) Forecast, by Application 2019 & 2032
- Table 40: Australia Capecitabine Industry Volume (K Unit) Forecast, by Application 2019 & 2032
- Table 41: South Korea Capecitabine Industry Revenue (Million) Forecast, by Application 2019 & 2032
- Table 42: South Korea Capecitabine Industry Volume (K Unit) Forecast, by Application 2019 & 2032
- Table 43: Rest of Asia Pacific Capecitabine Industry Revenue (Million) Forecast, by Application 2019 & 2032
- Table 44: Rest of Asia Pacific Capecitabine Industry Volume (K Unit) Forecast, by Application 2019 & 2032
- Table 45: Global Capecitabine Industry Revenue Million Forecast, by Country 2019 & 2032
- Table 46: Global Capecitabine Industry Volume K Unit Forecast, by Country 2019 & 2032
- Table 47: GCC Capecitabine Industry Revenue (Million) Forecast, by Application 2019 & 2032
- Table 48: GCC Capecitabine Industry Volume (K Unit) Forecast, by Application 2019 & 2032
- Table 49: South Africa Capecitabine Industry Revenue (Million) Forecast, by Application 2019 & 2032
- Table 50: South Africa Capecitabine Industry Volume (K Unit) Forecast, by Application 2019 & 2032
- Table 51: Rest of Middle East and Africa Capecitabine Industry Revenue (Million) Forecast, by Application 2019 & 2032
- Table 52: Rest of Middle East and Africa Capecitabine Industry Volume (K Unit) Forecast, by Application 2019 & 2032
- Table 53: Global Capecitabine Industry Revenue Million Forecast, by Country 2019 & 2032
- Table 54: Global Capecitabine Industry Volume K Unit Forecast, by Country 2019 & 2032
- Table 55: Brazil Capecitabine Industry Revenue (Million) Forecast, by Application 2019 & 2032
- Table 56: Brazil Capecitabine Industry Volume (K Unit) Forecast, by Application 2019 & 2032
- Table 57: Argentina Capecitabine Industry Revenue (Million) Forecast, by Application 2019 & 2032
- Table 58: Argentina Capecitabine Industry Volume (K Unit) Forecast, by Application 2019 & 2032
- Table 59: Rest of South America Capecitabine Industry Revenue (Million) Forecast, by Application 2019 & 2032
- Table 60: Rest of South America Capecitabine Industry Volume (K Unit) Forecast, by Application 2019 & 2032
- Table 61: Global Capecitabine Industry Revenue Million Forecast, by Indication 2019 & 2032
- Table 62: Global Capecitabine Industry Volume K Unit Forecast, by Indication 2019 & 2032
- Table 63: Global Capecitabine Industry Revenue Million Forecast, by Distribution Channel 2019 & 2032
- Table 64: Global Capecitabine Industry Volume K Unit Forecast, by Distribution Channel 2019 & 2032
- Table 65: Global Capecitabine Industry Revenue Million Forecast, by Country 2019 & 2032
- Table 66: Global Capecitabine Industry Volume K Unit Forecast, by Country 2019 & 2032
- Table 67: United States Capecitabine Industry Revenue (Million) Forecast, by Application 2019 & 2032
- Table 68: United States Capecitabine Industry Volume (K Unit) Forecast, by Application 2019 & 2032
- Table 69: Canada Capecitabine Industry Revenue (Million) Forecast, by Application 2019 & 2032
- Table 70: Canada Capecitabine Industry Volume (K Unit) Forecast, by Application 2019 & 2032
- Table 71: Mexico Capecitabine Industry Revenue (Million) Forecast, by Application 2019 & 2032
- Table 72: Mexico Capecitabine Industry Volume (K Unit) Forecast, by Application 2019 & 2032
- Table 73: Global Capecitabine Industry Revenue Million Forecast, by Indication 2019 & 2032
- Table 74: Global Capecitabine Industry Volume K Unit Forecast, by Indication 2019 & 2032
- Table 75: Global Capecitabine Industry Revenue Million Forecast, by Distribution Channel 2019 & 2032
- Table 76: Global Capecitabine Industry Volume K Unit Forecast, by Distribution Channel 2019 & 2032
- Table 77: Global Capecitabine Industry Revenue Million Forecast, by Country 2019 & 2032
- Table 78: Global Capecitabine Industry Volume K Unit Forecast, by Country 2019 & 2032
- Table 79: Germany Capecitabine Industry Revenue (Million) Forecast, by Application 2019 & 2032
- Table 80: Germany Capecitabine Industry Volume (K Unit) Forecast, by Application 2019 & 2032
- Table 81: United Kingdom Capecitabine Industry Revenue (Million) Forecast, by Application 2019 & 2032
- Table 82: United Kingdom Capecitabine Industry Volume (K Unit) Forecast, by Application 2019 & 2032
- Table 83: France Capecitabine Industry Revenue (Million) Forecast, by Application 2019 & 2032
- Table 84: France Capecitabine Industry Volume (K Unit) Forecast, by Application 2019 & 2032
- Table 85: Italy Capecitabine Industry Revenue (Million) Forecast, by Application 2019 & 2032
- Table 86: Italy Capecitabine Industry Volume (K Unit) Forecast, by Application 2019 & 2032
- Table 87: Spain Capecitabine Industry Revenue (Million) Forecast, by Application 2019 & 2032
- Table 88: Spain Capecitabine Industry Volume (K Unit) Forecast, by Application 2019 & 2032
- Table 89: Rest of Europe Capecitabine Industry Revenue (Million) Forecast, by Application 2019 & 2032
- Table 90: Rest of Europe Capecitabine Industry Volume (K Unit) Forecast, by Application 2019 & 2032
- Table 91: Global Capecitabine Industry Revenue Million Forecast, by Indication 2019 & 2032
- Table 92: Global Capecitabine Industry Volume K Unit Forecast, by Indication 2019 & 2032
- Table 93: Global Capecitabine Industry Revenue Million Forecast, by Distribution Channel 2019 & 2032
- Table 94: Global Capecitabine Industry Volume K Unit Forecast, by Distribution Channel 2019 & 2032
- Table 95: Global Capecitabine Industry Revenue Million Forecast, by Country 2019 & 2032
- Table 96: Global Capecitabine Industry Volume K Unit Forecast, by Country 2019 & 2032
- Table 97: China Capecitabine Industry Revenue (Million) Forecast, by Application 2019 & 2032
- Table 98: China Capecitabine Industry Volume (K Unit) Forecast, by Application 2019 & 2032
- Table 99: Japan Capecitabine Industry Revenue (Million) Forecast, by Application 2019 & 2032
- Table 100: Japan Capecitabine Industry Volume (K Unit) Forecast, by Application 2019 & 2032
- Table 101: India Capecitabine Industry Revenue (Million) Forecast, by Application 2019 & 2032
- Table 102: India Capecitabine Industry Volume (K Unit) Forecast, by Application 2019 & 2032
- Table 103: Australia Capecitabine Industry Revenue (Million) Forecast, by Application 2019 & 2032
- Table 104: Australia Capecitabine Industry Volume (K Unit) Forecast, by Application 2019 & 2032
- Table 105: South Korea Capecitabine Industry Revenue (Million) Forecast, by Application 2019 & 2032
- Table 106: South Korea Capecitabine Industry Volume (K Unit) Forecast, by Application 2019 & 2032
- Table 107: Rest of Asia Pacific Capecitabine Industry Revenue (Million) Forecast, by Application 2019 & 2032
- Table 108: Rest of Asia Pacific Capecitabine Industry Volume (K Unit) Forecast, by Application 2019 & 2032
- Table 109: Global Capecitabine Industry Revenue Million Forecast, by Indication 2019 & 2032
- Table 110: Global Capecitabine Industry Volume K Unit Forecast, by Indication 2019 & 2032
- Table 111: Global Capecitabine Industry Revenue Million Forecast, by Distribution Channel 2019 & 2032
- Table 112: Global Capecitabine Industry Volume K Unit Forecast, by Distribution Channel 2019 & 2032
- Table 113: Global Capecitabine Industry Revenue Million Forecast, by Country 2019 & 2032
- Table 114: Global Capecitabine Industry Volume K Unit Forecast, by Country 2019 & 2032
- Table 115: GCC Capecitabine Industry Revenue (Million) Forecast, by Application 2019 & 2032
- Table 116: GCC Capecitabine Industry Volume (K Unit) Forecast, by Application 2019 & 2032
- Table 117: South Africa Capecitabine Industry Revenue (Million) Forecast, by Application 2019 & 2032
- Table 118: South Africa Capecitabine Industry Volume (K Unit) Forecast, by Application 2019 & 2032
- Table 119: Rest of Middle East and Africa Capecitabine Industry Revenue (Million) Forecast, by Application 2019 & 2032
- Table 120: Rest of Middle East and Africa Capecitabine Industry Volume (K Unit) Forecast, by Application 2019 & 2032
- Table 121: Global Capecitabine Industry Revenue Million Forecast, by Indication 2019 & 2032
- Table 122: Global Capecitabine Industry Volume K Unit Forecast, by Indication 2019 & 2032
- Table 123: Global Capecitabine Industry Revenue Million Forecast, by Distribution Channel 2019 & 2032
- Table 124: Global Capecitabine Industry Volume K Unit Forecast, by Distribution Channel 2019 & 2032
- Table 125: Global Capecitabine Industry Revenue Million Forecast, by Country 2019 & 2032
- Table 126: Global Capecitabine Industry Volume K Unit Forecast, by Country 2019 & 2032
- Table 127: Brazil Capecitabine Industry Revenue (Million) Forecast, by Application 2019 & 2032
- Table 128: Brazil Capecitabine Industry Volume (K Unit) Forecast, by Application 2019 & 2032
- Table 129: Argentina Capecitabine Industry Revenue (Million) Forecast, by Application 2019 & 2032
- Table 130: Argentina Capecitabine Industry Volume (K Unit) Forecast, by Application 2019 & 2032
- Table 131: Rest of South America Capecitabine Industry Revenue (Million) Forecast, by Application 2019 & 2032
- Table 132: Rest of South America Capecitabine Industry Volume (K Unit) Forecast, by Application 2019 & 2032
Frequently Asked Questions
1. What is the projected Compound Annual Growth Rate (CAGR) of the Capecitabine Industry?
The projected CAGR is approximately 5.50%.
2. Which companies are prominent players in the Capecitabine Industry?
Key companies in the market include F Hoffmann-La Roche AG (Genentech Inc ), Teva Pharmaceuticals Inc, Cipla Inc, Hikma Pharmaceuticals PLC, Intas Pharmaceuticals Limited, Fresenius SE & Co KGaA, Armas Pharmaceuticals Inc, Sun Pharmaceutical Industries Limited, Dr Reddy's Laboratories Ltd, Mylan N V.
3. What are the main segments of the Capecitabine Industry?
The market segments include Indication, Distribution Channel.
4. Can you provide details about the market size?
The market size is estimated to be USD XX Million as of 2022.
5. What are some drivers contributing to market growth?
; Rising Government Initiatives to Control Growing Global Cancer Burden; Increasing Incidence of Cancers Around the World.
6. What are the notable trends driving market growth?
Breast Cancer by Indication is Expected to Hold the Largest Market Share in the Global Capecitabine Market.
7. Are there any restraints impacting market growth?
; Highly Expensive Products and Treatment; Rising Adoption of Substitutes like Raltitrexed. Irinotecan and Leucovorin for Adjuvant Therapy.
8. Can you provide examples of recent developments in the market?
N/A
9. What pricing options are available for accessing the report?
Pricing options include single-user, multi-user, and enterprise licenses priced at USD 4750, USD 5250, and USD 8750 respectively.
10. Is the market size provided in terms of value or volume?
The market size is provided in terms of value, measured in Million and volume, measured in K Unit.
11. Are there any specific market keywords associated with the report?
Yes, the market keyword associated with the report is "Capecitabine Industry," which aids in identifying and referencing the specific market segment covered.
12. How do I determine which pricing option suits my needs best?
The pricing options vary based on user requirements and access needs. Individual users may opt for single-user licenses, while businesses requiring broader access may choose multi-user or enterprise licenses for cost-effective access to the report.
13. Are there any additional resources or data provided in the Capecitabine Industry report?
While the report offers comprehensive insights, it's advisable to review the specific contents or supplementary materials provided to ascertain if additional resources or data are available.
14. How can I stay updated on further developments or reports in the Capecitabine Industry?
To stay informed about further developments, trends, and reports in the Capecitabine Industry, consider subscribing to industry newsletters, following relevant companies and organizations, or regularly checking reputable industry news sources and publications.
Methodology
Step 1 - Identification of Relevant Samples Size from Population Database


Step 2 - Approaches for Defining Global Market Size (Value, Volume* & Price*)

Note*: In applicable scenarios
Step 3 - Data Sources
Primary Research
- Web Analytics
- Survey Reports
- Research Institute
- Latest Research Reports
- Opinion Leaders
Secondary Research
- Annual Reports
- White Paper
- Latest Press Release
- Industry Association
- Paid Database
- Investor Presentations

Step 4 - Data Triangulation
Involves using different sources of information in order to increase the validity of a study
These sources are likely to be stakeholders in a program - participants, other researchers, program staff, other community members, and so on.
Then we put all data in single framework & apply various statistical tools to find out the dynamic on the market.
During the analysis stage, feedback from the stakeholder groups would be compared to determine areas of agreement as well as areas of divergence
