

Key Insights
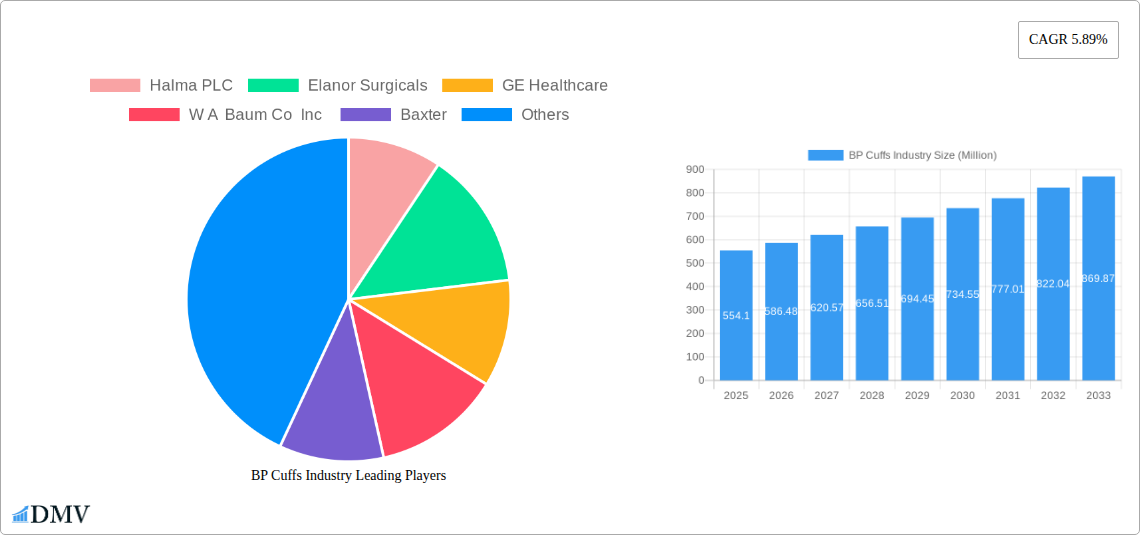
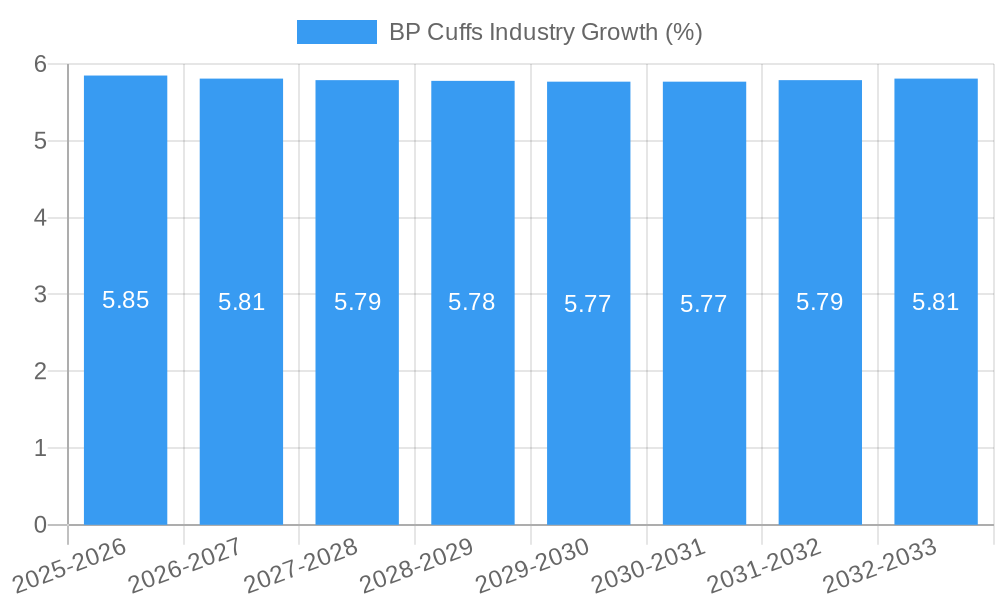
The global BP cuffs market is projected to reach a substantial size, estimated at USD 554.10 million in 2025. This growth is fueled by an anticipated Compound Annual Growth Rate (CAGR) of 5.89% over the forecast period from 2025 to 2033. This upward trajectory is largely driven by the increasing prevalence of cardiovascular diseases worldwide, necessitating continuous monitoring and management of blood pressure. Furthermore, the growing awareness among individuals about proactive health management and the rising demand for home healthcare solutions are significant contributors to market expansion. The technological advancements in BP cuff design, leading to more accurate, user-friendly, and connected devices, are also playing a crucial role in stimulating market demand. The shift towards automated BP cuffs, offering convenience and enhanced precision compared to manual counterparts, is a prominent trend shaping product development and consumer preference.
The market is segmented across various applications and user types, highlighting its diverse reach. Reusable BP cuffs are expected to maintain a strong presence due to their cost-effectiveness and environmental benefits in clinical settings, while disposable variants cater to hygiene-conscious environments and specific medical needs. In terms of product type, automated BP cuffs are poised for significant growth, driven by their adoption in both professional healthcare facilities like hospitals and clinics, and by individual consumers for home use. This segment benefits from the integration of smart technologies, allowing for seamless data logging and remote patient monitoring. The increasing focus on preventative healthcare and the aging global population, which is more susceptible to hypertension, further solidify the market's positive outlook. Major players are actively investing in research and development to innovate and expand their product portfolios, aiming to capture a larger share of this burgeoning market.
BP Cuffs Industry Market Composition & Trends
This comprehensive report delves into the dynamic BP Cuffs Industry, providing an in-depth analysis of its market composition, key trends, and future trajectory from 2019 to 2033. With a base year of 2025 and a robust forecast period extending to 2033, this study offers actionable insights for stakeholders. The market exhibits a moderate concentration, with key players like Halma PLC, GE Healthcare, Baxter, Cardinal Health, Koninklijke Philips NV, and Omron Healthcare Inc. holding significant shares, estimated at around XX Million in market value for the historical period. Innovation remains a crucial catalyst, driven by advancements in automated BP cuff technology and the increasing demand for user-friendly, portable devices. The regulatory landscape, while generally supportive of healthcare device innovation, presents varying compliance requirements across regions, influencing market entry and product development strategies. Substitute products, such as non-cuff-based blood pressure monitoring devices, are emerging but currently represent a niche segment. End-user profiles are diverse, encompassing hospitals, clinics, and a growing "other end users" category that includes home healthcare providers and individual consumers. Mergers and acquisition activities are a notable trend, with an estimated XX Million in deal values observed historically, as companies seek to consolidate market position and expand their product portfolios.
- Market Share Distribution: Dominant players collectively hold an estimated XX% of the market.
- M&A Deal Values: Historical M&A activity is valued at approximately XX Million.
- Innovation Focus: Advancements in automated, connected, and smart BP cuffs.
- Regulatory Environment: Varying compliance, driving regional strategy.
- End-User Segmentation: Hospitals, Clinics, and Home-based users are key segments.
BP Cuffs Industry Industry Evolution
The BP Cuffs Industry has witnessed remarkable evolution, driven by technological advancements, shifting consumer demands, and a growing emphasis on preventative healthcare. Over the study period from 2019 to 2033, the industry has experienced a compound annual growth rate (CAGR) of approximately XX%, translating to a market value of over XX Million in the base year 2025. This growth trajectory is fueled by the increasing prevalence of hypertension globally, prompting a greater need for accurate and accessible blood pressure monitoring solutions. Technological innovations have been paramount, with a significant shift from traditional manual BP cuffs to sophisticated automated and smart devices. These advancements include features like Bluetooth connectivity for data syncing, AI-powered analysis, and user-friendly interfaces, enhancing patient engagement and enabling remote patient monitoring.
Consumer demand has also played a pivotal role, with a rising preference for home-based monitoring solutions that offer convenience and empower individuals to take proactive control of their health. The COVID-19 pandemic further accelerated this trend, highlighting the importance of remote healthcare solutions and the ability to monitor vital signs without frequent clinic visits. This has led to increased adoption of disposable BP cuffs for hygiene and convenience in clinical settings, while reusable cuffs continue to be favored for their cost-effectiveness and durability in long-term patient care. The industry's evolution is characterized by a continuous pursuit of accuracy, reliability, and user-centric design, ensuring that BP cuffs remain an indispensable tool in managing cardiovascular health. The market is projected to reach an estimated XX Million by the end of the forecast period in 2033, underscoring its sustained growth potential.
Leading Regions, Countries, or Segments in BP Cuffs Industry
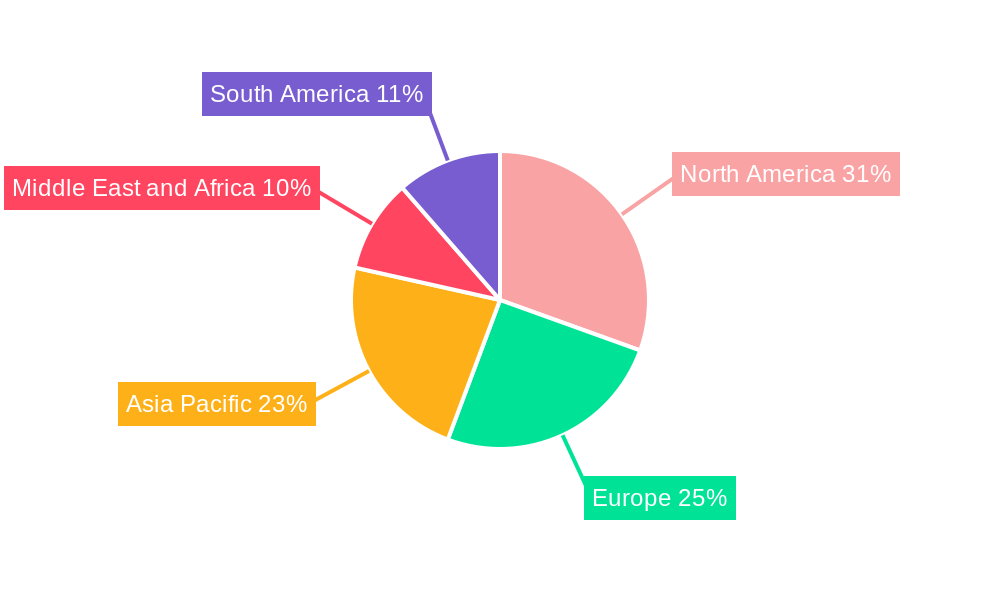
The global BP Cuffs Industry landscape is characterized by distinct regional strengths and segment dominance, driven by a confluence of factors including healthcare infrastructure, disposable income, regulatory frameworks, and technological adoption rates. North America, particularly the United States, currently leads the market, driven by a high prevalence of cardiovascular diseases, advanced healthcare infrastructure, and a strong emphasis on home healthcare. The region's market share is estimated at a significant XX% of the global total.
Within the Usage segment, both Reusable and Disposable BP cuffs command substantial market presence. Reusable cuffs, often favored in hospitals and clinics for their long-term cost-effectiveness and durability, represent a significant portion of the market, estimated at XX Million in sales for the base year. Disposable cuffs, on the other hand, are experiencing rapid growth due to increasing hygiene concerns, especially in clinical settings and for home use, contributing an estimated XX Million.
In terms of Product Type, Automated BP cuffs are increasingly dominating the market, outpacing Manual BP cuffs. The convenience, accuracy, and data-logging capabilities of automated devices, essential for continuous monitoring and telemedicine, have propelled their adoption. The market for automated cuffs is valued at approximately XX Million, while manual cuffs contribute an estimated XX Million.
The End User segment sees Hospitals as the primary consumers, accounting for a considerable market share due to high patient volume and the need for reliable monitoring equipment, contributing an estimated XX Million. Clinics follow closely, with an estimated XX Million in market value. The "Other End Users" segment, encompassing home healthcare agencies, individual consumers, and wellness centers, is experiencing the most dynamic growth, projected to expand at a CAGR of XX% over the forecast period, reaching an estimated XX Million.
- Dominant Region: North America, with a XX% market share.
- Key Drivers: High cardiovascular disease rates, advanced healthcare, strong home healthcare market.
- Leading Usage Segment: Both Reusable (XX Million) and Disposable (XX Million) hold strong positions, with Disposable showing higher growth potential.
- Key Drivers: Hygiene, cost-effectiveness, patient preference.
- Leading Product Type: Automated BP Cuffs (XX Million) are increasingly favored over Manual BP Cuffs (XX Million).
- Key Drivers: Convenience, accuracy, data integration, telemedicine compatibility.
- Leading End User Segment: Hospitals (XX Million) are the largest consumers, followed by Clinics (XX Million). The "Other End Users" segment is the fastest-growing.
- Key Drivers: Patient volume, remote monitoring needs, growing health consciousness.
BP Cuffs Industry Product Innovations
The BP Cuffs Industry is witnessing a surge in product innovations, transforming how blood pressure is monitored. Companies are focusing on enhancing accuracy, portability, and connectivity. Smart BP cuffs are now integrating advanced algorithms for more precise readings, often with AI-driven insights into cardiovascular health trends. Features like adjustable cuffs, as exemplified by Garmin's September 2022 launch, are improving user comfort and ensuring accurate measurements for a wider range of users. Furthermore, one-touch automatic blood pressure cuff monitors, like Inbody's February 2022 release, are simplifying self-monitoring, making it more accessible for individuals managing chronic conditions at home. These innovations are not just about convenience; they are about empowering individuals with actionable health data and facilitating proactive healthcare management, with an estimated XX Million invested in R&D annually.
Propelling Factors for BP Cuffs Industry Growth
Several critical factors are propelling the growth of the BP Cuffs Industry. The escalating global prevalence of hypertension and other cardiovascular diseases is a primary driver, increasing the demand for reliable monitoring devices. Technological advancements, particularly in automated and smart BP cuff technology, offering enhanced accuracy, portability, and data connectivity for remote patient monitoring, are significantly boosting market expansion. Furthermore, a growing awareness among individuals regarding the importance of regular blood pressure checks for preventative healthcare, coupled with the increasing adoption of home healthcare solutions, is creating a robust market demand. Government initiatives promoting public health and the digitalization of healthcare services further support this upward trend.
Obstacles in the BP Cuffs Industry Market
Despite robust growth, the BP Cuffs Industry faces several obstacles. Stringent regulatory approvals and compliance requirements in different regions can pose significant hurdles for new product launches and market entry, leading to extended development timelines and increased costs. Supply chain disruptions, as experienced globally in recent years, can impact the availability of raw materials and components, potentially affecting production volumes and lead times. Furthermore, the competitive landscape, characterized by the presence of numerous established players and emerging innovators, exerts pressure on pricing strategies and profit margins. The initial cost of advanced automated and smart BP cuffs can also be a deterrent for some price-sensitive consumer segments, particularly in developing economies.
Future Opportunities in BP Cuffs Industry
The future of the BP Cuffs Industry is brimming with opportunities. The expanding wearable technology market presents a significant avenue for integrating advanced BP monitoring into smartwatches and other personal devices, offering seamless and continuous health tracking. The growing demand for telehealth and remote patient monitoring solutions creates a substantial market for connected BP cuffs that can transmit data directly to healthcare providers. Emerging markets in Asia-Pacific and Africa, with their rapidly growing populations and increasing focus on healthcare infrastructure development, offer considerable untapped potential. Furthermore, innovations in cuffless blood pressure monitoring technology, if proven accurate and reliable, could revolutionize the market.
Major Players in the BP Cuffs Industry Ecosystem
- Halma PLC
- Elanor Surgicals
- GE Healthcare
- W A Baum Co Inc
- Baxter
- Spengler SAS
- Cardinal Health
- Koninklijke Philips NV
- Omron Healthcare Inc
- Spacelabs Healthcare
- American Diagnostic Corporation
- Medline Industries Inc
Key Developments in BP Cuffs Industry Industry
- September 2022: Garmin launched a smart blood pressure monitor with adjustable cuffs, enabling users to measure systolic and diastolic blood pressure at home and on the go. This development caters to the growing demand for portable and user-friendly health monitoring devices.
- February 2022: Inbody introduced the new BP 170 one-touch automatic blood pressure cuff monitor, offering individuals the option to self-record and track key health metrics at home. This innovation simplifies blood pressure monitoring for home users, enhancing self-care.
Strategic BP Cuffs Industry Market Forecast
The BP Cuffs Industry is poised for substantial growth, driven by an increasing global health consciousness and a surge in cardiovascular ailments. The forecast period from 2025 to 2033 is expected to witness a robust CAGR of approximately XX%, with the market value projected to reach over XX Million by 2033. Key growth catalysts include the continuous innovation in automated and smart BP cuffs, enhancing accuracy and user experience, and the expanding adoption of home healthcare and telemedicine services. The increasing demand for connected devices that facilitate remote patient monitoring and data sharing with healthcare providers will further fuel market expansion, creating significant opportunities for stakeholders.
BP Cuffs Industry Segmentation
-
1. Usage
- 1.1. Reusable
- 1.2. Disposable
-
2. Product Type
- 2.1. Manual
- 2.2. Automated
-
3. End User
- 3.1. Hospitals
- 3.2. Clinics
- 3.3. Other End Users
BP Cuffs Industry Segmentation By Geography
-
1. North America
- 1.1. United States
- 1.2. Canada
- 1.3. Mexico
-
2. Europe
- 2.1. Germany
- 2.2. United Kingdom
- 2.3. France
- 2.4. Italy
- 2.5. Spain
- 2.6. Rest of Europe
-
3. Asia Pacific
- 3.1. China
- 3.2. Japan
- 3.3. India
- 3.4. Australia
- 3.5. South Korea
- 3.6. Rest of Asia Pacific
-
4. Middle East and Africa
- 4.1. GCC
- 4.2. South Africa
- 4.3. Rest of Middle East and Africa
-
5. South America
- 5.1. Brazil
- 5.2. Argentina
- 5.3. Rest of South America
BP Cuffs Industry REPORT HIGHLIGHTS
| Aspects | Details |
|---|---|
| Study Period | 2019-2033 |
| Base Year | 2024 |
| Estimated Year | 2025 |
| Forecast Period | 2025-2033 |
| Historical Period | 2019-2024 |
| Growth Rate | CAGR of 5.89% from 2019-2033 |
| Segmentation |
|
Table of Contents
- 1. Introduction
- 1.1. Research Scope
- 1.2. Market Segmentation
- 1.3. Research Methodology
- 1.4. Definitions and Assumptions
- 2. Executive Summary
- 2.1. Introduction
- 3. Market Dynamics
- 3.1. Introduction
- 3.2. Market Drivers
- 3.2.1. Increasing Prevalence of Hypertension; Growing Demand for Blood Monitoring Devices
- 3.3. Market Restrains
- 3.3.1. Threat of Infection from Reusable BP Cuffs
- 3.4. Market Trends
- 3.4.1. Automated Blood Pressure Cuffs Segment is Expected to Hold a Significant Market Share Over the Forecast Period
- 4. Market Factor Analysis
- 4.1. Porters Five Forces
- 4.2. Supply/Value Chain
- 4.3. PESTEL analysis
- 4.4. Market Entropy
- 4.5. Patent/Trademark Analysis
- 5. Global BP Cuffs Industry Analysis, Insights and Forecast, 2019-2031
- 5.1. Market Analysis, Insights and Forecast - by Usage
- 5.1.1. Reusable
- 5.1.2. Disposable
- 5.2. Market Analysis, Insights and Forecast - by Product Type
- 5.2.1. Manual
- 5.2.2. Automated
- 5.3. Market Analysis, Insights and Forecast - by End User
- 5.3.1. Hospitals
- 5.3.2. Clinics
- 5.3.3. Other End Users
- 5.4. Market Analysis, Insights and Forecast - by Region
- 5.4.1. North America
- 5.4.2. Europe
- 5.4.3. Asia Pacific
- 5.4.4. Middle East and Africa
- 5.4.5. South America
- 5.1. Market Analysis, Insights and Forecast - by Usage
- 6. North America BP Cuffs Industry Analysis, Insights and Forecast, 2019-2031
- 6.1. Market Analysis, Insights and Forecast - by Usage
- 6.1.1. Reusable
- 6.1.2. Disposable
- 6.2. Market Analysis, Insights and Forecast - by Product Type
- 6.2.1. Manual
- 6.2.2. Automated
- 6.3. Market Analysis, Insights and Forecast - by End User
- 6.3.1. Hospitals
- 6.3.2. Clinics
- 6.3.3. Other End Users
- 6.1. Market Analysis, Insights and Forecast - by Usage
- 7. Europe BP Cuffs Industry Analysis, Insights and Forecast, 2019-2031
- 7.1. Market Analysis, Insights and Forecast - by Usage
- 7.1.1. Reusable
- 7.1.2. Disposable
- 7.2. Market Analysis, Insights and Forecast - by Product Type
- 7.2.1. Manual
- 7.2.2. Automated
- 7.3. Market Analysis, Insights and Forecast - by End User
- 7.3.1. Hospitals
- 7.3.2. Clinics
- 7.3.3. Other End Users
- 7.1. Market Analysis, Insights and Forecast - by Usage
- 8. Asia Pacific BP Cuffs Industry Analysis, Insights and Forecast, 2019-2031
- 8.1. Market Analysis, Insights and Forecast - by Usage
- 8.1.1. Reusable
- 8.1.2. Disposable
- 8.2. Market Analysis, Insights and Forecast - by Product Type
- 8.2.1. Manual
- 8.2.2. Automated
- 8.3. Market Analysis, Insights and Forecast - by End User
- 8.3.1. Hospitals
- 8.3.2. Clinics
- 8.3.3. Other End Users
- 8.1. Market Analysis, Insights and Forecast - by Usage
- 9. Middle East and Africa BP Cuffs Industry Analysis, Insights and Forecast, 2019-2031
- 9.1. Market Analysis, Insights and Forecast - by Usage
- 9.1.1. Reusable
- 9.1.2. Disposable
- 9.2. Market Analysis, Insights and Forecast - by Product Type
- 9.2.1. Manual
- 9.2.2. Automated
- 9.3. Market Analysis, Insights and Forecast - by End User
- 9.3.1. Hospitals
- 9.3.2. Clinics
- 9.3.3. Other End Users
- 9.1. Market Analysis, Insights and Forecast - by Usage
- 10. South America BP Cuffs Industry Analysis, Insights and Forecast, 2019-2031
- 10.1. Market Analysis, Insights and Forecast - by Usage
- 10.1.1. Reusable
- 10.1.2. Disposable
- 10.2. Market Analysis, Insights and Forecast - by Product Type
- 10.2.1. Manual
- 10.2.2. Automated
- 10.3. Market Analysis, Insights and Forecast - by End User
- 10.3.1. Hospitals
- 10.3.2. Clinics
- 10.3.3. Other End Users
- 10.1. Market Analysis, Insights and Forecast - by Usage
- 11. North America BP Cuffs Industry Analysis, Insights and Forecast, 2019-2031
- 11.1. Market Analysis, Insights and Forecast - By Country/Sub-region
- 11.1.1 United States
- 11.1.2 Canada
- 11.1.3 Mexico
- 12. Europe BP Cuffs Industry Analysis, Insights and Forecast, 2019-2031
- 12.1. Market Analysis, Insights and Forecast - By Country/Sub-region
- 12.1.1 Germany
- 12.1.2 United Kingdom
- 12.1.3 France
- 12.1.4 Italy
- 12.1.5 Spain
- 12.1.6 Rest of Europe
- 13. Asia Pacific BP Cuffs Industry Analysis, Insights and Forecast, 2019-2031
- 13.1. Market Analysis, Insights and Forecast - By Country/Sub-region
- 13.1.1 China
- 13.1.2 Japan
- 13.1.3 India
- 13.1.4 Australia
- 13.1.5 South Korea
- 13.1.6 Rest of Asia Pacific
- 14. Middle East and Africa BP Cuffs Industry Analysis, Insights and Forecast, 2019-2031
- 14.1. Market Analysis, Insights and Forecast - By Country/Sub-region
- 14.1.1 GCC
- 14.1.2 South Africa
- 14.1.3 Rest of Middle East and Africa
- 15. South America BP Cuffs Industry Analysis, Insights and Forecast, 2019-2031
- 15.1. Market Analysis, Insights and Forecast - By Country/Sub-region
- 15.1.1 Brazil
- 15.1.2 Argentina
- 15.1.3 Rest of South America
- 16. Competitive Analysis
- 16.1. Global Market Share Analysis 2024
- 16.2. Company Profiles
- 16.2.1 Halma PLC
- 16.2.1.1. Overview
- 16.2.1.2. Products
- 16.2.1.3. SWOT Analysis
- 16.2.1.4. Recent Developments
- 16.2.1.5. Financials (Based on Availability)
- 16.2.2 Elanor Surgicals
- 16.2.2.1. Overview
- 16.2.2.2. Products
- 16.2.2.3. SWOT Analysis
- 16.2.2.4. Recent Developments
- 16.2.2.5. Financials (Based on Availability)
- 16.2.3 GE Healthcare
- 16.2.3.1. Overview
- 16.2.3.2. Products
- 16.2.3.3. SWOT Analysis
- 16.2.3.4. Recent Developments
- 16.2.3.5. Financials (Based on Availability)
- 16.2.4 W A Baum Co Inc
- 16.2.4.1. Overview
- 16.2.4.2. Products
- 16.2.4.3. SWOT Analysis
- 16.2.4.4. Recent Developments
- 16.2.4.5. Financials (Based on Availability)
- 16.2.5 Baxter
- 16.2.5.1. Overview
- 16.2.5.2. Products
- 16.2.5.3. SWOT Analysis
- 16.2.5.4. Recent Developments
- 16.2.5.5. Financials (Based on Availability)
- 16.2.6 Spengler SAS
- 16.2.6.1. Overview
- 16.2.6.2. Products
- 16.2.6.3. SWOT Analysis
- 16.2.6.4. Recent Developments
- 16.2.6.5. Financials (Based on Availability)
- 16.2.7 Cardinal Health
- 16.2.7.1. Overview
- 16.2.7.2. Products
- 16.2.7.3. SWOT Analysis
- 16.2.7.4. Recent Developments
- 16.2.7.5. Financials (Based on Availability)
- 16.2.8 Koninklijke Philips NV
- 16.2.8.1. Overview
- 16.2.8.2. Products
- 16.2.8.3. SWOT Analysis
- 16.2.8.4. Recent Developments
- 16.2.8.5. Financials (Based on Availability)
- 16.2.9 Omron Healthcare Inc
- 16.2.9.1. Overview
- 16.2.9.2. Products
- 16.2.9.3. SWOT Analysis
- 16.2.9.4. Recent Developments
- 16.2.9.5. Financials (Based on Availability)
- 16.2.10 Spacelabs Healthcare
- 16.2.10.1. Overview
- 16.2.10.2. Products
- 16.2.10.3. SWOT Analysis
- 16.2.10.4. Recent Developments
- 16.2.10.5. Financials (Based on Availability)
- 16.2.11 American Diagnostic Corporation
- 16.2.11.1. Overview
- 16.2.11.2. Products
- 16.2.11.3. SWOT Analysis
- 16.2.11.4. Recent Developments
- 16.2.11.5. Financials (Based on Availability)
- 16.2.12 Medline Industries Inc
- 16.2.12.1. Overview
- 16.2.12.2. Products
- 16.2.12.3. SWOT Analysis
- 16.2.12.4. Recent Developments
- 16.2.12.5. Financials (Based on Availability)
- 16.2.1 Halma PLC
List of Figures
- Figure 1: Global BP Cuffs Industry Revenue Breakdown (Million, %) by Region 2024 & 2032
- Figure 2: Global BP Cuffs Industry Volume Breakdown (K Unit, %) by Region 2024 & 2032
- Figure 3: North America BP Cuffs Industry Revenue (Million), by Country 2024 & 2032
- Figure 4: North America BP Cuffs Industry Volume (K Unit), by Country 2024 & 2032
- Figure 5: North America BP Cuffs Industry Revenue Share (%), by Country 2024 & 2032
- Figure 6: North America BP Cuffs Industry Volume Share (%), by Country 2024 & 2032
- Figure 7: Europe BP Cuffs Industry Revenue (Million), by Country 2024 & 2032
- Figure 8: Europe BP Cuffs Industry Volume (K Unit), by Country 2024 & 2032
- Figure 9: Europe BP Cuffs Industry Revenue Share (%), by Country 2024 & 2032
- Figure 10: Europe BP Cuffs Industry Volume Share (%), by Country 2024 & 2032
- Figure 11: Asia Pacific BP Cuffs Industry Revenue (Million), by Country 2024 & 2032
- Figure 12: Asia Pacific BP Cuffs Industry Volume (K Unit), by Country 2024 & 2032
- Figure 13: Asia Pacific BP Cuffs Industry Revenue Share (%), by Country 2024 & 2032
- Figure 14: Asia Pacific BP Cuffs Industry Volume Share (%), by Country 2024 & 2032
- Figure 15: Middle East and Africa BP Cuffs Industry Revenue (Million), by Country 2024 & 2032
- Figure 16: Middle East and Africa BP Cuffs Industry Volume (K Unit), by Country 2024 & 2032
- Figure 17: Middle East and Africa BP Cuffs Industry Revenue Share (%), by Country 2024 & 2032
- Figure 18: Middle East and Africa BP Cuffs Industry Volume Share (%), by Country 2024 & 2032
- Figure 19: South America BP Cuffs Industry Revenue (Million), by Country 2024 & 2032
- Figure 20: South America BP Cuffs Industry Volume (K Unit), by Country 2024 & 2032
- Figure 21: South America BP Cuffs Industry Revenue Share (%), by Country 2024 & 2032
- Figure 22: South America BP Cuffs Industry Volume Share (%), by Country 2024 & 2032
- Figure 23: North America BP Cuffs Industry Revenue (Million), by Usage 2024 & 2032
- Figure 24: North America BP Cuffs Industry Volume (K Unit), by Usage 2024 & 2032
- Figure 25: North America BP Cuffs Industry Revenue Share (%), by Usage 2024 & 2032
- Figure 26: North America BP Cuffs Industry Volume Share (%), by Usage 2024 & 2032
- Figure 27: North America BP Cuffs Industry Revenue (Million), by Product Type 2024 & 2032
- Figure 28: North America BP Cuffs Industry Volume (K Unit), by Product Type 2024 & 2032
- Figure 29: North America BP Cuffs Industry Revenue Share (%), by Product Type 2024 & 2032
- Figure 30: North America BP Cuffs Industry Volume Share (%), by Product Type 2024 & 2032
- Figure 31: North America BP Cuffs Industry Revenue (Million), by End User 2024 & 2032
- Figure 32: North America BP Cuffs Industry Volume (K Unit), by End User 2024 & 2032
- Figure 33: North America BP Cuffs Industry Revenue Share (%), by End User 2024 & 2032
- Figure 34: North America BP Cuffs Industry Volume Share (%), by End User 2024 & 2032
- Figure 35: North America BP Cuffs Industry Revenue (Million), by Country 2024 & 2032
- Figure 36: North America BP Cuffs Industry Volume (K Unit), by Country 2024 & 2032
- Figure 37: North America BP Cuffs Industry Revenue Share (%), by Country 2024 & 2032
- Figure 38: North America BP Cuffs Industry Volume Share (%), by Country 2024 & 2032
- Figure 39: Europe BP Cuffs Industry Revenue (Million), by Usage 2024 & 2032
- Figure 40: Europe BP Cuffs Industry Volume (K Unit), by Usage 2024 & 2032
- Figure 41: Europe BP Cuffs Industry Revenue Share (%), by Usage 2024 & 2032
- Figure 42: Europe BP Cuffs Industry Volume Share (%), by Usage 2024 & 2032
- Figure 43: Europe BP Cuffs Industry Revenue (Million), by Product Type 2024 & 2032
- Figure 44: Europe BP Cuffs Industry Volume (K Unit), by Product Type 2024 & 2032
- Figure 45: Europe BP Cuffs Industry Revenue Share (%), by Product Type 2024 & 2032
- Figure 46: Europe BP Cuffs Industry Volume Share (%), by Product Type 2024 & 2032
- Figure 47: Europe BP Cuffs Industry Revenue (Million), by End User 2024 & 2032
- Figure 48: Europe BP Cuffs Industry Volume (K Unit), by End User 2024 & 2032
- Figure 49: Europe BP Cuffs Industry Revenue Share (%), by End User 2024 & 2032
- Figure 50: Europe BP Cuffs Industry Volume Share (%), by End User 2024 & 2032
- Figure 51: Europe BP Cuffs Industry Revenue (Million), by Country 2024 & 2032
- Figure 52: Europe BP Cuffs Industry Volume (K Unit), by Country 2024 & 2032
- Figure 53: Europe BP Cuffs Industry Revenue Share (%), by Country 2024 & 2032
- Figure 54: Europe BP Cuffs Industry Volume Share (%), by Country 2024 & 2032
- Figure 55: Asia Pacific BP Cuffs Industry Revenue (Million), by Usage 2024 & 2032
- Figure 56: Asia Pacific BP Cuffs Industry Volume (K Unit), by Usage 2024 & 2032
- Figure 57: Asia Pacific BP Cuffs Industry Revenue Share (%), by Usage 2024 & 2032
- Figure 58: Asia Pacific BP Cuffs Industry Volume Share (%), by Usage 2024 & 2032
- Figure 59: Asia Pacific BP Cuffs Industry Revenue (Million), by Product Type 2024 & 2032
- Figure 60: Asia Pacific BP Cuffs Industry Volume (K Unit), by Product Type 2024 & 2032
- Figure 61: Asia Pacific BP Cuffs Industry Revenue Share (%), by Product Type 2024 & 2032
- Figure 62: Asia Pacific BP Cuffs Industry Volume Share (%), by Product Type 2024 & 2032
- Figure 63: Asia Pacific BP Cuffs Industry Revenue (Million), by End User 2024 & 2032
- Figure 64: Asia Pacific BP Cuffs Industry Volume (K Unit), by End User 2024 & 2032
- Figure 65: Asia Pacific BP Cuffs Industry Revenue Share (%), by End User 2024 & 2032
- Figure 66: Asia Pacific BP Cuffs Industry Volume Share (%), by End User 2024 & 2032
- Figure 67: Asia Pacific BP Cuffs Industry Revenue (Million), by Country 2024 & 2032
- Figure 68: Asia Pacific BP Cuffs Industry Volume (K Unit), by Country 2024 & 2032
- Figure 69: Asia Pacific BP Cuffs Industry Revenue Share (%), by Country 2024 & 2032
- Figure 70: Asia Pacific BP Cuffs Industry Volume Share (%), by Country 2024 & 2032
- Figure 71: Middle East and Africa BP Cuffs Industry Revenue (Million), by Usage 2024 & 2032
- Figure 72: Middle East and Africa BP Cuffs Industry Volume (K Unit), by Usage 2024 & 2032
- Figure 73: Middle East and Africa BP Cuffs Industry Revenue Share (%), by Usage 2024 & 2032
- Figure 74: Middle East and Africa BP Cuffs Industry Volume Share (%), by Usage 2024 & 2032
- Figure 75: Middle East and Africa BP Cuffs Industry Revenue (Million), by Product Type 2024 & 2032
- Figure 76: Middle East and Africa BP Cuffs Industry Volume (K Unit), by Product Type 2024 & 2032
- Figure 77: Middle East and Africa BP Cuffs Industry Revenue Share (%), by Product Type 2024 & 2032
- Figure 78: Middle East and Africa BP Cuffs Industry Volume Share (%), by Product Type 2024 & 2032
- Figure 79: Middle East and Africa BP Cuffs Industry Revenue (Million), by End User 2024 & 2032
- Figure 80: Middle East and Africa BP Cuffs Industry Volume (K Unit), by End User 2024 & 2032
- Figure 81: Middle East and Africa BP Cuffs Industry Revenue Share (%), by End User 2024 & 2032
- Figure 82: Middle East and Africa BP Cuffs Industry Volume Share (%), by End User 2024 & 2032
- Figure 83: Middle East and Africa BP Cuffs Industry Revenue (Million), by Country 2024 & 2032
- Figure 84: Middle East and Africa BP Cuffs Industry Volume (K Unit), by Country 2024 & 2032
- Figure 85: Middle East and Africa BP Cuffs Industry Revenue Share (%), by Country 2024 & 2032
- Figure 86: Middle East and Africa BP Cuffs Industry Volume Share (%), by Country 2024 & 2032
- Figure 87: South America BP Cuffs Industry Revenue (Million), by Usage 2024 & 2032
- Figure 88: South America BP Cuffs Industry Volume (K Unit), by Usage 2024 & 2032
- Figure 89: South America BP Cuffs Industry Revenue Share (%), by Usage 2024 & 2032
- Figure 90: South America BP Cuffs Industry Volume Share (%), by Usage 2024 & 2032
- Figure 91: South America BP Cuffs Industry Revenue (Million), by Product Type 2024 & 2032
- Figure 92: South America BP Cuffs Industry Volume (K Unit), by Product Type 2024 & 2032
- Figure 93: South America BP Cuffs Industry Revenue Share (%), by Product Type 2024 & 2032
- Figure 94: South America BP Cuffs Industry Volume Share (%), by Product Type 2024 & 2032
- Figure 95: South America BP Cuffs Industry Revenue (Million), by End User 2024 & 2032
- Figure 96: South America BP Cuffs Industry Volume (K Unit), by End User 2024 & 2032
- Figure 97: South America BP Cuffs Industry Revenue Share (%), by End User 2024 & 2032
- Figure 98: South America BP Cuffs Industry Volume Share (%), by End User 2024 & 2032
- Figure 99: South America BP Cuffs Industry Revenue (Million), by Country 2024 & 2032
- Figure 100: South America BP Cuffs Industry Volume (K Unit), by Country 2024 & 2032
- Figure 101: South America BP Cuffs Industry Revenue Share (%), by Country 2024 & 2032
- Figure 102: South America BP Cuffs Industry Volume Share (%), by Country 2024 & 2032
List of Tables
- Table 1: Global BP Cuffs Industry Revenue Million Forecast, by Region 2019 & 2032
- Table 2: Global BP Cuffs Industry Volume K Unit Forecast, by Region 2019 & 2032
- Table 3: Global BP Cuffs Industry Revenue Million Forecast, by Usage 2019 & 2032
- Table 4: Global BP Cuffs Industry Volume K Unit Forecast, by Usage 2019 & 2032
- Table 5: Global BP Cuffs Industry Revenue Million Forecast, by Product Type 2019 & 2032
- Table 6: Global BP Cuffs Industry Volume K Unit Forecast, by Product Type 2019 & 2032
- Table 7: Global BP Cuffs Industry Revenue Million Forecast, by End User 2019 & 2032
- Table 8: Global BP Cuffs Industry Volume K Unit Forecast, by End User 2019 & 2032
- Table 9: Global BP Cuffs Industry Revenue Million Forecast, by Region 2019 & 2032
- Table 10: Global BP Cuffs Industry Volume K Unit Forecast, by Region 2019 & 2032
- Table 11: Global BP Cuffs Industry Revenue Million Forecast, by Country 2019 & 2032
- Table 12: Global BP Cuffs Industry Volume K Unit Forecast, by Country 2019 & 2032
- Table 13: United States BP Cuffs Industry Revenue (Million) Forecast, by Application 2019 & 2032
- Table 14: United States BP Cuffs Industry Volume (K Unit) Forecast, by Application 2019 & 2032
- Table 15: Canada BP Cuffs Industry Revenue (Million) Forecast, by Application 2019 & 2032
- Table 16: Canada BP Cuffs Industry Volume (K Unit) Forecast, by Application 2019 & 2032
- Table 17: Mexico BP Cuffs Industry Revenue (Million) Forecast, by Application 2019 & 2032
- Table 18: Mexico BP Cuffs Industry Volume (K Unit) Forecast, by Application 2019 & 2032
- Table 19: Global BP Cuffs Industry Revenue Million Forecast, by Country 2019 & 2032
- Table 20: Global BP Cuffs Industry Volume K Unit Forecast, by Country 2019 & 2032
- Table 21: Germany BP Cuffs Industry Revenue (Million) Forecast, by Application 2019 & 2032
- Table 22: Germany BP Cuffs Industry Volume (K Unit) Forecast, by Application 2019 & 2032
- Table 23: United Kingdom BP Cuffs Industry Revenue (Million) Forecast, by Application 2019 & 2032
- Table 24: United Kingdom BP Cuffs Industry Volume (K Unit) Forecast, by Application 2019 & 2032
- Table 25: France BP Cuffs Industry Revenue (Million) Forecast, by Application 2019 & 2032
- Table 26: France BP Cuffs Industry Volume (K Unit) Forecast, by Application 2019 & 2032
- Table 27: Italy BP Cuffs Industry Revenue (Million) Forecast, by Application 2019 & 2032
- Table 28: Italy BP Cuffs Industry Volume (K Unit) Forecast, by Application 2019 & 2032
- Table 29: Spain BP Cuffs Industry Revenue (Million) Forecast, by Application 2019 & 2032
- Table 30: Spain BP Cuffs Industry Volume (K Unit) Forecast, by Application 2019 & 2032
- Table 31: Rest of Europe BP Cuffs Industry Revenue (Million) Forecast, by Application 2019 & 2032
- Table 32: Rest of Europe BP Cuffs Industry Volume (K Unit) Forecast, by Application 2019 & 2032
- Table 33: Global BP Cuffs Industry Revenue Million Forecast, by Country 2019 & 2032
- Table 34: Global BP Cuffs Industry Volume K Unit Forecast, by Country 2019 & 2032
- Table 35: China BP Cuffs Industry Revenue (Million) Forecast, by Application 2019 & 2032
- Table 36: China BP Cuffs Industry Volume (K Unit) Forecast, by Application 2019 & 2032
- Table 37: Japan BP Cuffs Industry Revenue (Million) Forecast, by Application 2019 & 2032
- Table 38: Japan BP Cuffs Industry Volume (K Unit) Forecast, by Application 2019 & 2032
- Table 39: India BP Cuffs Industry Revenue (Million) Forecast, by Application 2019 & 2032
- Table 40: India BP Cuffs Industry Volume (K Unit) Forecast, by Application 2019 & 2032
- Table 41: Australia BP Cuffs Industry Revenue (Million) Forecast, by Application 2019 & 2032
- Table 42: Australia BP Cuffs Industry Volume (K Unit) Forecast, by Application 2019 & 2032
- Table 43: South Korea BP Cuffs Industry Revenue (Million) Forecast, by Application 2019 & 2032
- Table 44: South Korea BP Cuffs Industry Volume (K Unit) Forecast, by Application 2019 & 2032
- Table 45: Rest of Asia Pacific BP Cuffs Industry Revenue (Million) Forecast, by Application 2019 & 2032
- Table 46: Rest of Asia Pacific BP Cuffs Industry Volume (K Unit) Forecast, by Application 2019 & 2032
- Table 47: Global BP Cuffs Industry Revenue Million Forecast, by Country 2019 & 2032
- Table 48: Global BP Cuffs Industry Volume K Unit Forecast, by Country 2019 & 2032
- Table 49: GCC BP Cuffs Industry Revenue (Million) Forecast, by Application 2019 & 2032
- Table 50: GCC BP Cuffs Industry Volume (K Unit) Forecast, by Application 2019 & 2032
- Table 51: South Africa BP Cuffs Industry Revenue (Million) Forecast, by Application 2019 & 2032
- Table 52: South Africa BP Cuffs Industry Volume (K Unit) Forecast, by Application 2019 & 2032
- Table 53: Rest of Middle East and Africa BP Cuffs Industry Revenue (Million) Forecast, by Application 2019 & 2032
- Table 54: Rest of Middle East and Africa BP Cuffs Industry Volume (K Unit) Forecast, by Application 2019 & 2032
- Table 55: Global BP Cuffs Industry Revenue Million Forecast, by Country 2019 & 2032
- Table 56: Global BP Cuffs Industry Volume K Unit Forecast, by Country 2019 & 2032
- Table 57: Brazil BP Cuffs Industry Revenue (Million) Forecast, by Application 2019 & 2032
- Table 58: Brazil BP Cuffs Industry Volume (K Unit) Forecast, by Application 2019 & 2032
- Table 59: Argentina BP Cuffs Industry Revenue (Million) Forecast, by Application 2019 & 2032
- Table 60: Argentina BP Cuffs Industry Volume (K Unit) Forecast, by Application 2019 & 2032
- Table 61: Rest of South America BP Cuffs Industry Revenue (Million) Forecast, by Application 2019 & 2032
- Table 62: Rest of South America BP Cuffs Industry Volume (K Unit) Forecast, by Application 2019 & 2032
- Table 63: Global BP Cuffs Industry Revenue Million Forecast, by Usage 2019 & 2032
- Table 64: Global BP Cuffs Industry Volume K Unit Forecast, by Usage 2019 & 2032
- Table 65: Global BP Cuffs Industry Revenue Million Forecast, by Product Type 2019 & 2032
- Table 66: Global BP Cuffs Industry Volume K Unit Forecast, by Product Type 2019 & 2032
- Table 67: Global BP Cuffs Industry Revenue Million Forecast, by End User 2019 & 2032
- Table 68: Global BP Cuffs Industry Volume K Unit Forecast, by End User 2019 & 2032
- Table 69: Global BP Cuffs Industry Revenue Million Forecast, by Country 2019 & 2032
- Table 70: Global BP Cuffs Industry Volume K Unit Forecast, by Country 2019 & 2032
- Table 71: United States BP Cuffs Industry Revenue (Million) Forecast, by Application 2019 & 2032
- Table 72: United States BP Cuffs Industry Volume (K Unit) Forecast, by Application 2019 & 2032
- Table 73: Canada BP Cuffs Industry Revenue (Million) Forecast, by Application 2019 & 2032
- Table 74: Canada BP Cuffs Industry Volume (K Unit) Forecast, by Application 2019 & 2032
- Table 75: Mexico BP Cuffs Industry Revenue (Million) Forecast, by Application 2019 & 2032
- Table 76: Mexico BP Cuffs Industry Volume (K Unit) Forecast, by Application 2019 & 2032
- Table 77: Global BP Cuffs Industry Revenue Million Forecast, by Usage 2019 & 2032
- Table 78: Global BP Cuffs Industry Volume K Unit Forecast, by Usage 2019 & 2032
- Table 79: Global BP Cuffs Industry Revenue Million Forecast, by Product Type 2019 & 2032
- Table 80: Global BP Cuffs Industry Volume K Unit Forecast, by Product Type 2019 & 2032
- Table 81: Global BP Cuffs Industry Revenue Million Forecast, by End User 2019 & 2032
- Table 82: Global BP Cuffs Industry Volume K Unit Forecast, by End User 2019 & 2032
- Table 83: Global BP Cuffs Industry Revenue Million Forecast, by Country 2019 & 2032
- Table 84: Global BP Cuffs Industry Volume K Unit Forecast, by Country 2019 & 2032
- Table 85: Germany BP Cuffs Industry Revenue (Million) Forecast, by Application 2019 & 2032
- Table 86: Germany BP Cuffs Industry Volume (K Unit) Forecast, by Application 2019 & 2032
- Table 87: United Kingdom BP Cuffs Industry Revenue (Million) Forecast, by Application 2019 & 2032
- Table 88: United Kingdom BP Cuffs Industry Volume (K Unit) Forecast, by Application 2019 & 2032
- Table 89: France BP Cuffs Industry Revenue (Million) Forecast, by Application 2019 & 2032
- Table 90: France BP Cuffs Industry Volume (K Unit) Forecast, by Application 2019 & 2032
- Table 91: Italy BP Cuffs Industry Revenue (Million) Forecast, by Application 2019 & 2032
- Table 92: Italy BP Cuffs Industry Volume (K Unit) Forecast, by Application 2019 & 2032
- Table 93: Spain BP Cuffs Industry Revenue (Million) Forecast, by Application 2019 & 2032
- Table 94: Spain BP Cuffs Industry Volume (K Unit) Forecast, by Application 2019 & 2032
- Table 95: Rest of Europe BP Cuffs Industry Revenue (Million) Forecast, by Application 2019 & 2032
- Table 96: Rest of Europe BP Cuffs Industry Volume (K Unit) Forecast, by Application 2019 & 2032
- Table 97: Global BP Cuffs Industry Revenue Million Forecast, by Usage 2019 & 2032
- Table 98: Global BP Cuffs Industry Volume K Unit Forecast, by Usage 2019 & 2032
- Table 99: Global BP Cuffs Industry Revenue Million Forecast, by Product Type 2019 & 2032
- Table 100: Global BP Cuffs Industry Volume K Unit Forecast, by Product Type 2019 & 2032
- Table 101: Global BP Cuffs Industry Revenue Million Forecast, by End User 2019 & 2032
- Table 102: Global BP Cuffs Industry Volume K Unit Forecast, by End User 2019 & 2032
- Table 103: Global BP Cuffs Industry Revenue Million Forecast, by Country 2019 & 2032
- Table 104: Global BP Cuffs Industry Volume K Unit Forecast, by Country 2019 & 2032
- Table 105: China BP Cuffs Industry Revenue (Million) Forecast, by Application 2019 & 2032
- Table 106: China BP Cuffs Industry Volume (K Unit) Forecast, by Application 2019 & 2032
- Table 107: Japan BP Cuffs Industry Revenue (Million) Forecast, by Application 2019 & 2032
- Table 108: Japan BP Cuffs Industry Volume (K Unit) Forecast, by Application 2019 & 2032
- Table 109: India BP Cuffs Industry Revenue (Million) Forecast, by Application 2019 & 2032
- Table 110: India BP Cuffs Industry Volume (K Unit) Forecast, by Application 2019 & 2032
- Table 111: Australia BP Cuffs Industry Revenue (Million) Forecast, by Application 2019 & 2032
- Table 112: Australia BP Cuffs Industry Volume (K Unit) Forecast, by Application 2019 & 2032
- Table 113: South Korea BP Cuffs Industry Revenue (Million) Forecast, by Application 2019 & 2032
- Table 114: South Korea BP Cuffs Industry Volume (K Unit) Forecast, by Application 2019 & 2032
- Table 115: Rest of Asia Pacific BP Cuffs Industry Revenue (Million) Forecast, by Application 2019 & 2032
- Table 116: Rest of Asia Pacific BP Cuffs Industry Volume (K Unit) Forecast, by Application 2019 & 2032
- Table 117: Global BP Cuffs Industry Revenue Million Forecast, by Usage 2019 & 2032
- Table 118: Global BP Cuffs Industry Volume K Unit Forecast, by Usage 2019 & 2032
- Table 119: Global BP Cuffs Industry Revenue Million Forecast, by Product Type 2019 & 2032
- Table 120: Global BP Cuffs Industry Volume K Unit Forecast, by Product Type 2019 & 2032
- Table 121: Global BP Cuffs Industry Revenue Million Forecast, by End User 2019 & 2032
- Table 122: Global BP Cuffs Industry Volume K Unit Forecast, by End User 2019 & 2032
- Table 123: Global BP Cuffs Industry Revenue Million Forecast, by Country 2019 & 2032
- Table 124: Global BP Cuffs Industry Volume K Unit Forecast, by Country 2019 & 2032
- Table 125: GCC BP Cuffs Industry Revenue (Million) Forecast, by Application 2019 & 2032
- Table 126: GCC BP Cuffs Industry Volume (K Unit) Forecast, by Application 2019 & 2032
- Table 127: South Africa BP Cuffs Industry Revenue (Million) Forecast, by Application 2019 & 2032
- Table 128: South Africa BP Cuffs Industry Volume (K Unit) Forecast, by Application 2019 & 2032
- Table 129: Rest of Middle East and Africa BP Cuffs Industry Revenue (Million) Forecast, by Application 2019 & 2032
- Table 130: Rest of Middle East and Africa BP Cuffs Industry Volume (K Unit) Forecast, by Application 2019 & 2032
- Table 131: Global BP Cuffs Industry Revenue Million Forecast, by Usage 2019 & 2032
- Table 132: Global BP Cuffs Industry Volume K Unit Forecast, by Usage 2019 & 2032
- Table 133: Global BP Cuffs Industry Revenue Million Forecast, by Product Type 2019 & 2032
- Table 134: Global BP Cuffs Industry Volume K Unit Forecast, by Product Type 2019 & 2032
- Table 135: Global BP Cuffs Industry Revenue Million Forecast, by End User 2019 & 2032
- Table 136: Global BP Cuffs Industry Volume K Unit Forecast, by End User 2019 & 2032
- Table 137: Global BP Cuffs Industry Revenue Million Forecast, by Country 2019 & 2032
- Table 138: Global BP Cuffs Industry Volume K Unit Forecast, by Country 2019 & 2032
- Table 139: Brazil BP Cuffs Industry Revenue (Million) Forecast, by Application 2019 & 2032
- Table 140: Brazil BP Cuffs Industry Volume (K Unit) Forecast, by Application 2019 & 2032
- Table 141: Argentina BP Cuffs Industry Revenue (Million) Forecast, by Application 2019 & 2032
- Table 142: Argentina BP Cuffs Industry Volume (K Unit) Forecast, by Application 2019 & 2032
- Table 143: Rest of South America BP Cuffs Industry Revenue (Million) Forecast, by Application 2019 & 2032
- Table 144: Rest of South America BP Cuffs Industry Volume (K Unit) Forecast, by Application 2019 & 2032
Frequently Asked Questions
1. What is the projected Compound Annual Growth Rate (CAGR) of the BP Cuffs Industry?
The projected CAGR is approximately 5.89%.
2. Which companies are prominent players in the BP Cuffs Industry?
Key companies in the market include Halma PLC, Elanor Surgicals, GE Healthcare, W A Baum Co Inc , Baxter, Spengler SAS, Cardinal Health, Koninklijke Philips NV, Omron Healthcare Inc, Spacelabs Healthcare, American Diagnostic Corporation, Medline Industries Inc.
3. What are the main segments of the BP Cuffs Industry?
The market segments include Usage, Product Type, End User.
4. Can you provide details about the market size?
The market size is estimated to be USD 554.10 Million as of 2022.
5. What are some drivers contributing to market growth?
Increasing Prevalence of Hypertension; Growing Demand for Blood Monitoring Devices.
6. What are the notable trends driving market growth?
Automated Blood Pressure Cuffs Segment is Expected to Hold a Significant Market Share Over the Forecast Period.
7. Are there any restraints impacting market growth?
Threat of Infection from Reusable BP Cuffs.
8. Can you provide examples of recent developments in the market?
In September 2022, Garmin launched a smart blood pressure monitor with adjustable cuffs which allows users to measure systolic and diastolic blood pressure at home and on the go.
9. What pricing options are available for accessing the report?
Pricing options include single-user, multi-user, and enterprise licenses priced at USD 4750, USD 5250, and USD 8750 respectively.
10. Is the market size provided in terms of value or volume?
The market size is provided in terms of value, measured in Million and volume, measured in K Unit.
11. Are there any specific market keywords associated with the report?
Yes, the market keyword associated with the report is "BP Cuffs Industry," which aids in identifying and referencing the specific market segment covered.
12. How do I determine which pricing option suits my needs best?
The pricing options vary based on user requirements and access needs. Individual users may opt for single-user licenses, while businesses requiring broader access may choose multi-user or enterprise licenses for cost-effective access to the report.
13. Are there any additional resources or data provided in the BP Cuffs Industry report?
While the report offers comprehensive insights, it's advisable to review the specific contents or supplementary materials provided to ascertain if additional resources or data are available.
14. How can I stay updated on further developments or reports in the BP Cuffs Industry?
To stay informed about further developments, trends, and reports in the BP Cuffs Industry, consider subscribing to industry newsletters, following relevant companies and organizations, or regularly checking reputable industry news sources and publications.
Methodology
Step 1 - Identification of Relevant Samples Size from Population Database


Step 2 - Approaches for Defining Global Market Size (Value, Volume* & Price*)

Note*: In applicable scenarios
Step 3 - Data Sources
Primary Research
- Web Analytics
- Survey Reports
- Research Institute
- Latest Research Reports
- Opinion Leaders
Secondary Research
- Annual Reports
- White Paper
- Latest Press Release
- Industry Association
- Paid Database
- Investor Presentations

Step 4 - Data Triangulation
Involves using different sources of information in order to increase the validity of a study
These sources are likely to be stakeholders in a program - participants, other researchers, program staff, other community members, and so on.
Then we put all data in single framework & apply various statistical tools to find out the dynamic on the market.
During the analysis stage, feedback from the stakeholder groups would be compared to determine areas of agreement as well as areas of divergence
