

Key Insights
The global biophotonics market is experiencing robust growth, projected to reach a substantial size driven by several key factors. The 10.50% CAGR from 2019-2033 indicates a consistently expanding market, fueled by advancements in medical imaging and diagnostics. Technological innovations across various segments, including surface imaging, inside imaging, see-through imaging, microscopy, biosensors, medical lasers, and spectromolecular technologies, are creating new applications and driving market expansion. The increasing prevalence of chronic diseases globally necessitates more sophisticated diagnostic and therapeutic tools, further boosting demand for biophotonics-based solutions. Significant investments in research and development are leading to the commercialization of innovative products, enhancing market competitiveness and driving growth. The rising adoption of minimally invasive procedures and the demand for point-of-care diagnostics contribute significantly to this expansion. Leading companies such as Becton Dickinson, PerkinElmer, and Thermo Fisher Scientific are actively shaping the market landscape through product development and strategic acquisitions.
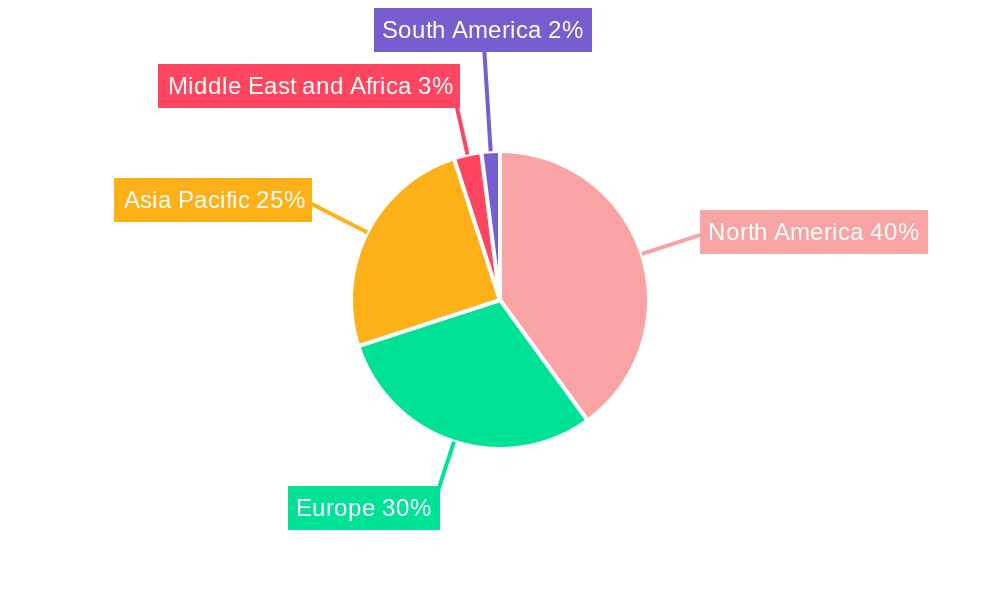
Geographic distribution shows a diverse market, with North America currently holding a significant share due to advanced healthcare infrastructure and high adoption rates. However, the Asia-Pacific region is expected to witness the fastest growth due to rising healthcare expenditure and a growing population. Regulatory approvals for new biophotonics technologies are crucial factors influencing market penetration. Challenges include high initial investment costs for advanced equipment and the need for skilled professionals for operation and maintenance. Overcoming these barriers through collaborations between public and private sectors and the development of affordable solutions will be key to unlocking the full potential of this dynamic market. The forecast period (2025-2033) will likely witness increased focus on personalized medicine and the integration of artificial intelligence and machine learning to improve diagnostic accuracy and treatment efficacy, ultimately shaping the future trajectory of the biophotonics industry.
Biophotonics Industry Market Report: 2019-2033
This comprehensive report provides an in-depth analysis of the biophotonics industry, offering valuable insights for stakeholders seeking to understand market dynamics, future trends, and investment opportunities. With a study period spanning 2019-2033, a base year of 2025, and a forecast period of 2025-2033, this report leverages extensive data analysis to deliver actionable intelligence. The global biophotonics market is projected to reach xx Million by 2033, showcasing significant growth potential.
Biophotonics Industry Market Composition & Trends
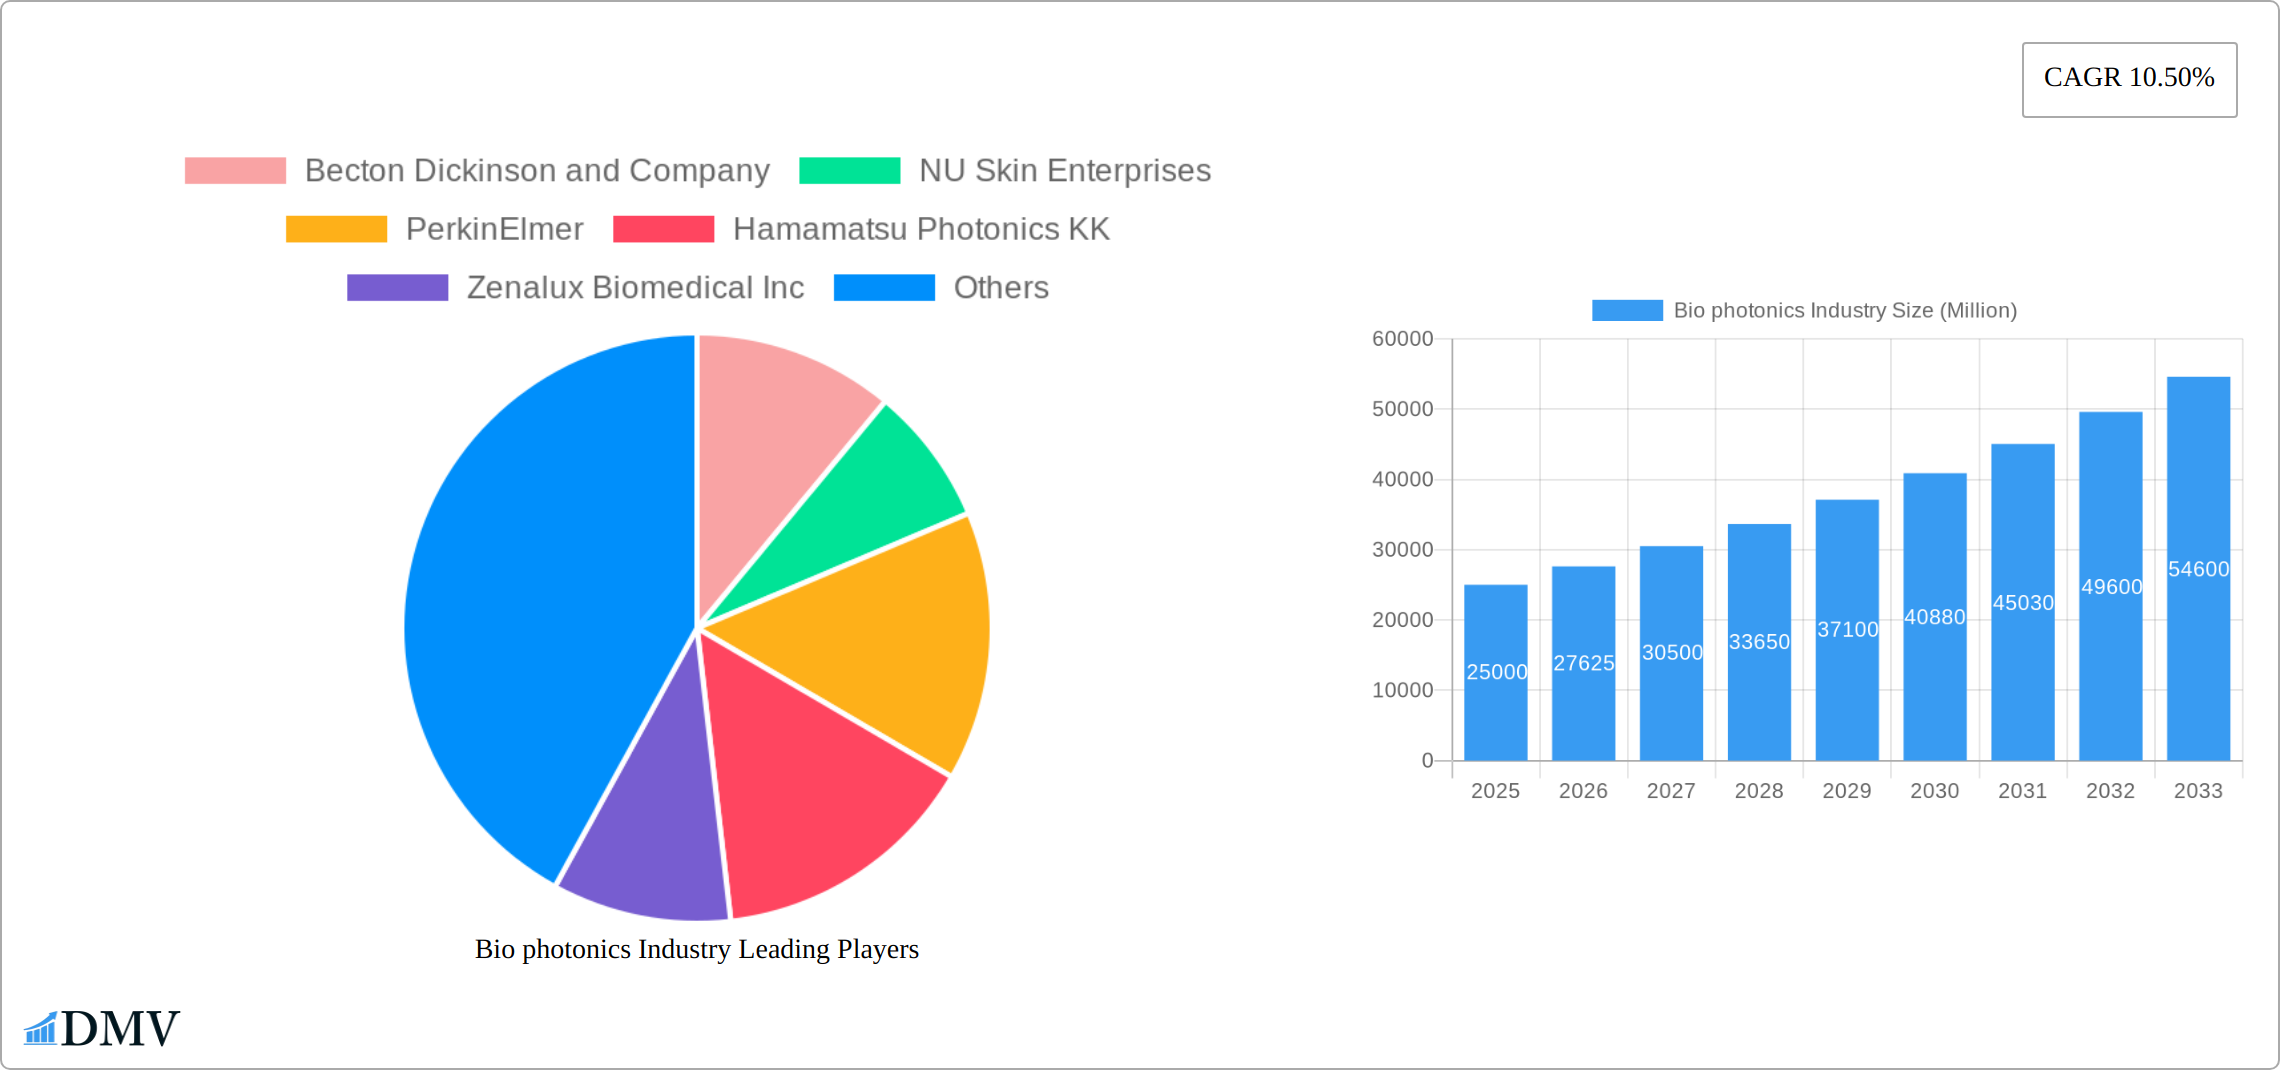
The biophotonics market exhibits a moderately concentrated structure, with key players like Becton Dickinson and Company, NU Skin Enterprises, PerkinElmer, Hamamatsu Photonics KK, and Thermo Fisher Scientific holding significant market share. Market share distribution is dynamic, influenced by innovation, strategic partnerships, and mergers & acquisitions (M&A) activity. The regulatory landscape, particularly concerning medical device approvals, significantly impacts market entry and growth. Substitute products, such as traditional diagnostic techniques, pose competitive pressure. The primary end-users are research institutions, hospitals, pharmaceutical companies, and biotechnology firms. M&A activity is characterized by strategic acquisitions aimed at expanding technological capabilities and market reach. Deal values have ranged from tens to hundreds of Millions of USD in recent years, reflecting the industry's consolidation trends.
- Market Concentration: Moderately concentrated, with top 5 players holding approximately xx% market share in 2024.
- Innovation Catalysts: Advancements in laser technology, sensor development, and imaging techniques.
- Regulatory Landscape: Stringent regulations for medical devices impacting market entry and product approvals.
- Substitute Products: Traditional diagnostic methods and imaging technologies.
- End-User Profiles: Research institutions, hospitals, pharmaceutical and biotechnology companies.
- M&A Activity: Strategic acquisitions driving market consolidation; deal values exceeding xx Million USD annually in recent years.
Biophotonics Industry Evolution
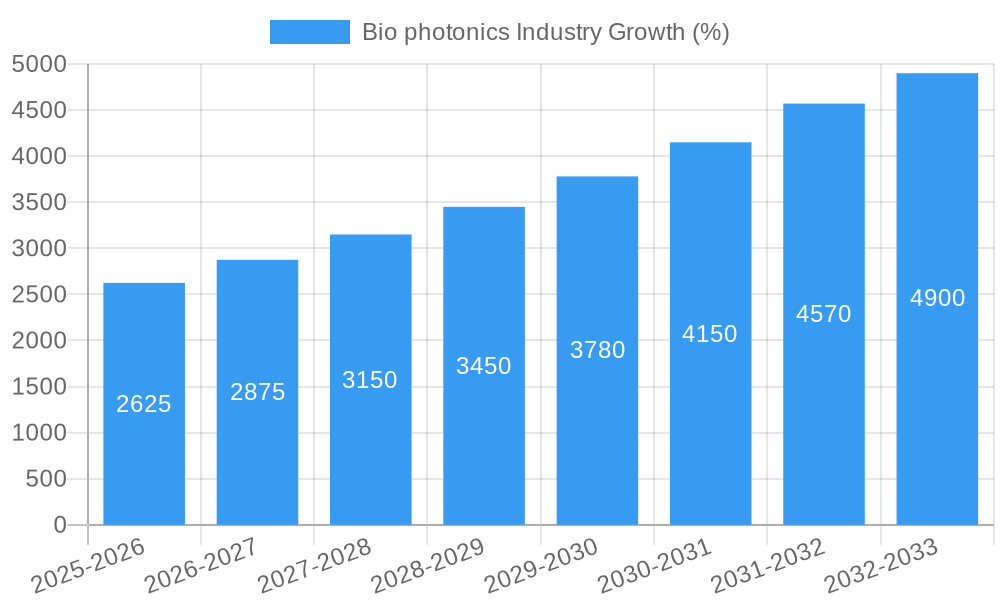
The biophotonics market has experienced robust growth, driven by technological advancements and increasing demand for advanced diagnostic and therapeutic tools. The historical period (2019-2024) witnessed a Compound Annual Growth Rate (CAGR) of approximately xx%, fueled by the adoption of minimally invasive procedures and the rising prevalence of chronic diseases. Technological advancements, including the development of high-resolution imaging systems, portable biosensors, and improved laser technologies, have significantly expanded the applications of biophotonics. The increasing demand for personalized medicine and point-of-care diagnostics is further propelling market growth. Consumer demand is shifting towards faster, more accurate, and less invasive diagnostic and therapeutic options, creating a lucrative market for innovative biophotonics solutions. The projected CAGR for the forecast period (2025-2033) is estimated at xx%, indicating continued strong growth. Specific adoption metrics, such as the number of installed medical lasers or the market penetration of advanced microscopy techniques, will vary across segments but demonstrate a general upward trend.
Leading Regions, Countries, or Segments in Biophotonics Industry
North America currently dominates the biophotonics market, driven by substantial investments in R&D, a robust healthcare infrastructure, and the presence of major industry players. Europe follows closely, demonstrating significant growth potential due to increasing government funding for healthcare and technological advancements. Asia-Pacific is also experiencing rapid expansion, propelled by rising healthcare expenditure and a growing awareness of advanced diagnostic tools.
- Dominant Region: North America
- Key Drivers:
- Substantial investments in R&D
- Robust healthcare infrastructure
- Presence of major industry players (e.g., Carl Zeiss AG in the US)
- Strong regulatory support for medical device innovation.
- Microscopy Segment: High growth due to continuous advancements in resolution and imaging capabilities, facilitating research in life sciences and materials.
- Biosensors Segment: Rapid growth fueled by the demand for point-of-care diagnostics and personalized medicine.
- Medical Lasers Segment: Steady growth attributed to the increased use in minimally invasive surgeries and therapeutic applications.
Biophotonics Industry Product Innovations
Recent innovations include miniaturized and portable biosensors, offering real-time diagnostic capabilities outside of traditional laboratory settings. Advancements in microscopy, particularly super-resolution microscopy and light-sheet microscopy, have significantly improved the resolution and speed of biological imaging. New laser technologies, such as ultrafast lasers and fiber lasers, have enhanced the precision and efficiency of laser-based therapies. The unique selling propositions often center around improved sensitivity, speed, portability, and reduced invasiveness.
Propelling Factors for Biophotonics Industry Growth
Technological advancements, increasing healthcare spending, and the growing demand for minimally invasive procedures are key growth drivers. Government initiatives promoting medical technology innovation and supportive regulatory frameworks are also bolstering market expansion. The rising prevalence of chronic diseases and aging population further fuels the need for efficient diagnostic and therapeutic solutions.
Obstacles in the Biophotonics Industry Market
High research and development costs, stringent regulatory approvals, and the need for skilled professionals pose challenges. Supply chain disruptions, particularly concerning specialized components like lasers and optical sensors, can impact manufacturing and product availability. Intense competition from established players and emerging market entrants also presents a barrier to market entry.
Future Opportunities in Biophotonics Industry
Emerging opportunities lie in the development of personalized medicine tools, advanced imaging systems for early disease detection, and novel therapeutic applications. Expanding into emerging markets and developing cost-effective solutions for underserved populations present significant growth potential. The integration of artificial intelligence and machine learning into biophotonics devices promises to enhance diagnostic accuracy and treatment efficacy.
Major Players in the Biophotonics Industry Ecosystem
- Becton Dickinson and Company
- NU Skin Enterprises
- PerkinElmer
- Hamamatsu Photonics KK
- Zenalux Biomedical Inc
- Glenbrook Technologies
- Oxford Instruments PLC
- Carl Zeiss AG
- Olympus Corporation
- Thermo Fisher Scientific
Key Developments in Biophotonics Industry
- March 2021: Zeiss invested USD 180 Million in a new North American R&D, production, sales, and customer service center, expanding its presence and capacity for X-ray microscopy and other applications.
- November 2021: Oxford Instruments launched the BC43, a compact microscopy device providing real-time 3D imaging.
Strategic Biophotonics Industry Market Forecast
The biophotonics market is poised for sustained growth, driven by technological innovation and increasing demand. Future opportunities lie in the development of personalized medicine tools, advanced imaging techniques, and novel therapeutic applications. The market's expansion will be fueled by ongoing investments in R&D, strategic partnerships, and the adoption of innovative biophotonics solutions across various healthcare sectors. The market's potential is substantial, promising significant returns for investors and driving advancements in healthcare technology.
Bio photonics Industry Segmentation
-
1. Technology
- 1.1. Surface Imaging
- 1.2. Inside Imaging
- 1.3. See-through Imaging
- 1.4. Microscopy
- 1.5. Biosensors
- 1.6. Medical Lasers
- 1.7. Spectromolecular
- 1.8. Other Technologies
-
2. Application
- 2.1. Medical Diagnostics
- 2.2. Drug Discovery
- 2.3. Medical Research
- 2.4. Biotechnology
- 2.5. Environmental Monitoring
Bio photonics Industry Segmentation By Geography
-
1. North America
- 1.1. United States
- 1.2. Canada
- 1.3. Mexico
-
2. Europe
- 2.1. Germany
- 2.2. United Kingdom
- 2.3. France
- 2.4. Italy
- 2.5. Spain
- 2.6. Rest of Europe
-
3. Asia Pacific
- 3.1. China
- 3.2. Japan
- 3.3. India
- 3.4. Australia
- 3.5. South Korea
- 3.6. Rest of Asia Pacific
-
4. Middle East and Africa
- 4.1. GCC
- 4.2. South Africa
- 4.3. Rest of Middle East and Africa
-
5. South America
- 5.1. Brazil
- 5.2. Argentina
- 5.3. Rest of South America
Bio photonics Industry REPORT HIGHLIGHTS
| Aspects | Details |
|---|---|
| Study Period | 2019-2033 |
| Base Year | 2024 |
| Estimated Year | 2025 |
| Forecast Period | 2025-2033 |
| Historical Period | 2019-2024 |
| Growth Rate | CAGR of 10.50% from 2019-2033 |
| Segmentation |
|
Table of Contents
- 1. Introduction
- 1.1. Research Scope
- 1.2. Market Segmentation
- 1.3. Research Methodology
- 1.4. Definitions and Assumptions
- 2. Executive Summary
- 2.1. Introduction
- 3. Market Dynamics
- 3.1. Introduction
- 3.2. Market Drivers
- 3.2.1. Growing Geriatric Population; Increasing Use of Biophotonics in Cell and Tissue Diagnostics; Emergence of Nanotechnology in Biophotonics; Development of Novel Photoacoustic Tomography (PAT) System
- 3.3. Market Restrains
- 3.3.1. Lack of Awareness of Biophotonics Technology and Skilled Personnel; High Cost of Technology
- 3.4. Market Trends
- 3.4.1. Inside Imaging (Endoscopy) Segment is Expected to Witness Growth Over the Forecast Period
- 4. Market Factor Analysis
- 4.1. Porters Five Forces
- 4.2. Supply/Value Chain
- 4.3. PESTEL analysis
- 4.4. Market Entropy
- 4.5. Patent/Trademark Analysis
- 5. Global Bio photonics Industry Analysis, Insights and Forecast, 2019-2031
- 5.1. Market Analysis, Insights and Forecast - by Technology
- 5.1.1. Surface Imaging
- 5.1.2. Inside Imaging
- 5.1.3. See-through Imaging
- 5.1.4. Microscopy
- 5.1.5. Biosensors
- 5.1.6. Medical Lasers
- 5.1.7. Spectromolecular
- 5.1.8. Other Technologies
- 5.2. Market Analysis, Insights and Forecast - by Application
- 5.2.1. Medical Diagnostics
- 5.2.2. Drug Discovery
- 5.2.3. Medical Research
- 5.2.4. Biotechnology
- 5.2.5. Environmental Monitoring
- 5.3. Market Analysis, Insights and Forecast - by Region
- 5.3.1. North America
- 5.3.2. Europe
- 5.3.3. Asia Pacific
- 5.3.4. Middle East and Africa
- 5.3.5. South America
- 5.1. Market Analysis, Insights and Forecast - by Technology
- 6. North America Bio photonics Industry Analysis, Insights and Forecast, 2019-2031
- 6.1. Market Analysis, Insights and Forecast - by Technology
- 6.1.1. Surface Imaging
- 6.1.2. Inside Imaging
- 6.1.3. See-through Imaging
- 6.1.4. Microscopy
- 6.1.5. Biosensors
- 6.1.6. Medical Lasers
- 6.1.7. Spectromolecular
- 6.1.8. Other Technologies
- 6.2. Market Analysis, Insights and Forecast - by Application
- 6.2.1. Medical Diagnostics
- 6.2.2. Drug Discovery
- 6.2.3. Medical Research
- 6.2.4. Biotechnology
- 6.2.5. Environmental Monitoring
- 6.1. Market Analysis, Insights and Forecast - by Technology
- 7. Europe Bio photonics Industry Analysis, Insights and Forecast, 2019-2031
- 7.1. Market Analysis, Insights and Forecast - by Technology
- 7.1.1. Surface Imaging
- 7.1.2. Inside Imaging
- 7.1.3. See-through Imaging
- 7.1.4. Microscopy
- 7.1.5. Biosensors
- 7.1.6. Medical Lasers
- 7.1.7. Spectromolecular
- 7.1.8. Other Technologies
- 7.2. Market Analysis, Insights and Forecast - by Application
- 7.2.1. Medical Diagnostics
- 7.2.2. Drug Discovery
- 7.2.3. Medical Research
- 7.2.4. Biotechnology
- 7.2.5. Environmental Monitoring
- 7.1. Market Analysis, Insights and Forecast - by Technology
- 8. Asia Pacific Bio photonics Industry Analysis, Insights and Forecast, 2019-2031
- 8.1. Market Analysis, Insights and Forecast - by Technology
- 8.1.1. Surface Imaging
- 8.1.2. Inside Imaging
- 8.1.3. See-through Imaging
- 8.1.4. Microscopy
- 8.1.5. Biosensors
- 8.1.6. Medical Lasers
- 8.1.7. Spectromolecular
- 8.1.8. Other Technologies
- 8.2. Market Analysis, Insights and Forecast - by Application
- 8.2.1. Medical Diagnostics
- 8.2.2. Drug Discovery
- 8.2.3. Medical Research
- 8.2.4. Biotechnology
- 8.2.5. Environmental Monitoring
- 8.1. Market Analysis, Insights and Forecast - by Technology
- 9. Middle East and Africa Bio photonics Industry Analysis, Insights and Forecast, 2019-2031
- 9.1. Market Analysis, Insights and Forecast - by Technology
- 9.1.1. Surface Imaging
- 9.1.2. Inside Imaging
- 9.1.3. See-through Imaging
- 9.1.4. Microscopy
- 9.1.5. Biosensors
- 9.1.6. Medical Lasers
- 9.1.7. Spectromolecular
- 9.1.8. Other Technologies
- 9.2. Market Analysis, Insights and Forecast - by Application
- 9.2.1. Medical Diagnostics
- 9.2.2. Drug Discovery
- 9.2.3. Medical Research
- 9.2.4. Biotechnology
- 9.2.5. Environmental Monitoring
- 9.1. Market Analysis, Insights and Forecast - by Technology
- 10. South America Bio photonics Industry Analysis, Insights and Forecast, 2019-2031
- 10.1. Market Analysis, Insights and Forecast - by Technology
- 10.1.1. Surface Imaging
- 10.1.2. Inside Imaging
- 10.1.3. See-through Imaging
- 10.1.4. Microscopy
- 10.1.5. Biosensors
- 10.1.6. Medical Lasers
- 10.1.7. Spectromolecular
- 10.1.8. Other Technologies
- 10.2. Market Analysis, Insights and Forecast - by Application
- 10.2.1. Medical Diagnostics
- 10.2.2. Drug Discovery
- 10.2.3. Medical Research
- 10.2.4. Biotechnology
- 10.2.5. Environmental Monitoring
- 10.1. Market Analysis, Insights and Forecast - by Technology
- 11. North America Bio photonics Industry Analysis, Insights and Forecast, 2019-2031
- 11.1. Market Analysis, Insights and Forecast - By Country/Sub-region
- 11.1.1 United States
- 11.1.2 Canada
- 11.1.3 Mexico
- 12. Europe Bio photonics Industry Analysis, Insights and Forecast, 2019-2031
- 12.1. Market Analysis, Insights and Forecast - By Country/Sub-region
- 12.1.1 Germany
- 12.1.2 United Kingdom
- 12.1.3 France
- 12.1.4 Italy
- 12.1.5 Spain
- 12.1.6 Rest of Europe
- 13. Asia Pacific Bio photonics Industry Analysis, Insights and Forecast, 2019-2031
- 13.1. Market Analysis, Insights and Forecast - By Country/Sub-region
- 13.1.1 China
- 13.1.2 Japan
- 13.1.3 India
- 13.1.4 Australia
- 13.1.5 South Korea
- 13.1.6 Rest of Asia Pacific
- 14. Middle East and Africa Bio photonics Industry Analysis, Insights and Forecast, 2019-2031
- 14.1. Market Analysis, Insights and Forecast - By Country/Sub-region
- 14.1.1 GCC
- 14.1.2 South Africa
- 14.1.3 Rest of Middle East and Africa
- 15. South America Bio photonics Industry Analysis, Insights and Forecast, 2019-2031
- 15.1. Market Analysis, Insights and Forecast - By Country/Sub-region
- 15.1.1 Brazil
- 15.1.2 Argentina
- 15.1.3 Rest of South America
- 16. Competitive Analysis
- 16.1. Global Market Share Analysis 2024
- 16.2. Company Profiles
- 16.2.1 Becton Dickinson and Company
- 16.2.1.1. Overview
- 16.2.1.2. Products
- 16.2.1.3. SWOT Analysis
- 16.2.1.4. Recent Developments
- 16.2.1.5. Financials (Based on Availability)
- 16.2.2 NU Skin Enterprises
- 16.2.2.1. Overview
- 16.2.2.2. Products
- 16.2.2.3. SWOT Analysis
- 16.2.2.4. Recent Developments
- 16.2.2.5. Financials (Based on Availability)
- 16.2.3 PerkinElmer
- 16.2.3.1. Overview
- 16.2.3.2. Products
- 16.2.3.3. SWOT Analysis
- 16.2.3.4. Recent Developments
- 16.2.3.5. Financials (Based on Availability)
- 16.2.4 Hamamatsu Photonics KK
- 16.2.4.1. Overview
- 16.2.4.2. Products
- 16.2.4.3. SWOT Analysis
- 16.2.4.4. Recent Developments
- 16.2.4.5. Financials (Based on Availability)
- 16.2.5 Zenalux Biomedical Inc
- 16.2.5.1. Overview
- 16.2.5.2. Products
- 16.2.5.3. SWOT Analysis
- 16.2.5.4. Recent Developments
- 16.2.5.5. Financials (Based on Availability)
- 16.2.6 Glenbrook Technologies
- 16.2.6.1. Overview
- 16.2.6.2. Products
- 16.2.6.3. SWOT Analysis
- 16.2.6.4. Recent Developments
- 16.2.6.5. Financials (Based on Availability)
- 16.2.7 Oxford Instruments PLC
- 16.2.7.1. Overview
- 16.2.7.2. Products
- 16.2.7.3. SWOT Analysis
- 16.2.7.4. Recent Developments
- 16.2.7.5. Financials (Based on Availability)
- 16.2.8 Carl Zeiss AG
- 16.2.8.1. Overview
- 16.2.8.2. Products
- 16.2.8.3. SWOT Analysis
- 16.2.8.4. Recent Developments
- 16.2.8.5. Financials (Based on Availability)
- 16.2.9 Olympus Corporation
- 16.2.9.1. Overview
- 16.2.9.2. Products
- 16.2.9.3. SWOT Analysis
- 16.2.9.4. Recent Developments
- 16.2.9.5. Financials (Based on Availability)
- 16.2.10 Thermo Fisher Scientific
- 16.2.10.1. Overview
- 16.2.10.2. Products
- 16.2.10.3. SWOT Analysis
- 16.2.10.4. Recent Developments
- 16.2.10.5. Financials (Based on Availability)
- 16.2.1 Becton Dickinson and Company
List of Figures
- Figure 1: Global Bio photonics Industry Revenue Breakdown (Million, %) by Region 2024 & 2032
- Figure 2: Global Bio photonics Industry Volume Breakdown (K Unit, %) by Region 2024 & 2032
- Figure 3: North America Bio photonics Industry Revenue (Million), by Country 2024 & 2032
- Figure 4: North America Bio photonics Industry Volume (K Unit), by Country 2024 & 2032
- Figure 5: North America Bio photonics Industry Revenue Share (%), by Country 2024 & 2032
- Figure 6: North America Bio photonics Industry Volume Share (%), by Country 2024 & 2032
- Figure 7: Europe Bio photonics Industry Revenue (Million), by Country 2024 & 2032
- Figure 8: Europe Bio photonics Industry Volume (K Unit), by Country 2024 & 2032
- Figure 9: Europe Bio photonics Industry Revenue Share (%), by Country 2024 & 2032
- Figure 10: Europe Bio photonics Industry Volume Share (%), by Country 2024 & 2032
- Figure 11: Asia Pacific Bio photonics Industry Revenue (Million), by Country 2024 & 2032
- Figure 12: Asia Pacific Bio photonics Industry Volume (K Unit), by Country 2024 & 2032
- Figure 13: Asia Pacific Bio photonics Industry Revenue Share (%), by Country 2024 & 2032
- Figure 14: Asia Pacific Bio photonics Industry Volume Share (%), by Country 2024 & 2032
- Figure 15: Middle East and Africa Bio photonics Industry Revenue (Million), by Country 2024 & 2032
- Figure 16: Middle East and Africa Bio photonics Industry Volume (K Unit), by Country 2024 & 2032
- Figure 17: Middle East and Africa Bio photonics Industry Revenue Share (%), by Country 2024 & 2032
- Figure 18: Middle East and Africa Bio photonics Industry Volume Share (%), by Country 2024 & 2032
- Figure 19: South America Bio photonics Industry Revenue (Million), by Country 2024 & 2032
- Figure 20: South America Bio photonics Industry Volume (K Unit), by Country 2024 & 2032
- Figure 21: South America Bio photonics Industry Revenue Share (%), by Country 2024 & 2032
- Figure 22: South America Bio photonics Industry Volume Share (%), by Country 2024 & 2032
- Figure 23: North America Bio photonics Industry Revenue (Million), by Technology 2024 & 2032
- Figure 24: North America Bio photonics Industry Volume (K Unit), by Technology 2024 & 2032
- Figure 25: North America Bio photonics Industry Revenue Share (%), by Technology 2024 & 2032
- Figure 26: North America Bio photonics Industry Volume Share (%), by Technology 2024 & 2032
- Figure 27: North America Bio photonics Industry Revenue (Million), by Application 2024 & 2032
- Figure 28: North America Bio photonics Industry Volume (K Unit), by Application 2024 & 2032
- Figure 29: North America Bio photonics Industry Revenue Share (%), by Application 2024 & 2032
- Figure 30: North America Bio photonics Industry Volume Share (%), by Application 2024 & 2032
- Figure 31: North America Bio photonics Industry Revenue (Million), by Country 2024 & 2032
- Figure 32: North America Bio photonics Industry Volume (K Unit), by Country 2024 & 2032
- Figure 33: North America Bio photonics Industry Revenue Share (%), by Country 2024 & 2032
- Figure 34: North America Bio photonics Industry Volume Share (%), by Country 2024 & 2032
- Figure 35: Europe Bio photonics Industry Revenue (Million), by Technology 2024 & 2032
- Figure 36: Europe Bio photonics Industry Volume (K Unit), by Technology 2024 & 2032
- Figure 37: Europe Bio photonics Industry Revenue Share (%), by Technology 2024 & 2032
- Figure 38: Europe Bio photonics Industry Volume Share (%), by Technology 2024 & 2032
- Figure 39: Europe Bio photonics Industry Revenue (Million), by Application 2024 & 2032
- Figure 40: Europe Bio photonics Industry Volume (K Unit), by Application 2024 & 2032
- Figure 41: Europe Bio photonics Industry Revenue Share (%), by Application 2024 & 2032
- Figure 42: Europe Bio photonics Industry Volume Share (%), by Application 2024 & 2032
- Figure 43: Europe Bio photonics Industry Revenue (Million), by Country 2024 & 2032
- Figure 44: Europe Bio photonics Industry Volume (K Unit), by Country 2024 & 2032
- Figure 45: Europe Bio photonics Industry Revenue Share (%), by Country 2024 & 2032
- Figure 46: Europe Bio photonics Industry Volume Share (%), by Country 2024 & 2032
- Figure 47: Asia Pacific Bio photonics Industry Revenue (Million), by Technology 2024 & 2032
- Figure 48: Asia Pacific Bio photonics Industry Volume (K Unit), by Technology 2024 & 2032
- Figure 49: Asia Pacific Bio photonics Industry Revenue Share (%), by Technology 2024 & 2032
- Figure 50: Asia Pacific Bio photonics Industry Volume Share (%), by Technology 2024 & 2032
- Figure 51: Asia Pacific Bio photonics Industry Revenue (Million), by Application 2024 & 2032
- Figure 52: Asia Pacific Bio photonics Industry Volume (K Unit), by Application 2024 & 2032
- Figure 53: Asia Pacific Bio photonics Industry Revenue Share (%), by Application 2024 & 2032
- Figure 54: Asia Pacific Bio photonics Industry Volume Share (%), by Application 2024 & 2032
- Figure 55: Asia Pacific Bio photonics Industry Revenue (Million), by Country 2024 & 2032
- Figure 56: Asia Pacific Bio photonics Industry Volume (K Unit), by Country 2024 & 2032
- Figure 57: Asia Pacific Bio photonics Industry Revenue Share (%), by Country 2024 & 2032
- Figure 58: Asia Pacific Bio photonics Industry Volume Share (%), by Country 2024 & 2032
- Figure 59: Middle East and Africa Bio photonics Industry Revenue (Million), by Technology 2024 & 2032
- Figure 60: Middle East and Africa Bio photonics Industry Volume (K Unit), by Technology 2024 & 2032
- Figure 61: Middle East and Africa Bio photonics Industry Revenue Share (%), by Technology 2024 & 2032
- Figure 62: Middle East and Africa Bio photonics Industry Volume Share (%), by Technology 2024 & 2032
- Figure 63: Middle East and Africa Bio photonics Industry Revenue (Million), by Application 2024 & 2032
- Figure 64: Middle East and Africa Bio photonics Industry Volume (K Unit), by Application 2024 & 2032
- Figure 65: Middle East and Africa Bio photonics Industry Revenue Share (%), by Application 2024 & 2032
- Figure 66: Middle East and Africa Bio photonics Industry Volume Share (%), by Application 2024 & 2032
- Figure 67: Middle East and Africa Bio photonics Industry Revenue (Million), by Country 2024 & 2032
- Figure 68: Middle East and Africa Bio photonics Industry Volume (K Unit), by Country 2024 & 2032
- Figure 69: Middle East and Africa Bio photonics Industry Revenue Share (%), by Country 2024 & 2032
- Figure 70: Middle East and Africa Bio photonics Industry Volume Share (%), by Country 2024 & 2032
- Figure 71: South America Bio photonics Industry Revenue (Million), by Technology 2024 & 2032
- Figure 72: South America Bio photonics Industry Volume (K Unit), by Technology 2024 & 2032
- Figure 73: South America Bio photonics Industry Revenue Share (%), by Technology 2024 & 2032
- Figure 74: South America Bio photonics Industry Volume Share (%), by Technology 2024 & 2032
- Figure 75: South America Bio photonics Industry Revenue (Million), by Application 2024 & 2032
- Figure 76: South America Bio photonics Industry Volume (K Unit), by Application 2024 & 2032
- Figure 77: South America Bio photonics Industry Revenue Share (%), by Application 2024 & 2032
- Figure 78: South America Bio photonics Industry Volume Share (%), by Application 2024 & 2032
- Figure 79: South America Bio photonics Industry Revenue (Million), by Country 2024 & 2032
- Figure 80: South America Bio photonics Industry Volume (K Unit), by Country 2024 & 2032
- Figure 81: South America Bio photonics Industry Revenue Share (%), by Country 2024 & 2032
- Figure 82: South America Bio photonics Industry Volume Share (%), by Country 2024 & 2032
List of Tables
- Table 1: Global Bio photonics Industry Revenue Million Forecast, by Region 2019 & 2032
- Table 2: Global Bio photonics Industry Volume K Unit Forecast, by Region 2019 & 2032
- Table 3: Global Bio photonics Industry Revenue Million Forecast, by Technology 2019 & 2032
- Table 4: Global Bio photonics Industry Volume K Unit Forecast, by Technology 2019 & 2032
- Table 5: Global Bio photonics Industry Revenue Million Forecast, by Application 2019 & 2032
- Table 6: Global Bio photonics Industry Volume K Unit Forecast, by Application 2019 & 2032
- Table 7: Global Bio photonics Industry Revenue Million Forecast, by Region 2019 & 2032
- Table 8: Global Bio photonics Industry Volume K Unit Forecast, by Region 2019 & 2032
- Table 9: Global Bio photonics Industry Revenue Million Forecast, by Country 2019 & 2032
- Table 10: Global Bio photonics Industry Volume K Unit Forecast, by Country 2019 & 2032
- Table 11: United States Bio photonics Industry Revenue (Million) Forecast, by Application 2019 & 2032
- Table 12: United States Bio photonics Industry Volume (K Unit) Forecast, by Application 2019 & 2032
- Table 13: Canada Bio photonics Industry Revenue (Million) Forecast, by Application 2019 & 2032
- Table 14: Canada Bio photonics Industry Volume (K Unit) Forecast, by Application 2019 & 2032
- Table 15: Mexico Bio photonics Industry Revenue (Million) Forecast, by Application 2019 & 2032
- Table 16: Mexico Bio photonics Industry Volume (K Unit) Forecast, by Application 2019 & 2032
- Table 17: Global Bio photonics Industry Revenue Million Forecast, by Country 2019 & 2032
- Table 18: Global Bio photonics Industry Volume K Unit Forecast, by Country 2019 & 2032
- Table 19: Germany Bio photonics Industry Revenue (Million) Forecast, by Application 2019 & 2032
- Table 20: Germany Bio photonics Industry Volume (K Unit) Forecast, by Application 2019 & 2032
- Table 21: United Kingdom Bio photonics Industry Revenue (Million) Forecast, by Application 2019 & 2032
- Table 22: United Kingdom Bio photonics Industry Volume (K Unit) Forecast, by Application 2019 & 2032
- Table 23: France Bio photonics Industry Revenue (Million) Forecast, by Application 2019 & 2032
- Table 24: France Bio photonics Industry Volume (K Unit) Forecast, by Application 2019 & 2032
- Table 25: Italy Bio photonics Industry Revenue (Million) Forecast, by Application 2019 & 2032
- Table 26: Italy Bio photonics Industry Volume (K Unit) Forecast, by Application 2019 & 2032
- Table 27: Spain Bio photonics Industry Revenue (Million) Forecast, by Application 2019 & 2032
- Table 28: Spain Bio photonics Industry Volume (K Unit) Forecast, by Application 2019 & 2032
- Table 29: Rest of Europe Bio photonics Industry Revenue (Million) Forecast, by Application 2019 & 2032
- Table 30: Rest of Europe Bio photonics Industry Volume (K Unit) Forecast, by Application 2019 & 2032
- Table 31: Global Bio photonics Industry Revenue Million Forecast, by Country 2019 & 2032
- Table 32: Global Bio photonics Industry Volume K Unit Forecast, by Country 2019 & 2032
- Table 33: China Bio photonics Industry Revenue (Million) Forecast, by Application 2019 & 2032
- Table 34: China Bio photonics Industry Volume (K Unit) Forecast, by Application 2019 & 2032
- Table 35: Japan Bio photonics Industry Revenue (Million) Forecast, by Application 2019 & 2032
- Table 36: Japan Bio photonics Industry Volume (K Unit) Forecast, by Application 2019 & 2032
- Table 37: India Bio photonics Industry Revenue (Million) Forecast, by Application 2019 & 2032
- Table 38: India Bio photonics Industry Volume (K Unit) Forecast, by Application 2019 & 2032
- Table 39: Australia Bio photonics Industry Revenue (Million) Forecast, by Application 2019 & 2032
- Table 40: Australia Bio photonics Industry Volume (K Unit) Forecast, by Application 2019 & 2032
- Table 41: South Korea Bio photonics Industry Revenue (Million) Forecast, by Application 2019 & 2032
- Table 42: South Korea Bio photonics Industry Volume (K Unit) Forecast, by Application 2019 & 2032
- Table 43: Rest of Asia Pacific Bio photonics Industry Revenue (Million) Forecast, by Application 2019 & 2032
- Table 44: Rest of Asia Pacific Bio photonics Industry Volume (K Unit) Forecast, by Application 2019 & 2032
- Table 45: Global Bio photonics Industry Revenue Million Forecast, by Country 2019 & 2032
- Table 46: Global Bio photonics Industry Volume K Unit Forecast, by Country 2019 & 2032
- Table 47: GCC Bio photonics Industry Revenue (Million) Forecast, by Application 2019 & 2032
- Table 48: GCC Bio photonics Industry Volume (K Unit) Forecast, by Application 2019 & 2032
- Table 49: South Africa Bio photonics Industry Revenue (Million) Forecast, by Application 2019 & 2032
- Table 50: South Africa Bio photonics Industry Volume (K Unit) Forecast, by Application 2019 & 2032
- Table 51: Rest of Middle East and Africa Bio photonics Industry Revenue (Million) Forecast, by Application 2019 & 2032
- Table 52: Rest of Middle East and Africa Bio photonics Industry Volume (K Unit) Forecast, by Application 2019 & 2032
- Table 53: Global Bio photonics Industry Revenue Million Forecast, by Country 2019 & 2032
- Table 54: Global Bio photonics Industry Volume K Unit Forecast, by Country 2019 & 2032
- Table 55: Brazil Bio photonics Industry Revenue (Million) Forecast, by Application 2019 & 2032
- Table 56: Brazil Bio photonics Industry Volume (K Unit) Forecast, by Application 2019 & 2032
- Table 57: Argentina Bio photonics Industry Revenue (Million) Forecast, by Application 2019 & 2032
- Table 58: Argentina Bio photonics Industry Volume (K Unit) Forecast, by Application 2019 & 2032
- Table 59: Rest of South America Bio photonics Industry Revenue (Million) Forecast, by Application 2019 & 2032
- Table 60: Rest of South America Bio photonics Industry Volume (K Unit) Forecast, by Application 2019 & 2032
- Table 61: Global Bio photonics Industry Revenue Million Forecast, by Technology 2019 & 2032
- Table 62: Global Bio photonics Industry Volume K Unit Forecast, by Technology 2019 & 2032
- Table 63: Global Bio photonics Industry Revenue Million Forecast, by Application 2019 & 2032
- Table 64: Global Bio photonics Industry Volume K Unit Forecast, by Application 2019 & 2032
- Table 65: Global Bio photonics Industry Revenue Million Forecast, by Country 2019 & 2032
- Table 66: Global Bio photonics Industry Volume K Unit Forecast, by Country 2019 & 2032
- Table 67: United States Bio photonics Industry Revenue (Million) Forecast, by Application 2019 & 2032
- Table 68: United States Bio photonics Industry Volume (K Unit) Forecast, by Application 2019 & 2032
- Table 69: Canada Bio photonics Industry Revenue (Million) Forecast, by Application 2019 & 2032
- Table 70: Canada Bio photonics Industry Volume (K Unit) Forecast, by Application 2019 & 2032
- Table 71: Mexico Bio photonics Industry Revenue (Million) Forecast, by Application 2019 & 2032
- Table 72: Mexico Bio photonics Industry Volume (K Unit) Forecast, by Application 2019 & 2032
- Table 73: Global Bio photonics Industry Revenue Million Forecast, by Technology 2019 & 2032
- Table 74: Global Bio photonics Industry Volume K Unit Forecast, by Technology 2019 & 2032
- Table 75: Global Bio photonics Industry Revenue Million Forecast, by Application 2019 & 2032
- Table 76: Global Bio photonics Industry Volume K Unit Forecast, by Application 2019 & 2032
- Table 77: Global Bio photonics Industry Revenue Million Forecast, by Country 2019 & 2032
- Table 78: Global Bio photonics Industry Volume K Unit Forecast, by Country 2019 & 2032
- Table 79: Germany Bio photonics Industry Revenue (Million) Forecast, by Application 2019 & 2032
- Table 80: Germany Bio photonics Industry Volume (K Unit) Forecast, by Application 2019 & 2032
- Table 81: United Kingdom Bio photonics Industry Revenue (Million) Forecast, by Application 2019 & 2032
- Table 82: United Kingdom Bio photonics Industry Volume (K Unit) Forecast, by Application 2019 & 2032
- Table 83: France Bio photonics Industry Revenue (Million) Forecast, by Application 2019 & 2032
- Table 84: France Bio photonics Industry Volume (K Unit) Forecast, by Application 2019 & 2032
- Table 85: Italy Bio photonics Industry Revenue (Million) Forecast, by Application 2019 & 2032
- Table 86: Italy Bio photonics Industry Volume (K Unit) Forecast, by Application 2019 & 2032
- Table 87: Spain Bio photonics Industry Revenue (Million) Forecast, by Application 2019 & 2032
- Table 88: Spain Bio photonics Industry Volume (K Unit) Forecast, by Application 2019 & 2032
- Table 89: Rest of Europe Bio photonics Industry Revenue (Million) Forecast, by Application 2019 & 2032
- Table 90: Rest of Europe Bio photonics Industry Volume (K Unit) Forecast, by Application 2019 & 2032
- Table 91: Global Bio photonics Industry Revenue Million Forecast, by Technology 2019 & 2032
- Table 92: Global Bio photonics Industry Volume K Unit Forecast, by Technology 2019 & 2032
- Table 93: Global Bio photonics Industry Revenue Million Forecast, by Application 2019 & 2032
- Table 94: Global Bio photonics Industry Volume K Unit Forecast, by Application 2019 & 2032
- Table 95: Global Bio photonics Industry Revenue Million Forecast, by Country 2019 & 2032
- Table 96: Global Bio photonics Industry Volume K Unit Forecast, by Country 2019 & 2032
- Table 97: China Bio photonics Industry Revenue (Million) Forecast, by Application 2019 & 2032
- Table 98: China Bio photonics Industry Volume (K Unit) Forecast, by Application 2019 & 2032
- Table 99: Japan Bio photonics Industry Revenue (Million) Forecast, by Application 2019 & 2032
- Table 100: Japan Bio photonics Industry Volume (K Unit) Forecast, by Application 2019 & 2032
- Table 101: India Bio photonics Industry Revenue (Million) Forecast, by Application 2019 & 2032
- Table 102: India Bio photonics Industry Volume (K Unit) Forecast, by Application 2019 & 2032
- Table 103: Australia Bio photonics Industry Revenue (Million) Forecast, by Application 2019 & 2032
- Table 104: Australia Bio photonics Industry Volume (K Unit) Forecast, by Application 2019 & 2032
- Table 105: South Korea Bio photonics Industry Revenue (Million) Forecast, by Application 2019 & 2032
- Table 106: South Korea Bio photonics Industry Volume (K Unit) Forecast, by Application 2019 & 2032
- Table 107: Rest of Asia Pacific Bio photonics Industry Revenue (Million) Forecast, by Application 2019 & 2032
- Table 108: Rest of Asia Pacific Bio photonics Industry Volume (K Unit) Forecast, by Application 2019 & 2032
- Table 109: Global Bio photonics Industry Revenue Million Forecast, by Technology 2019 & 2032
- Table 110: Global Bio photonics Industry Volume K Unit Forecast, by Technology 2019 & 2032
- Table 111: Global Bio photonics Industry Revenue Million Forecast, by Application 2019 & 2032
- Table 112: Global Bio photonics Industry Volume K Unit Forecast, by Application 2019 & 2032
- Table 113: Global Bio photonics Industry Revenue Million Forecast, by Country 2019 & 2032
- Table 114: Global Bio photonics Industry Volume K Unit Forecast, by Country 2019 & 2032
- Table 115: GCC Bio photonics Industry Revenue (Million) Forecast, by Application 2019 & 2032
- Table 116: GCC Bio photonics Industry Volume (K Unit) Forecast, by Application 2019 & 2032
- Table 117: South Africa Bio photonics Industry Revenue (Million) Forecast, by Application 2019 & 2032
- Table 118: South Africa Bio photonics Industry Volume (K Unit) Forecast, by Application 2019 & 2032
- Table 119: Rest of Middle East and Africa Bio photonics Industry Revenue (Million) Forecast, by Application 2019 & 2032
- Table 120: Rest of Middle East and Africa Bio photonics Industry Volume (K Unit) Forecast, by Application 2019 & 2032
- Table 121: Global Bio photonics Industry Revenue Million Forecast, by Technology 2019 & 2032
- Table 122: Global Bio photonics Industry Volume K Unit Forecast, by Technology 2019 & 2032
- Table 123: Global Bio photonics Industry Revenue Million Forecast, by Application 2019 & 2032
- Table 124: Global Bio photonics Industry Volume K Unit Forecast, by Application 2019 & 2032
- Table 125: Global Bio photonics Industry Revenue Million Forecast, by Country 2019 & 2032
- Table 126: Global Bio photonics Industry Volume K Unit Forecast, by Country 2019 & 2032
- Table 127: Brazil Bio photonics Industry Revenue (Million) Forecast, by Application 2019 & 2032
- Table 128: Brazil Bio photonics Industry Volume (K Unit) Forecast, by Application 2019 & 2032
- Table 129: Argentina Bio photonics Industry Revenue (Million) Forecast, by Application 2019 & 2032
- Table 130: Argentina Bio photonics Industry Volume (K Unit) Forecast, by Application 2019 & 2032
- Table 131: Rest of South America Bio photonics Industry Revenue (Million) Forecast, by Application 2019 & 2032
- Table 132: Rest of South America Bio photonics Industry Volume (K Unit) Forecast, by Application 2019 & 2032
Frequently Asked Questions
1. What is the projected Compound Annual Growth Rate (CAGR) of the Bio photonics Industry?
The projected CAGR is approximately 10.50%.
2. Which companies are prominent players in the Bio photonics Industry?
Key companies in the market include Becton Dickinson and Company, NU Skin Enterprises, PerkinElmer, Hamamatsu Photonics KK, Zenalux Biomedical Inc, Glenbrook Technologies, Oxford Instruments PLC, Carl Zeiss AG, Olympus Corporation, Thermo Fisher Scientific.
3. What are the main segments of the Bio photonics Industry?
The market segments include Technology, Application.
4. Can you provide details about the market size?
The market size is estimated to be USD XX Million as of 2022.
5. What are some drivers contributing to market growth?
Growing Geriatric Population; Increasing Use of Biophotonics in Cell and Tissue Diagnostics; Emergence of Nanotechnology in Biophotonics; Development of Novel Photoacoustic Tomography (PAT) System.
6. What are the notable trends driving market growth?
Inside Imaging (Endoscopy) Segment is Expected to Witness Growth Over the Forecast Period.
7. Are there any restraints impacting market growth?
Lack of Awareness of Biophotonics Technology and Skilled Personnel; High Cost of Technology.
8. Can you provide examples of recent developments in the market?
In March 2021, Zeiss expanded its presence in North America by launching new research and development, production, sales, and customer service center in the United States with an investment of USD 180 million. The new site will incorporate the X-ray Microscopy business, along with the ZEISS Microscopy Customer Center, to provide support for the opportunities in materials research, life sciences, and industrial applications.
9. What pricing options are available for accessing the report?
Pricing options include single-user, multi-user, and enterprise licenses priced at USD 4750, USD 5250, and USD 8750 respectively.
10. Is the market size provided in terms of value or volume?
The market size is provided in terms of value, measured in Million and volume, measured in K Unit.
11. Are there any specific market keywords associated with the report?
Yes, the market keyword associated with the report is "Bio photonics Industry," which aids in identifying and referencing the specific market segment covered.
12. How do I determine which pricing option suits my needs best?
The pricing options vary based on user requirements and access needs. Individual users may opt for single-user licenses, while businesses requiring broader access may choose multi-user or enterprise licenses for cost-effective access to the report.
13. Are there any additional resources or data provided in the Bio photonics Industry report?
While the report offers comprehensive insights, it's advisable to review the specific contents or supplementary materials provided to ascertain if additional resources or data are available.
14. How can I stay updated on further developments or reports in the Bio photonics Industry?
To stay informed about further developments, trends, and reports in the Bio photonics Industry, consider subscribing to industry newsletters, following relevant companies and organizations, or regularly checking reputable industry news sources and publications.
Methodology
Step 1 - Identification of Relevant Samples Size from Population Database


Step 2 - Approaches for Defining Global Market Size (Value, Volume* & Price*)

Note*: In applicable scenarios
Step 3 - Data Sources
Primary Research
- Web Analytics
- Survey Reports
- Research Institute
- Latest Research Reports
- Opinion Leaders
Secondary Research
- Annual Reports
- White Paper
- Latest Press Release
- Industry Association
- Paid Database
- Investor Presentations

Step 4 - Data Triangulation
Involves using different sources of information in order to increase the validity of a study
These sources are likely to be stakeholders in a program - participants, other researchers, program staff, other community members, and so on.
Then we put all data in single framework & apply various statistical tools to find out the dynamic on the market.
During the analysis stage, feedback from the stakeholder groups would be compared to determine areas of agreement as well as areas of divergence
