

Key Insights
The Asia-Pacific (APAC) MRI systems market is experiencing robust growth, driven by factors such as rising prevalence of chronic diseases (cancer, cardiovascular disorders, neurological conditions), increasing healthcare expenditure, and expanding medical infrastructure across the region. China, Japan, India, and South Korea are major contributors to this growth, with increasing demand for advanced imaging technologies in both urban and rural settings. The adoption of high-field MRI systems is particularly notable, reflecting a preference for higher image resolution and diagnostic accuracy. Government initiatives promoting healthcare infrastructure development and initiatives focusing on early disease detection further fuel market expansion. However, challenges remain, including high system costs, limited skilled technicians in certain regions, and uneven distribution of healthcare resources across various APAC countries. The market segmentation reveals a strong preference for closed MRI systems due to their superior image quality, but open systems are gaining traction for patient comfort, particularly in claustrophobic patients. Competition is fierce, with both international and domestic players vying for market share. Companies are investing heavily in research and development, focusing on innovative technologies such as AI-powered image analysis to enhance diagnostic capabilities and improve workflow efficiency. The forecast period (2025-2033) anticipates sustained growth driven by the factors mentioned above, although the pace may vary across different countries based on their specific economic and healthcare landscapes. The market will likely witness increased strategic partnerships and collaborations between healthcare providers, technology companies, and government agencies to address the challenges and maximize the benefits of MRI technology in the region.
The continued growth trajectory for APAC’s MRI systems market is expected to be significantly influenced by the increasing adoption of advanced imaging techniques, the expanding medical tourism sector, and the rising demand for minimally invasive surgical procedures. Furthermore, technological advancements such as improved coil technology, faster scan times, and enhanced image processing are creating opportunities for market expansion. However, the market's growth will be moderated by factors like the relatively high cost of MRI systems, the need for specialized technical expertise, and the regulatory environment in different APAC countries. This requires market players to focus on strategies that cater to the specific needs and challenges of individual markets within the APAC region. A focus on affordable solutions and training programs that address the shortage of skilled technicians will be crucial for sustained growth and wider accessibility of MRI technology.
APAC MRI Systems Industry Market Report: 2019-2033
This comprehensive report provides a detailed analysis of the Asia-Pacific (APAC) Magnetic Resonance Imaging (MRI) systems market, offering invaluable insights for stakeholders across the industry value chain. Spanning the period from 2019 to 2033, with a focus on 2025, this report dissects market trends, technological advancements, competitive dynamics, and future growth prospects. The report leverages extensive data analysis to forecast a robust market expansion, identifying key drivers and potential challenges for investors, manufacturers, and healthcare providers.
APAC MRI Systems Industry Market Composition & Trends
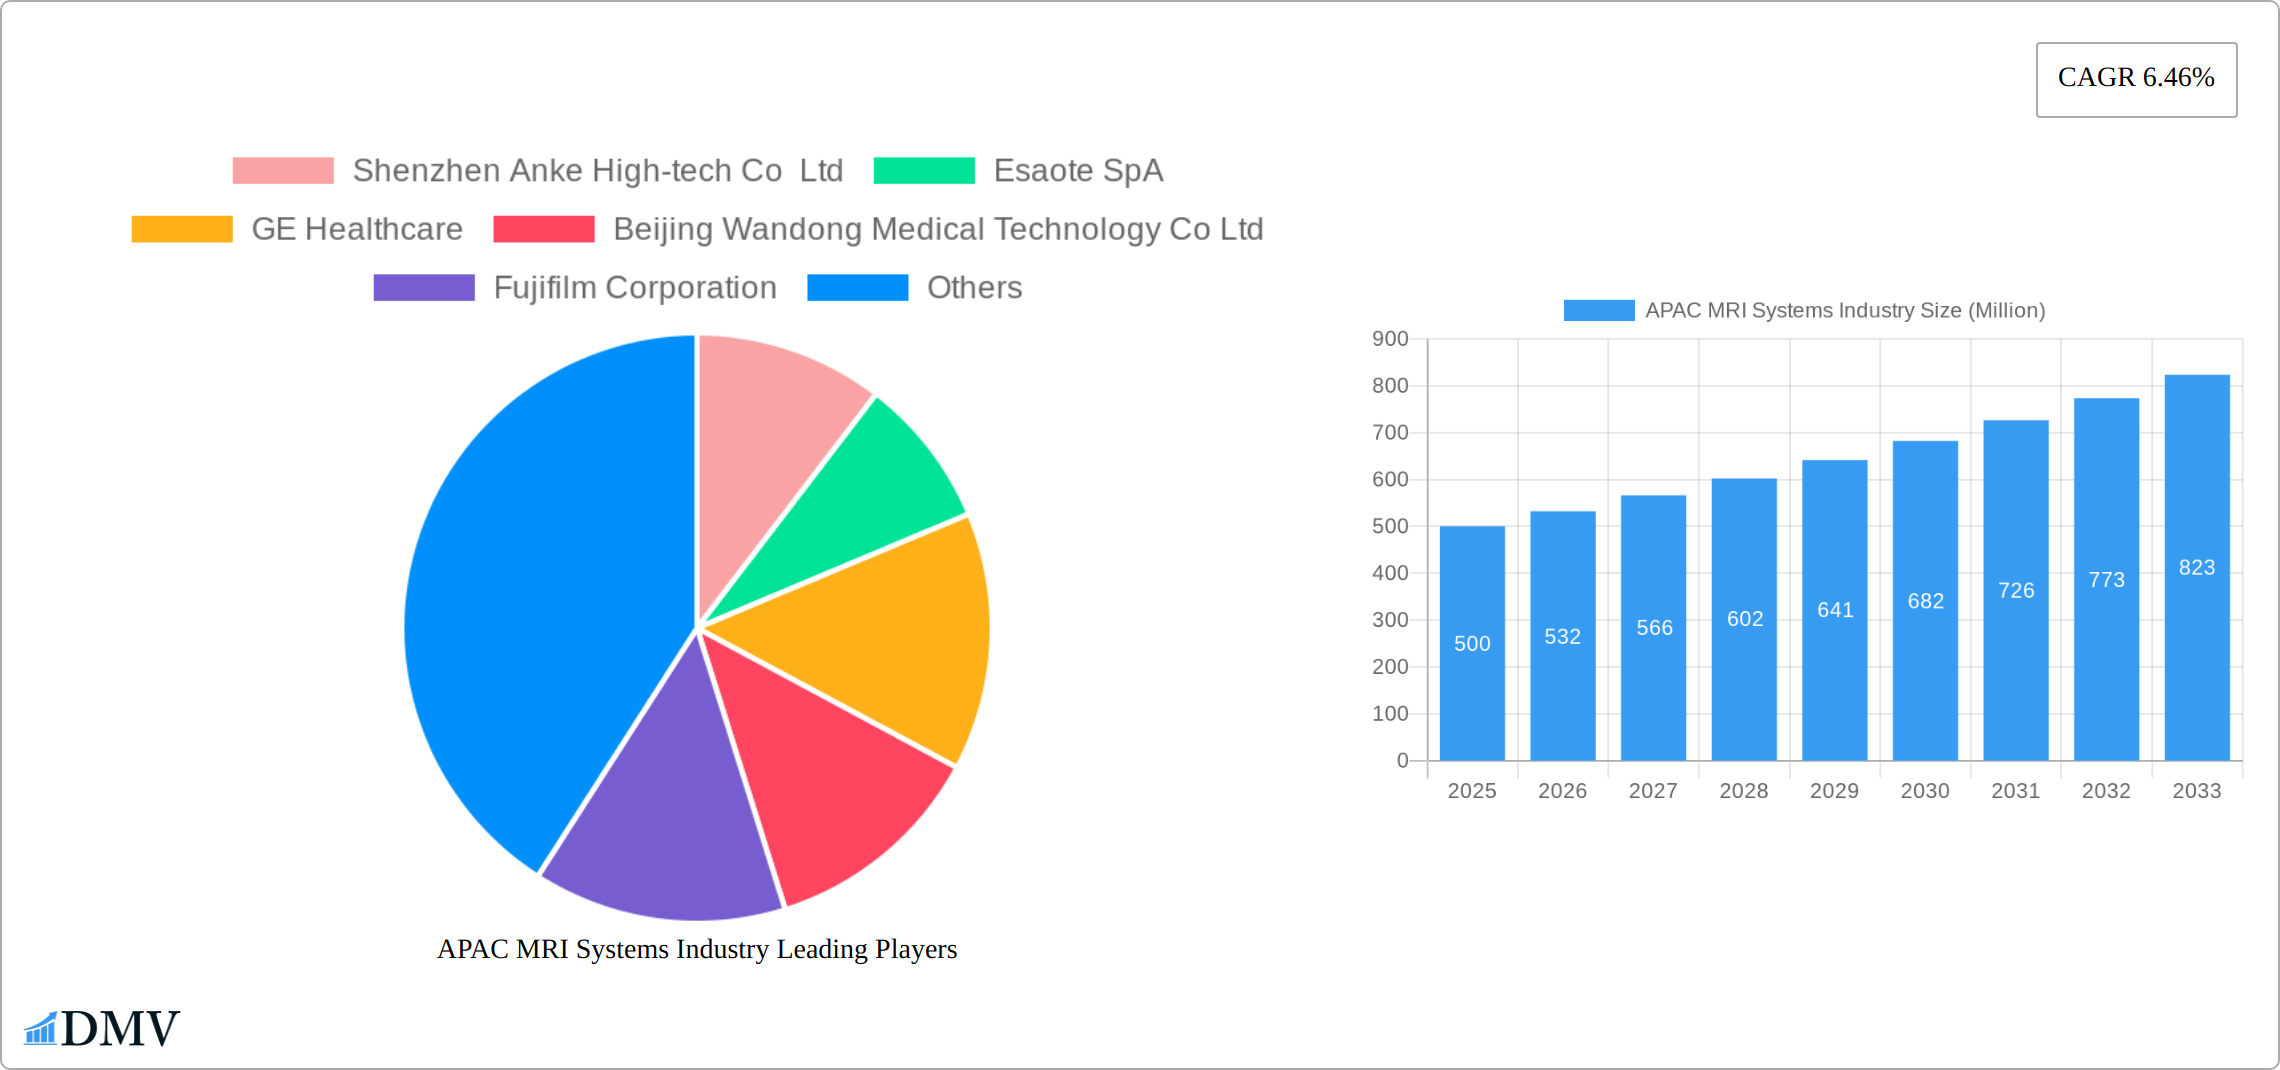
This section evaluates the APAC MRI systems market's competitive landscape, identifying key trends and influential factors. The market exhibits a moderately concentrated structure with several major players holding significant market share. Estimates indicate that the top five companies hold approximately XX% of the total market share in 2025, with the remaining share distributed amongst numerous smaller players. The market's evolution is fueled by continuous technological advancements, including the development of higher field strength MRI systems and improved image processing capabilities. Stringent regulatory frameworks across the region influence product approvals and market access. Substitute technologies, like CT scans and ultrasound, pose competitive pressure. The diverse end-user base comprises hospitals, diagnostic imaging centers, and research institutions. Mergers and acquisitions (M&A) activities remain a crucial factor, with estimated deal values totaling approximately $XX Million in 2024.
- Market Concentration: Top 5 players hold approximately XX% market share in 2025.
- Innovation Catalysts: Higher field strength systems, advanced imaging techniques.
- Regulatory Landscape: Stringent approval processes impacting market access.
- Substitute Products: CT scans, ultrasound impacting market growth.
- End-User Profiles: Hospitals, diagnostic centers, research institutions.
- M&A Activities: Estimated $XX Million in deal values in 2024.
APAC MRI Systems Industry Industry Evolution
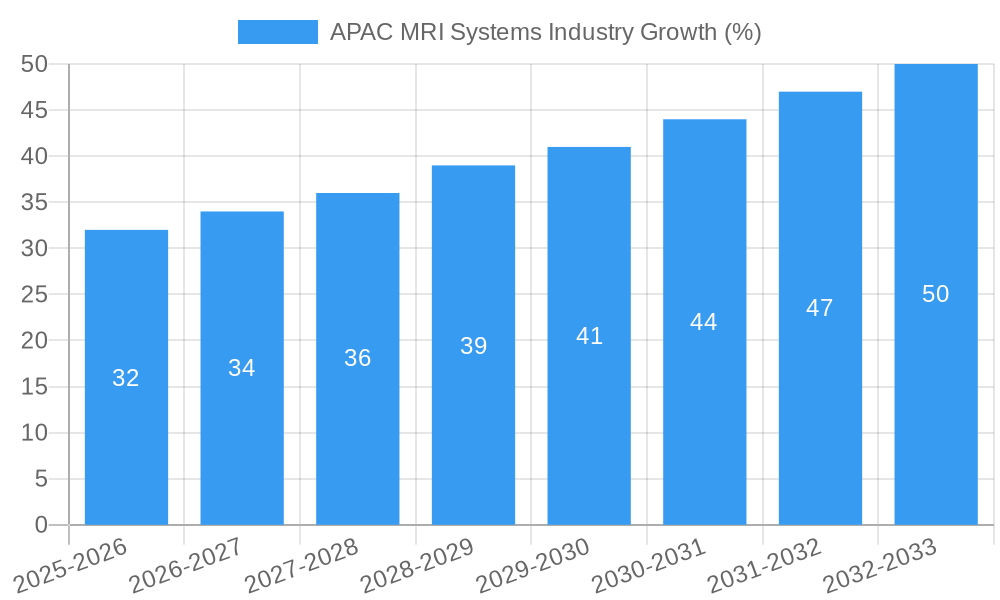
The APAC MRI systems market has witnessed significant growth from 2019 to 2024, driven primarily by rising healthcare expenditure, increasing prevalence of chronic diseases, and technological advancements leading to improved diagnostic capabilities. The market experienced a Compound Annual Growth Rate (CAGR) of approximately XX% during the historical period (2019-2024). This growth trajectory is anticipated to continue, albeit at a slightly moderated pace, during the forecast period (2025-2033), with a projected CAGR of XX%. Technological advancements, such as the introduction of artificial intelligence (AI) for image analysis and the development of more compact and user-friendly systems, are key drivers for market expansion. Changing consumer demands, such as a preference for faster scan times and improved patient comfort, are also shaping market trends. The adoption rate of high-field MRI systems is steadily increasing, reflecting a growing demand for higher resolution images.
Leading Regions, Countries, or Segments in APAC MRI Systems Industry
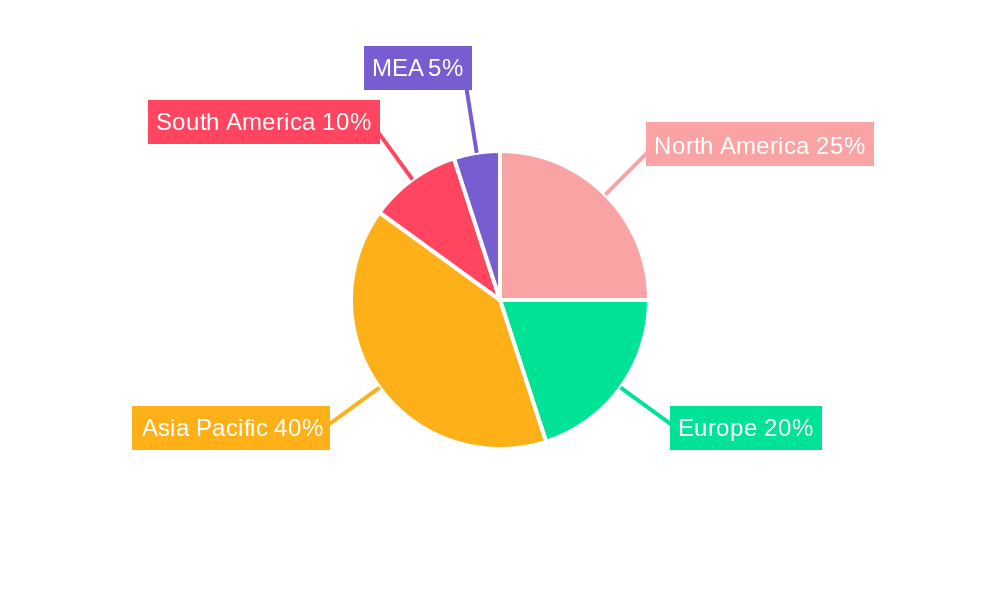
Within the dynamic APAC region, China and Japan stand out as the most significant markets for MRI systems. This dominance is underpinned by their substantial populations, well-established healthcare infrastructure, and continuous, substantial investments in advanced healthcare technology. Delving into specific market segments:
- By Architecture: While closed MRI systems continue to hold the largest market share due to their proven ability to deliver superior image quality, open MRI systems are steadily gaining traction. This growth is attributed to their enhanced patient comfort, making them a preferred choice for patients experiencing claustrophobia or requiring more accommodating imaging environments.
- By Field Strength: High-field MRI systems, specifically those operating at 1.5T and 3T, constitute the dominant segment. Ultra-high field MRI systems (7T and above) are also experiencing significant growth, driven by their exceptional image resolution and expanding range of sophisticated clinical applications. Low-field systems, while catering to more niche applications and cost-sensitive markets, remain an important part of the overall landscape.
- By Application: Oncology and neurology currently lead as the primary application segments. This leadership is a direct consequence of the high prevalence of related diseases and the indispensable role MRI plays in accurate diagnosis, precise treatment planning, and ongoing patient monitoring. Promising growth is anticipated in the cardiology and musculoskeletal application segments as well.
Key Market Drivers:
- Substantial and ongoing investments in upgrading and expanding healthcare infrastructure across the APAC region.
- Proactive government initiatives and supportive policies aimed at promoting the adoption of advanced medical technologies.
- The escalating prevalence of chronic diseases, which necessitates the use of advanced diagnostic tools like MRI for effective management.
- Growing awareness and demand for advanced diagnostic imaging solutions among both healthcare providers and patients.
APAC MRI Systems Industry Product Innovations
Recent innovations in APAC MRI systems focus on enhancing image quality, reducing scan times, and improving patient comfort. Key advancements include the development of AI-powered image reconstruction techniques, which enhance image clarity and reduce artifacts. Furthermore, manufacturers are integrating advanced coil technologies to improve signal-to-noise ratio and achieve better anatomical coverage. This leads to faster scan times and improved diagnostic accuracy. These innovations also include the introduction of more compact and open systems, addressing patient anxiety related to claustrophobia.
Propelling Factors for APAC MRI Systems Industry Growth
The APAC MRI systems market is experiencing robust growth, fueled by a confluence of powerful factors. Continuous technological advancements are leading to more sophisticated and efficient MRI scanners. Alongside this, a significant rise in healthcare expenditure and targeted investments in medical infrastructure are creating fertile ground for market expansion. The increasing prevalence of chronic and lifestyle-related diseases, such as cancer and neurological disorders, directly escalates the demand for advanced imaging solutions like MRI. Furthermore, supportive government regulations and initiatives aimed at modernizing healthcare systems are creating favorable market conditions. The integration of AI-powered image analysis is a particularly impactful development, promising to dramatically improve diagnostic accuracy and workflow efficiency. These combined forces are positioning the APAC MRI systems industry for sustained and significant growth.
Obstacles in the APAC MRI Systems Industry Market
Despite its promising growth trajectory, the APAC MRI systems market encounters several notable obstacles. Stringent and often lengthy regulatory approval processes in various countries can significantly increase the time to market for new technologies, adding to development costs. The high initial investment required for purchasing and installing MRI systems remains a barrier to widespread adoption, particularly in developing nations with limited healthcare budgets. Supply chain disruptions, which can be exacerbated by geopolitical factors and global events, pose a risk to the consistent availability of essential components. Moreover, intense competition among established global players and emerging local manufacturers can lead to significant price pressures, impacting profitability. These challenges collectively influence the pace and scope of market growth.
Future Opportunities in APAC MRI Systems Industry
The future of the APAC MRI systems industry is rich with opportunity. There is significant potential for expansion into less-penetrated emerging markets within the region, where the demand for advanced diagnostics is growing. A key focus for future growth will be the development and deployment of more cost-effective MRI systems, thereby enhancing affordability and accessibility for a broader patient base. Continued advancements in Artificial Intelligence (AI) and machine learning are poised to revolutionize image analysis, leading to improved diagnostic capabilities and faster interpretation times. The increasing demand for specialized MRI applications, such as detailed cardiovascular and advanced musculoskeletal imaging, will also carve out new and lucrative market segments. Furthermore, the trend towards integrated healthcare solutions and remote diagnostics presents further avenues for innovation and market penetration.
Major Players in the APAC MRI Systems Industry Ecosystem
- Shenzhen Anke High-tech Co Ltd
- Esaote SpA
- GE Healthcare
- Beijing Wandong Medical Technology Co Ltd
- Fujifilm Corporation
- Shenzhen Basda Medical Apparatus Co Ltd
- Neusoft Medical Systems Co Ltd
- Koninklijke Philips NV
- Canon Medical Systems Corporation
- Siemens Healthineers *List Not Exhaustive
Key Developments in APAC MRI Systems Industry Industry
- March 2022: Siemens Healthineers' commitment to expanding its footprint in Australia was evident with the installation of its advanced MRI scanner at North Eastern Community Hospital in the Benson Radiology department. This strategic placement signifies enhanced access to cutting-edge diagnostic technology within the Australian healthcare landscape.
- March 2022: Demonstrating its dedication to innovation and market engagement in India, Siemens Healthineers unveiled its unique MRI MAGNETOM FreeStar solutions at the prestigious 74th National Conference, IRIA 2022, held in Bengaluru. This event highlighted the company's forward-thinking approach and its focus on serving the growing Indian medical imaging market.
- Recent Advancements: Continuous innovation in superconducting magnet technology and coil design is leading to improved signal-to-noise ratios and faster scan times.
- AI Integration: The growing integration of AI and machine learning algorithms for image reconstruction, artifact reduction, and automated lesion detection is enhancing diagnostic accuracy and efficiency across the region.
Strategic APAC MRI Systems Industry Market Forecast
The APAC MRI systems market is poised for continued growth, driven by technological advancements, increasing healthcare spending, and a rising prevalence of chronic diseases. Opportunities abound in expanding into underserved regions, developing cost-effective solutions, and leveraging AI for enhanced diagnostics. The market's future success hinges on addressing challenges like regulatory hurdles and supply chain vulnerabilities. Continued innovation and strategic partnerships will be crucial for market players to capitalize on the significant growth potential.
APAC MRI Systems Industry Segmentation
-
1. Architecture
- 1.1. Closed MRI Systems
- 1.2. Open MRI Systems
-
2. Field Strength
- 2.1. Low Field MRI Systems
- 2.2. High Field MRI Systems
- 2.3. Very Hig
-
3. Application
- 3.1. Oncology
- 3.2. Neurology
- 3.3. Cardiology
- 3.4. Gastroenterology
- 3.5. Musculoskeletal
- 3.6. Other Applications
-
4. Geography
- 4.1. China
- 4.2. Japan
- 4.3. India
- 4.4. Australia
- 4.5. South Korea
- 4.6. Rest of Asia-Pacific
APAC MRI Systems Industry Segmentation By Geography
- 1. China
- 2. Japan
- 3. India
- 4. Australia
- 5. South Korea
- 6. Rest of Asia Pacific
APAC MRI Systems Industry REPORT HIGHLIGHTS
| Aspects | Details |
|---|---|
| Study Period | 2019-2033 |
| Base Year | 2024 |
| Estimated Year | 2025 |
| Forecast Period | 2025-2033 |
| Historical Period | 2019-2024 |
| Growth Rate | CAGR of 6.46% from 2019-2033 |
| Segmentation |
|
Table of Contents
- 1. Introduction
- 1.1. Research Scope
- 1.2. Market Segmentation
- 1.3. Research Methodology
- 1.4. Definitions and Assumptions
- 2. Executive Summary
- 2.1. Introduction
- 3. Market Dynamics
- 3.1. Introduction
- 3.2. Market Drivers
- 3.2.1. Increasing Burden of Chronic Diseases; Availability of Universal Health Coverage in Several Asian Countries; Introduction of Hybrid MRI Systems & Increasing Adoption in Emerging Asian Markets
- 3.3. Market Restrains
- 3.3.1. High Cost of MRI Systems; Declining Helium Availability
- 3.4. Market Trends
- 3.4.1. Neurology Segment is Expected to Hold Major Market Share and is Believed to Continue the Same Over the Forecast period
- 4. Market Factor Analysis
- 4.1. Porters Five Forces
- 4.2. Supply/Value Chain
- 4.3. PESTEL analysis
- 4.4. Market Entropy
- 4.5. Patent/Trademark Analysis
- 5. Global APAC MRI Systems Industry Analysis, Insights and Forecast, 2019-2031
- 5.1. Market Analysis, Insights and Forecast - by Architecture
- 5.1.1. Closed MRI Systems
- 5.1.2. Open MRI Systems
- 5.2. Market Analysis, Insights and Forecast - by Field Strength
- 5.2.1. Low Field MRI Systems
- 5.2.2. High Field MRI Systems
- 5.2.3. Very Hig
- 5.3. Market Analysis, Insights and Forecast - by Application
- 5.3.1. Oncology
- 5.3.2. Neurology
- 5.3.3. Cardiology
- 5.3.4. Gastroenterology
- 5.3.5. Musculoskeletal
- 5.3.6. Other Applications
- 5.4. Market Analysis, Insights and Forecast - by Geography
- 5.4.1. China
- 5.4.2. Japan
- 5.4.3. India
- 5.4.4. Australia
- 5.4.5. South Korea
- 5.4.6. Rest of Asia-Pacific
- 5.5. Market Analysis, Insights and Forecast - by Region
- 5.5.1. China
- 5.5.2. Japan
- 5.5.3. India
- 5.5.4. Australia
- 5.5.5. South Korea
- 5.5.6. Rest of Asia Pacific
- 5.1. Market Analysis, Insights and Forecast - by Architecture
- 6. China APAC MRI Systems Industry Analysis, Insights and Forecast, 2019-2031
- 6.1. Market Analysis, Insights and Forecast - by Architecture
- 6.1.1. Closed MRI Systems
- 6.1.2. Open MRI Systems
- 6.2. Market Analysis, Insights and Forecast - by Field Strength
- 6.2.1. Low Field MRI Systems
- 6.2.2. High Field MRI Systems
- 6.2.3. Very Hig
- 6.3. Market Analysis, Insights and Forecast - by Application
- 6.3.1. Oncology
- 6.3.2. Neurology
- 6.3.3. Cardiology
- 6.3.4. Gastroenterology
- 6.3.5. Musculoskeletal
- 6.3.6. Other Applications
- 6.4. Market Analysis, Insights and Forecast - by Geography
- 6.4.1. China
- 6.4.2. Japan
- 6.4.3. India
- 6.4.4. Australia
- 6.4.5. South Korea
- 6.4.6. Rest of Asia-Pacific
- 6.1. Market Analysis, Insights and Forecast - by Architecture
- 7. Japan APAC MRI Systems Industry Analysis, Insights and Forecast, 2019-2031
- 7.1. Market Analysis, Insights and Forecast - by Architecture
- 7.1.1. Closed MRI Systems
- 7.1.2. Open MRI Systems
- 7.2. Market Analysis, Insights and Forecast - by Field Strength
- 7.2.1. Low Field MRI Systems
- 7.2.2. High Field MRI Systems
- 7.2.3. Very Hig
- 7.3. Market Analysis, Insights and Forecast - by Application
- 7.3.1. Oncology
- 7.3.2. Neurology
- 7.3.3. Cardiology
- 7.3.4. Gastroenterology
- 7.3.5. Musculoskeletal
- 7.3.6. Other Applications
- 7.4. Market Analysis, Insights and Forecast - by Geography
- 7.4.1. China
- 7.4.2. Japan
- 7.4.3. India
- 7.4.4. Australia
- 7.4.5. South Korea
- 7.4.6. Rest of Asia-Pacific
- 7.1. Market Analysis, Insights and Forecast - by Architecture
- 8. India APAC MRI Systems Industry Analysis, Insights and Forecast, 2019-2031
- 8.1. Market Analysis, Insights and Forecast - by Architecture
- 8.1.1. Closed MRI Systems
- 8.1.2. Open MRI Systems
- 8.2. Market Analysis, Insights and Forecast - by Field Strength
- 8.2.1. Low Field MRI Systems
- 8.2.2. High Field MRI Systems
- 8.2.3. Very Hig
- 8.3. Market Analysis, Insights and Forecast - by Application
- 8.3.1. Oncology
- 8.3.2. Neurology
- 8.3.3. Cardiology
- 8.3.4. Gastroenterology
- 8.3.5. Musculoskeletal
- 8.3.6. Other Applications
- 8.4. Market Analysis, Insights and Forecast - by Geography
- 8.4.1. China
- 8.4.2. Japan
- 8.4.3. India
- 8.4.4. Australia
- 8.4.5. South Korea
- 8.4.6. Rest of Asia-Pacific
- 8.1. Market Analysis, Insights and Forecast - by Architecture
- 9. Australia APAC MRI Systems Industry Analysis, Insights and Forecast, 2019-2031
- 9.1. Market Analysis, Insights and Forecast - by Architecture
- 9.1.1. Closed MRI Systems
- 9.1.2. Open MRI Systems
- 9.2. Market Analysis, Insights and Forecast - by Field Strength
- 9.2.1. Low Field MRI Systems
- 9.2.2. High Field MRI Systems
- 9.2.3. Very Hig
- 9.3. Market Analysis, Insights and Forecast - by Application
- 9.3.1. Oncology
- 9.3.2. Neurology
- 9.3.3. Cardiology
- 9.3.4. Gastroenterology
- 9.3.5. Musculoskeletal
- 9.3.6. Other Applications
- 9.4. Market Analysis, Insights and Forecast - by Geography
- 9.4.1. China
- 9.4.2. Japan
- 9.4.3. India
- 9.4.4. Australia
- 9.4.5. South Korea
- 9.4.6. Rest of Asia-Pacific
- 9.1. Market Analysis, Insights and Forecast - by Architecture
- 10. South Korea APAC MRI Systems Industry Analysis, Insights and Forecast, 2019-2031
- 10.1. Market Analysis, Insights and Forecast - by Architecture
- 10.1.1. Closed MRI Systems
- 10.1.2. Open MRI Systems
- 10.2. Market Analysis, Insights and Forecast - by Field Strength
- 10.2.1. Low Field MRI Systems
- 10.2.2. High Field MRI Systems
- 10.2.3. Very Hig
- 10.3. Market Analysis, Insights and Forecast - by Application
- 10.3.1. Oncology
- 10.3.2. Neurology
- 10.3.3. Cardiology
- 10.3.4. Gastroenterology
- 10.3.5. Musculoskeletal
- 10.3.6. Other Applications
- 10.4. Market Analysis, Insights and Forecast - by Geography
- 10.4.1. China
- 10.4.2. Japan
- 10.4.3. India
- 10.4.4. Australia
- 10.4.5. South Korea
- 10.4.6. Rest of Asia-Pacific
- 10.1. Market Analysis, Insights and Forecast - by Architecture
- 11. Rest of Asia Pacific APAC MRI Systems Industry Analysis, Insights and Forecast, 2019-2031
- 11.1. Market Analysis, Insights and Forecast - by Architecture
- 11.1.1. Closed MRI Systems
- 11.1.2. Open MRI Systems
- 11.2. Market Analysis, Insights and Forecast - by Field Strength
- 11.2.1. Low Field MRI Systems
- 11.2.2. High Field MRI Systems
- 11.2.3. Very Hig
- 11.3. Market Analysis, Insights and Forecast - by Application
- 11.3.1. Oncology
- 11.3.2. Neurology
- 11.3.3. Cardiology
- 11.3.4. Gastroenterology
- 11.3.5. Musculoskeletal
- 11.3.6. Other Applications
- 11.4. Market Analysis, Insights and Forecast - by Geography
- 11.4.1. China
- 11.4.2. Japan
- 11.4.3. India
- 11.4.4. Australia
- 11.4.5. South Korea
- 11.4.6. Rest of Asia-Pacific
- 11.1. Market Analysis, Insights and Forecast - by Architecture
- 12. North America APAC MRI Systems Industry Analysis, Insights and Forecast, 2019-2031
- 12.1. Market Analysis, Insights and Forecast - By Country/Sub-region
- 12.1.1 United States
- 12.1.2 Canada
- 12.1.3 Mexico
- 13. Europe APAC MRI Systems Industry Analysis, Insights and Forecast, 2019-2031
- 13.1. Market Analysis, Insights and Forecast - By Country/Sub-region
- 13.1.1 Germany
- 13.1.2 United Kingdom
- 13.1.3 France
- 13.1.4 Spain
- 13.1.5 Italy
- 13.1.6 Spain
- 13.1.7 Belgium
- 13.1.8 Netherland
- 13.1.9 Nordics
- 13.1.10 Rest of Europe
- 14. Asia Pacific APAC MRI Systems Industry Analysis, Insights and Forecast, 2019-2031
- 14.1. Market Analysis, Insights and Forecast - By Country/Sub-region
- 14.1.1 China
- 14.1.2 Japan
- 14.1.3 India
- 14.1.4 South Korea
- 14.1.5 Southeast Asia
- 14.1.6 Australia
- 14.1.7 Indonesia
- 14.1.8 Phillipes
- 14.1.9 Singapore
- 14.1.10 Thailandc
- 14.1.11 Rest of Asia Pacific
- 15. South America APAC MRI Systems Industry Analysis, Insights and Forecast, 2019-2031
- 15.1. Market Analysis, Insights and Forecast - By Country/Sub-region
- 15.1.1 Brazil
- 15.1.2 Argentina
- 15.1.3 Peru
- 15.1.4 Chile
- 15.1.5 Colombia
- 15.1.6 Ecuador
- 15.1.7 Venezuela
- 15.1.8 Rest of South America
- 16. North America APAC MRI Systems Industry Analysis, Insights and Forecast, 2019-2031
- 16.1. Market Analysis, Insights and Forecast - By Country/Sub-region
- 16.1.1 United States
- 16.1.2 Canada
- 16.1.3 Mexico
- 17. MEA APAC MRI Systems Industry Analysis, Insights and Forecast, 2019-2031
- 17.1. Market Analysis, Insights and Forecast - By Country/Sub-region
- 17.1.1 United Arab Emirates
- 17.1.2 Saudi Arabia
- 17.1.3 South Africa
- 17.1.4 Rest of Middle East and Africa
- 18. Competitive Analysis
- 18.1. Global Market Share Analysis 2024
- 18.2. Company Profiles
- 18.2.1 Shenzhen Anke High-tech Co Ltd
- 18.2.1.1. Overview
- 18.2.1.2. Products
- 18.2.1.3. SWOT Analysis
- 18.2.1.4. Recent Developments
- 18.2.1.5. Financials (Based on Availability)
- 18.2.2 Esaote SpA
- 18.2.2.1. Overview
- 18.2.2.2. Products
- 18.2.2.3. SWOT Analysis
- 18.2.2.4. Recent Developments
- 18.2.2.5. Financials (Based on Availability)
- 18.2.3 GE Healthcare
- 18.2.3.1. Overview
- 18.2.3.2. Products
- 18.2.3.3. SWOT Analysis
- 18.2.3.4. Recent Developments
- 18.2.3.5. Financials (Based on Availability)
- 18.2.4 Beijing Wandong Medical Technology Co Ltd
- 18.2.4.1. Overview
- 18.2.4.2. Products
- 18.2.4.3. SWOT Analysis
- 18.2.4.4. Recent Developments
- 18.2.4.5. Financials (Based on Availability)
- 18.2.5 Fujifilm Corporation
- 18.2.5.1. Overview
- 18.2.5.2. Products
- 18.2.5.3. SWOT Analysis
- 18.2.5.4. Recent Developments
- 18.2.5.5. Financials (Based on Availability)
- 18.2.6 Shenzhen Basda Medical Apparatus Co Ltd
- 18.2.6.1. Overview
- 18.2.6.2. Products
- 18.2.6.3. SWOT Analysis
- 18.2.6.4. Recent Developments
- 18.2.6.5. Financials (Based on Availability)
- 18.2.7 Neusoft Medical Systems Co Ltd
- 18.2.7.1. Overview
- 18.2.7.2. Products
- 18.2.7.3. SWOT Analysis
- 18.2.7.4. Recent Developments
- 18.2.7.5. Financials (Based on Availability)
- 18.2.8 Koninklijke Philips NV
- 18.2.8.1. Overview
- 18.2.8.2. Products
- 18.2.8.3. SWOT Analysis
- 18.2.8.4. Recent Developments
- 18.2.8.5. Financials (Based on Availability)
- 18.2.9 Canon Medical Systems Corporation
- 18.2.9.1. Overview
- 18.2.9.2. Products
- 18.2.9.3. SWOT Analysis
- 18.2.9.4. Recent Developments
- 18.2.9.5. Financials (Based on Availability)
- 18.2.10 Siemens Healthineers*List Not Exhaustive
- 18.2.10.1. Overview
- 18.2.10.2. Products
- 18.2.10.3. SWOT Analysis
- 18.2.10.4. Recent Developments
- 18.2.10.5. Financials (Based on Availability)
- 18.2.1 Shenzhen Anke High-tech Co Ltd
List of Figures
- Figure 1: Global APAC MRI Systems Industry Revenue Breakdown (Million, %) by Region 2024 & 2032
- Figure 2: North America APAC MRI Systems Industry Revenue (Million), by Country 2024 & 2032
- Figure 3: North America APAC MRI Systems Industry Revenue Share (%), by Country 2024 & 2032
- Figure 4: Europe APAC MRI Systems Industry Revenue (Million), by Country 2024 & 2032
- Figure 5: Europe APAC MRI Systems Industry Revenue Share (%), by Country 2024 & 2032
- Figure 6: Asia Pacific APAC MRI Systems Industry Revenue (Million), by Country 2024 & 2032
- Figure 7: Asia Pacific APAC MRI Systems Industry Revenue Share (%), by Country 2024 & 2032
- Figure 8: South America APAC MRI Systems Industry Revenue (Million), by Country 2024 & 2032
- Figure 9: South America APAC MRI Systems Industry Revenue Share (%), by Country 2024 & 2032
- Figure 10: North America APAC MRI Systems Industry Revenue (Million), by Country 2024 & 2032
- Figure 11: North America APAC MRI Systems Industry Revenue Share (%), by Country 2024 & 2032
- Figure 12: MEA APAC MRI Systems Industry Revenue (Million), by Country 2024 & 2032
- Figure 13: MEA APAC MRI Systems Industry Revenue Share (%), by Country 2024 & 2032
- Figure 14: China APAC MRI Systems Industry Revenue (Million), by Architecture 2024 & 2032
- Figure 15: China APAC MRI Systems Industry Revenue Share (%), by Architecture 2024 & 2032
- Figure 16: China APAC MRI Systems Industry Revenue (Million), by Field Strength 2024 & 2032
- Figure 17: China APAC MRI Systems Industry Revenue Share (%), by Field Strength 2024 & 2032
- Figure 18: China APAC MRI Systems Industry Revenue (Million), by Application 2024 & 2032
- Figure 19: China APAC MRI Systems Industry Revenue Share (%), by Application 2024 & 2032
- Figure 20: China APAC MRI Systems Industry Revenue (Million), by Geography 2024 & 2032
- Figure 21: China APAC MRI Systems Industry Revenue Share (%), by Geography 2024 & 2032
- Figure 22: China APAC MRI Systems Industry Revenue (Million), by Country 2024 & 2032
- Figure 23: China APAC MRI Systems Industry Revenue Share (%), by Country 2024 & 2032
- Figure 24: Japan APAC MRI Systems Industry Revenue (Million), by Architecture 2024 & 2032
- Figure 25: Japan APAC MRI Systems Industry Revenue Share (%), by Architecture 2024 & 2032
- Figure 26: Japan APAC MRI Systems Industry Revenue (Million), by Field Strength 2024 & 2032
- Figure 27: Japan APAC MRI Systems Industry Revenue Share (%), by Field Strength 2024 & 2032
- Figure 28: Japan APAC MRI Systems Industry Revenue (Million), by Application 2024 & 2032
- Figure 29: Japan APAC MRI Systems Industry Revenue Share (%), by Application 2024 & 2032
- Figure 30: Japan APAC MRI Systems Industry Revenue (Million), by Geography 2024 & 2032
- Figure 31: Japan APAC MRI Systems Industry Revenue Share (%), by Geography 2024 & 2032
- Figure 32: Japan APAC MRI Systems Industry Revenue (Million), by Country 2024 & 2032
- Figure 33: Japan APAC MRI Systems Industry Revenue Share (%), by Country 2024 & 2032
- Figure 34: India APAC MRI Systems Industry Revenue (Million), by Architecture 2024 & 2032
- Figure 35: India APAC MRI Systems Industry Revenue Share (%), by Architecture 2024 & 2032
- Figure 36: India APAC MRI Systems Industry Revenue (Million), by Field Strength 2024 & 2032
- Figure 37: India APAC MRI Systems Industry Revenue Share (%), by Field Strength 2024 & 2032
- Figure 38: India APAC MRI Systems Industry Revenue (Million), by Application 2024 & 2032
- Figure 39: India APAC MRI Systems Industry Revenue Share (%), by Application 2024 & 2032
- Figure 40: India APAC MRI Systems Industry Revenue (Million), by Geography 2024 & 2032
- Figure 41: India APAC MRI Systems Industry Revenue Share (%), by Geography 2024 & 2032
- Figure 42: India APAC MRI Systems Industry Revenue (Million), by Country 2024 & 2032
- Figure 43: India APAC MRI Systems Industry Revenue Share (%), by Country 2024 & 2032
- Figure 44: Australia APAC MRI Systems Industry Revenue (Million), by Architecture 2024 & 2032
- Figure 45: Australia APAC MRI Systems Industry Revenue Share (%), by Architecture 2024 & 2032
- Figure 46: Australia APAC MRI Systems Industry Revenue (Million), by Field Strength 2024 & 2032
- Figure 47: Australia APAC MRI Systems Industry Revenue Share (%), by Field Strength 2024 & 2032
- Figure 48: Australia APAC MRI Systems Industry Revenue (Million), by Application 2024 & 2032
- Figure 49: Australia APAC MRI Systems Industry Revenue Share (%), by Application 2024 & 2032
- Figure 50: Australia APAC MRI Systems Industry Revenue (Million), by Geography 2024 & 2032
- Figure 51: Australia APAC MRI Systems Industry Revenue Share (%), by Geography 2024 & 2032
- Figure 52: Australia APAC MRI Systems Industry Revenue (Million), by Country 2024 & 2032
- Figure 53: Australia APAC MRI Systems Industry Revenue Share (%), by Country 2024 & 2032
- Figure 54: South Korea APAC MRI Systems Industry Revenue (Million), by Architecture 2024 & 2032
- Figure 55: South Korea APAC MRI Systems Industry Revenue Share (%), by Architecture 2024 & 2032
- Figure 56: South Korea APAC MRI Systems Industry Revenue (Million), by Field Strength 2024 & 2032
- Figure 57: South Korea APAC MRI Systems Industry Revenue Share (%), by Field Strength 2024 & 2032
- Figure 58: South Korea APAC MRI Systems Industry Revenue (Million), by Application 2024 & 2032
- Figure 59: South Korea APAC MRI Systems Industry Revenue Share (%), by Application 2024 & 2032
- Figure 60: South Korea APAC MRI Systems Industry Revenue (Million), by Geography 2024 & 2032
- Figure 61: South Korea APAC MRI Systems Industry Revenue Share (%), by Geography 2024 & 2032
- Figure 62: South Korea APAC MRI Systems Industry Revenue (Million), by Country 2024 & 2032
- Figure 63: South Korea APAC MRI Systems Industry Revenue Share (%), by Country 2024 & 2032
- Figure 64: Rest of Asia Pacific APAC MRI Systems Industry Revenue (Million), by Architecture 2024 & 2032
- Figure 65: Rest of Asia Pacific APAC MRI Systems Industry Revenue Share (%), by Architecture 2024 & 2032
- Figure 66: Rest of Asia Pacific APAC MRI Systems Industry Revenue (Million), by Field Strength 2024 & 2032
- Figure 67: Rest of Asia Pacific APAC MRI Systems Industry Revenue Share (%), by Field Strength 2024 & 2032
- Figure 68: Rest of Asia Pacific APAC MRI Systems Industry Revenue (Million), by Application 2024 & 2032
- Figure 69: Rest of Asia Pacific APAC MRI Systems Industry Revenue Share (%), by Application 2024 & 2032
- Figure 70: Rest of Asia Pacific APAC MRI Systems Industry Revenue (Million), by Geography 2024 & 2032
- Figure 71: Rest of Asia Pacific APAC MRI Systems Industry Revenue Share (%), by Geography 2024 & 2032
- Figure 72: Rest of Asia Pacific APAC MRI Systems Industry Revenue (Million), by Country 2024 & 2032
- Figure 73: Rest of Asia Pacific APAC MRI Systems Industry Revenue Share (%), by Country 2024 & 2032
List of Tables
- Table 1: Global APAC MRI Systems Industry Revenue Million Forecast, by Region 2019 & 2032
- Table 2: Global APAC MRI Systems Industry Revenue Million Forecast, by Architecture 2019 & 2032
- Table 3: Global APAC MRI Systems Industry Revenue Million Forecast, by Field Strength 2019 & 2032
- Table 4: Global APAC MRI Systems Industry Revenue Million Forecast, by Application 2019 & 2032
- Table 5: Global APAC MRI Systems Industry Revenue Million Forecast, by Geography 2019 & 2032
- Table 6: Global APAC MRI Systems Industry Revenue Million Forecast, by Region 2019 & 2032
- Table 7: Global APAC MRI Systems Industry Revenue Million Forecast, by Country 2019 & 2032
- Table 8: United States APAC MRI Systems Industry Revenue (Million) Forecast, by Application 2019 & 2032
- Table 9: Canada APAC MRI Systems Industry Revenue (Million) Forecast, by Application 2019 & 2032
- Table 10: Mexico APAC MRI Systems Industry Revenue (Million) Forecast, by Application 2019 & 2032
- Table 11: Global APAC MRI Systems Industry Revenue Million Forecast, by Country 2019 & 2032
- Table 12: Germany APAC MRI Systems Industry Revenue (Million) Forecast, by Application 2019 & 2032
- Table 13: United Kingdom APAC MRI Systems Industry Revenue (Million) Forecast, by Application 2019 & 2032
- Table 14: France APAC MRI Systems Industry Revenue (Million) Forecast, by Application 2019 & 2032
- Table 15: Spain APAC MRI Systems Industry Revenue (Million) Forecast, by Application 2019 & 2032
- Table 16: Italy APAC MRI Systems Industry Revenue (Million) Forecast, by Application 2019 & 2032
- Table 17: Spain APAC MRI Systems Industry Revenue (Million) Forecast, by Application 2019 & 2032
- Table 18: Belgium APAC MRI Systems Industry Revenue (Million) Forecast, by Application 2019 & 2032
- Table 19: Netherland APAC MRI Systems Industry Revenue (Million) Forecast, by Application 2019 & 2032
- Table 20: Nordics APAC MRI Systems Industry Revenue (Million) Forecast, by Application 2019 & 2032
- Table 21: Rest of Europe APAC MRI Systems Industry Revenue (Million) Forecast, by Application 2019 & 2032
- Table 22: Global APAC MRI Systems Industry Revenue Million Forecast, by Country 2019 & 2032
- Table 23: China APAC MRI Systems Industry Revenue (Million) Forecast, by Application 2019 & 2032
- Table 24: Japan APAC MRI Systems Industry Revenue (Million) Forecast, by Application 2019 & 2032
- Table 25: India APAC MRI Systems Industry Revenue (Million) Forecast, by Application 2019 & 2032
- Table 26: South Korea APAC MRI Systems Industry Revenue (Million) Forecast, by Application 2019 & 2032
- Table 27: Southeast Asia APAC MRI Systems Industry Revenue (Million) Forecast, by Application 2019 & 2032
- Table 28: Australia APAC MRI Systems Industry Revenue (Million) Forecast, by Application 2019 & 2032
- Table 29: Indonesia APAC MRI Systems Industry Revenue (Million) Forecast, by Application 2019 & 2032
- Table 30: Phillipes APAC MRI Systems Industry Revenue (Million) Forecast, by Application 2019 & 2032
- Table 31: Singapore APAC MRI Systems Industry Revenue (Million) Forecast, by Application 2019 & 2032
- Table 32: Thailandc APAC MRI Systems Industry Revenue (Million) Forecast, by Application 2019 & 2032
- Table 33: Rest of Asia Pacific APAC MRI Systems Industry Revenue (Million) Forecast, by Application 2019 & 2032
- Table 34: Global APAC MRI Systems Industry Revenue Million Forecast, by Country 2019 & 2032
- Table 35: Brazil APAC MRI Systems Industry Revenue (Million) Forecast, by Application 2019 & 2032
- Table 36: Argentina APAC MRI Systems Industry Revenue (Million) Forecast, by Application 2019 & 2032
- Table 37: Peru APAC MRI Systems Industry Revenue (Million) Forecast, by Application 2019 & 2032
- Table 38: Chile APAC MRI Systems Industry Revenue (Million) Forecast, by Application 2019 & 2032
- Table 39: Colombia APAC MRI Systems Industry Revenue (Million) Forecast, by Application 2019 & 2032
- Table 40: Ecuador APAC MRI Systems Industry Revenue (Million) Forecast, by Application 2019 & 2032
- Table 41: Venezuela APAC MRI Systems Industry Revenue (Million) Forecast, by Application 2019 & 2032
- Table 42: Rest of South America APAC MRI Systems Industry Revenue (Million) Forecast, by Application 2019 & 2032
- Table 43: Global APAC MRI Systems Industry Revenue Million Forecast, by Country 2019 & 2032
- Table 44: United States APAC MRI Systems Industry Revenue (Million) Forecast, by Application 2019 & 2032
- Table 45: Canada APAC MRI Systems Industry Revenue (Million) Forecast, by Application 2019 & 2032
- Table 46: Mexico APAC MRI Systems Industry Revenue (Million) Forecast, by Application 2019 & 2032
- Table 47: Global APAC MRI Systems Industry Revenue Million Forecast, by Country 2019 & 2032
- Table 48: United Arab Emirates APAC MRI Systems Industry Revenue (Million) Forecast, by Application 2019 & 2032
- Table 49: Saudi Arabia APAC MRI Systems Industry Revenue (Million) Forecast, by Application 2019 & 2032
- Table 50: South Africa APAC MRI Systems Industry Revenue (Million) Forecast, by Application 2019 & 2032
- Table 51: Rest of Middle East and Africa APAC MRI Systems Industry Revenue (Million) Forecast, by Application 2019 & 2032
- Table 52: Global APAC MRI Systems Industry Revenue Million Forecast, by Architecture 2019 & 2032
- Table 53: Global APAC MRI Systems Industry Revenue Million Forecast, by Field Strength 2019 & 2032
- Table 54: Global APAC MRI Systems Industry Revenue Million Forecast, by Application 2019 & 2032
- Table 55: Global APAC MRI Systems Industry Revenue Million Forecast, by Geography 2019 & 2032
- Table 56: Global APAC MRI Systems Industry Revenue Million Forecast, by Country 2019 & 2032
- Table 57: Global APAC MRI Systems Industry Revenue Million Forecast, by Architecture 2019 & 2032
- Table 58: Global APAC MRI Systems Industry Revenue Million Forecast, by Field Strength 2019 & 2032
- Table 59: Global APAC MRI Systems Industry Revenue Million Forecast, by Application 2019 & 2032
- Table 60: Global APAC MRI Systems Industry Revenue Million Forecast, by Geography 2019 & 2032
- Table 61: Global APAC MRI Systems Industry Revenue Million Forecast, by Country 2019 & 2032
- Table 62: Global APAC MRI Systems Industry Revenue Million Forecast, by Architecture 2019 & 2032
- Table 63: Global APAC MRI Systems Industry Revenue Million Forecast, by Field Strength 2019 & 2032
- Table 64: Global APAC MRI Systems Industry Revenue Million Forecast, by Application 2019 & 2032
- Table 65: Global APAC MRI Systems Industry Revenue Million Forecast, by Geography 2019 & 2032
- Table 66: Global APAC MRI Systems Industry Revenue Million Forecast, by Country 2019 & 2032
- Table 67: Global APAC MRI Systems Industry Revenue Million Forecast, by Architecture 2019 & 2032
- Table 68: Global APAC MRI Systems Industry Revenue Million Forecast, by Field Strength 2019 & 2032
- Table 69: Global APAC MRI Systems Industry Revenue Million Forecast, by Application 2019 & 2032
- Table 70: Global APAC MRI Systems Industry Revenue Million Forecast, by Geography 2019 & 2032
- Table 71: Global APAC MRI Systems Industry Revenue Million Forecast, by Country 2019 & 2032
- Table 72: Global APAC MRI Systems Industry Revenue Million Forecast, by Architecture 2019 & 2032
- Table 73: Global APAC MRI Systems Industry Revenue Million Forecast, by Field Strength 2019 & 2032
- Table 74: Global APAC MRI Systems Industry Revenue Million Forecast, by Application 2019 & 2032
- Table 75: Global APAC MRI Systems Industry Revenue Million Forecast, by Geography 2019 & 2032
- Table 76: Global APAC MRI Systems Industry Revenue Million Forecast, by Country 2019 & 2032
- Table 77: Global APAC MRI Systems Industry Revenue Million Forecast, by Architecture 2019 & 2032
- Table 78: Global APAC MRI Systems Industry Revenue Million Forecast, by Field Strength 2019 & 2032
- Table 79: Global APAC MRI Systems Industry Revenue Million Forecast, by Application 2019 & 2032
- Table 80: Global APAC MRI Systems Industry Revenue Million Forecast, by Geography 2019 & 2032
- Table 81: Global APAC MRI Systems Industry Revenue Million Forecast, by Country 2019 & 2032
Frequently Asked Questions
1. What is the projected Compound Annual Growth Rate (CAGR) of the APAC MRI Systems Industry?
The projected CAGR is approximately 6.46%.
2. Which companies are prominent players in the APAC MRI Systems Industry?
Key companies in the market include Shenzhen Anke High-tech Co Ltd, Esaote SpA, GE Healthcare, Beijing Wandong Medical Technology Co Ltd, Fujifilm Corporation, Shenzhen Basda Medical Apparatus Co Ltd, Neusoft Medical Systems Co Ltd, Koninklijke Philips NV, Canon Medical Systems Corporation, Siemens Healthineers*List Not Exhaustive.
3. What are the main segments of the APAC MRI Systems Industry?
The market segments include Architecture, Field Strength, Application, Geography.
4. Can you provide details about the market size?
The market size is estimated to be USD 2.15 Million as of 2022.
5. What are some drivers contributing to market growth?
Increasing Burden of Chronic Diseases; Availability of Universal Health Coverage in Several Asian Countries; Introduction of Hybrid MRI Systems & Increasing Adoption in Emerging Asian Markets.
6. What are the notable trends driving market growth?
Neurology Segment is Expected to Hold Major Market Share and is Believed to Continue the Same Over the Forecast period.
7. Are there any restraints impacting market growth?
High Cost of MRI Systems; Declining Helium Availability.
8. Can you provide examples of recent developments in the market?
March 2022: Siemens installed its MRI Scanner at North Eastern Community Hospital in the Benson Radiology department in South Australia.
9. What pricing options are available for accessing the report?
Pricing options include single-user, multi-user, and enterprise licenses priced at USD 4750, USD 5250, and USD 8750 respectively.
10. Is the market size provided in terms of value or volume?
The market size is provided in terms of value, measured in Million.
11. Are there any specific market keywords associated with the report?
Yes, the market keyword associated with the report is "APAC MRI Systems Industry," which aids in identifying and referencing the specific market segment covered.
12. How do I determine which pricing option suits my needs best?
The pricing options vary based on user requirements and access needs. Individual users may opt for single-user licenses, while businesses requiring broader access may choose multi-user or enterprise licenses for cost-effective access to the report.
13. Are there any additional resources or data provided in the APAC MRI Systems Industry report?
While the report offers comprehensive insights, it's advisable to review the specific contents or supplementary materials provided to ascertain if additional resources or data are available.
14. How can I stay updated on further developments or reports in the APAC MRI Systems Industry?
To stay informed about further developments, trends, and reports in the APAC MRI Systems Industry, consider subscribing to industry newsletters, following relevant companies and organizations, or regularly checking reputable industry news sources and publications.
Methodology
Step 1 - Identification of Relevant Samples Size from Population Database


Step 2 - Approaches for Defining Global Market Size (Value, Volume* & Price*)

Note*: In applicable scenarios
Step 3 - Data Sources
Primary Research
- Web Analytics
- Survey Reports
- Research Institute
- Latest Research Reports
- Opinion Leaders
Secondary Research
- Annual Reports
- White Paper
- Latest Press Release
- Industry Association
- Paid Database
- Investor Presentations

Step 4 - Data Triangulation
Involves using different sources of information in order to increase the validity of a study
These sources are likely to be stakeholders in a program - participants, other researchers, program staff, other community members, and so on.
Then we put all data in single framework & apply various statistical tools to find out the dynamic on the market.
During the analysis stage, feedback from the stakeholder groups would be compared to determine areas of agreement as well as areas of divergence
