

Key Insights
The global windscreen glass market is experiencing robust growth, driven by the burgeoning automotive industry and increasing demand for advanced driver-assistance systems (ADAS). The market's expansion is fueled by several factors, including the rising sales of passenger vehicles globally, particularly in developing economies like India and China. Furthermore, the integration of sophisticated safety features, such as windshield-mounted sensors for ADAS, is significantly boosting demand for higher-quality, technologically advanced windscreen glass. This trend towards enhanced safety and autonomous driving capabilities is expected to remain a key growth driver throughout the forecast period. While fluctuating raw material prices and economic downturns could pose challenges, technological advancements such as the development of lighter, stronger, and more fuel-efficient glass materials are likely to mitigate these risks and support sustained market expansion. Major players in the market, including Asahi Glass, NSG, Fuyao Group, and Saint-Gobain, are constantly investing in research and development to offer innovative products and expand their market share through strategic partnerships and acquisitions.
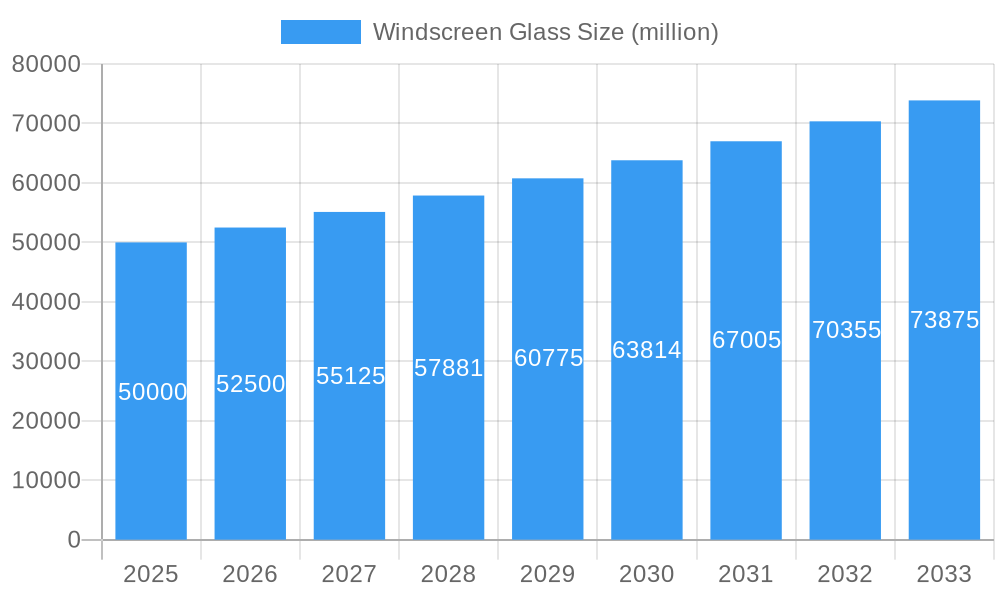
Windscreen Glass Market Size (In Billion)
The competitive landscape is marked by a blend of established multinational corporations and rapidly growing regional players. This intense competition fosters innovation and keeps prices competitive, benefiting consumers. Market segmentation by type (laminated, tempered, etc.), vehicle type (passenger cars, commercial vehicles), and region reveals varying growth rates. For example, the Asia-Pacific region is projected to experience the fastest growth due to the high volume of automotive production and increasing disposable incomes. However, stringent environmental regulations and safety standards across various regions are influencing the adoption of specific glass types, shaping the market's trajectory. Overall, the windscreen glass market is expected to maintain a healthy growth trajectory, driven by technological innovation, increasing vehicle production, and a growing emphasis on vehicle safety. The forecast period (2025-2033) promises continued expansion, with opportunities for market participants to capitalize on evolving consumer preferences and technological advancements.
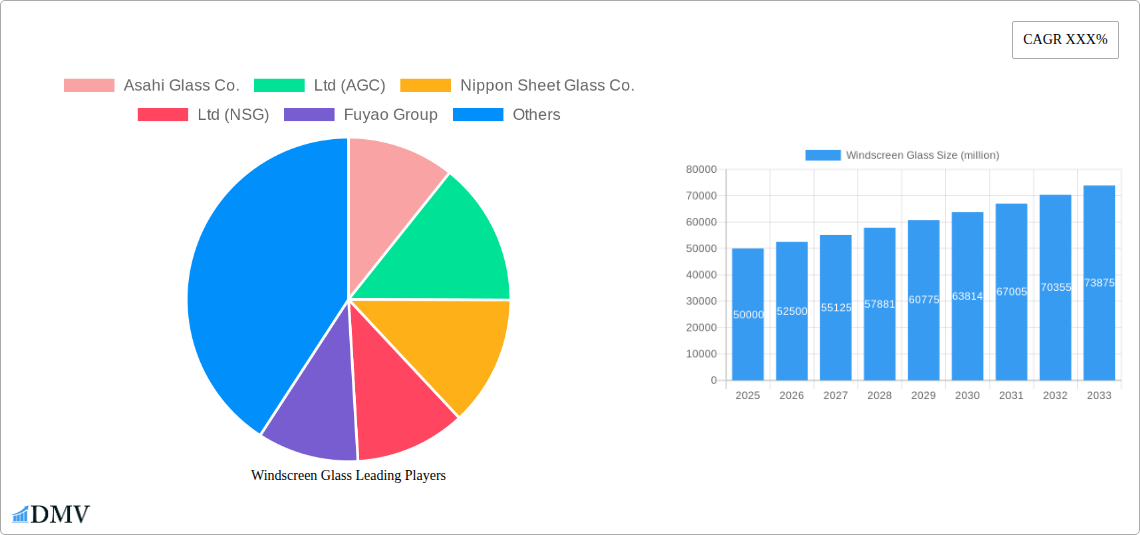
Windscreen Glass Company Market Share
Windscreen Glass Market Report: A Comprehensive Analysis (2019-2033)
This insightful report provides a detailed analysis of the global windscreen glass market, projecting a market value exceeding $XX million by 2033. The study covers the period 2019-2033, with 2025 serving as both the base and estimated year. This comprehensive analysis delves into market composition, industry evolution, leading players, and future growth projections, equipping stakeholders with crucial data for strategic decision-making. The report leverages extensive primary and secondary research to deliver actionable intelligence, focusing on key players like Asahi Glass Co., Ltd (AGC), Nippon Sheet Glass Co., Ltd (NSG), Fuyao Group, Saint-Gobain, Vitro SAB de CV, Central Glass Co., Ltd, and Xinyi Glass.
Windscreen Glass Market Composition & Trends
This section analyzes the competitive landscape of the windscreen glass market, revealing a moderately consolidated structure. The market share distribution amongst the top players—AGC, NSG, Fuyao, Saint-Gobain, and Vitro—accounts for approximately 70% of the global $XX million market in 2025. Innovation in areas like enhanced safety features (e.g., laminated glass with advanced film technologies), lightweighting for improved fuel efficiency, and advanced driver-assistance systems (ADAS) integration are significant drivers. Stringent safety regulations globally, particularly in developed markets, exert a strong influence, fostering demand for high-performance windscreen glass. The presence of substitute materials (e.g., polycarbonate) is limited due to their inferior performance characteristics. The primary end-users are automotive manufacturers, with increasing demand from the commercial vehicle segment. M&A activity within the industry is characterized by strategic acquisitions focused on technology integration and geographical expansion. Deal values in the past five years have averaged approximately $XX million per transaction.
- Market Concentration: Moderately consolidated, with top 5 players holding ~70% market share (2025).
- Innovation Catalysts: Enhanced safety features, lightweighting, ADAS integration.
- Regulatory Landscape: Stringent safety regulations driving demand for high-performance glass.
- Substitute Products: Limited due to inferior performance compared to glass.
- End-User Profiles: Primarily automotive manufacturers (passenger and commercial vehicles).
- M&A Activities: Strategic acquisitions focused on technology and geographical expansion; average deal value $XX million.
Windscreen Glass Industry Evolution
The windscreen glass market demonstrates a steady growth trajectory, driven by the global automotive industry's expansion and the increasing adoption of advanced safety features. The historical period (2019-2024) witnessed a Compound Annual Growth Rate (CAGR) of approximately xx%, while the forecast period (2025-2033) anticipates a CAGR of xx%. Technological advancements, including the integration of sensors and heating elements directly into the glass, have significantly impacted market dynamics. Consumer demand shifts towards enhanced vehicle safety and comfort features, creating a strong impetus for innovation. The rising adoption of electric and autonomous vehicles further fuels the demand for specialized windscreen glass solutions. The increasing preference for larger windshields in SUVs and crossover vehicles also contributes to growth.
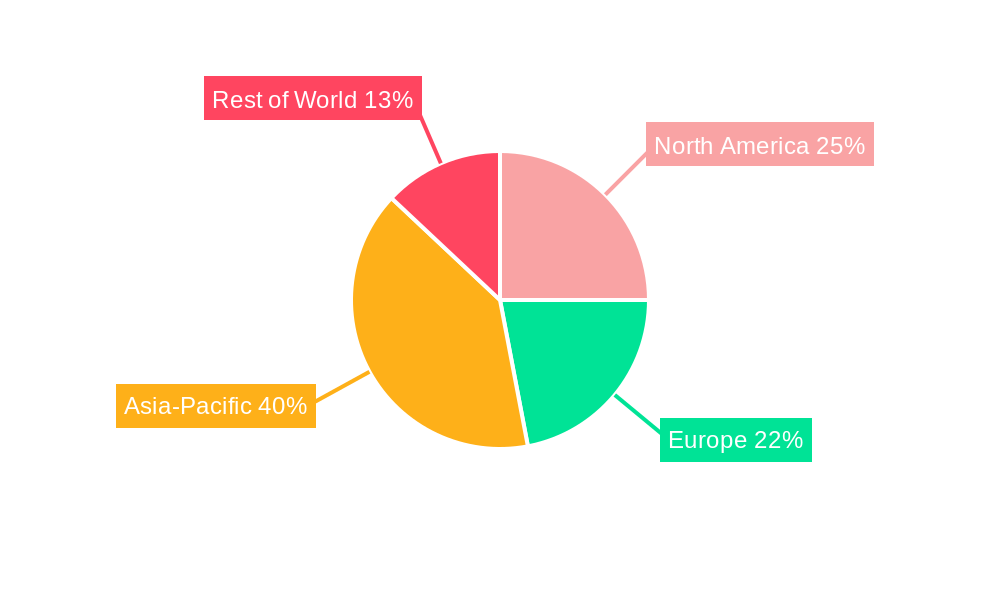
Leading Regions, Countries, or Segments in Windscreen Glass
The Asia-Pacific region commands the largest share of the global windscreen glass market, driven by robust automotive production in countries like China, Japan, India, and South Korea. This dominance is fueled by significant investments in automotive manufacturing facilities, supportive government policies promoting vehicle sales, and a growing middle class with increasing disposable income. Within the Asia-Pacific region, China holds the leading position, attributed to its enormous automotive manufacturing base and its status as the world's largest automotive market.
- Key Drivers for Asia-Pacific Dominance:
- High automotive production volume.
- Significant investments in automotive manufacturing.
- Supportive government policies.
- Growing middle class and increasing disposable income.
Windscreen Glass Product Innovations
Recent innovations in windscreen glass encompass advanced laminates that enhance safety and sound insulation, integrated heating elements for improved de-icing capabilities, and the incorporation of sensors for ADAS functionalities. These innovations provide unique selling propositions like enhanced safety, improved driver visibility, and increased comfort. The development of lighter-weight glass solutions significantly contributes to improved fuel efficiency in vehicles.
Propelling Factors for Windscreen Glass Growth
Several factors contribute to the windscreen glass market's growth. Technological advancements, including enhanced safety features and ADAS integration, drive demand. Economic growth, particularly in emerging markets, fuels automotive production and sales. Stringent safety regulations mandate the use of advanced windscreen glass, thereby increasing adoption rates. The growing preference for larger vehicles, especially SUVs and crossovers, necessitates larger windshields, further stimulating market growth.
Obstacles in the Windscreen Glass Market
Challenges include fluctuating raw material prices (e.g., silica sand), which impact production costs. Supply chain disruptions, as witnessed in recent years, can lead to production delays and increased costs. Intense competition amongst major players creates pricing pressures. Furthermore, environmental regulations concerning glass manufacturing and disposal can pose challenges.
Future Opportunities in Windscreen Glass
The future holds significant opportunities for growth. Expanding markets in developing economies, coupled with the increasing penetration of electric and autonomous vehicles, presents a large untapped potential. The development of innovative materials and functionalities, like self-healing glass and solar-powered heating systems, offers promising prospects. The growing demand for enhanced in-vehicle connectivity and infotainment features integrated into the windscreen further opens new market avenues.
Major Players in the Windscreen Glass Ecosystem
- Asahi Glass Co.,Ltd (AGC)
- Nippon Sheet Glass Co.,Ltd (NSG)
- Fuyao Group
- Saint-Gobain
- Vitro SAB de CV
- Central Glass Co.,Ltd
- Xinyi Glass
Key Developments in Windscreen Glass Industry
- 2022 Q3: AGC launched a new laminated glass with improved acoustic properties.
- 2023 Q1: NSG announced a strategic partnership to develop advanced sensor integration technologies.
- 2024 Q2: Fuyao invested $XX million in a new manufacturing facility in Southeast Asia.
Strategic Windscreen Glass Market Forecast
The windscreen glass market is poised for robust growth, driven by the automotive industry’s expansion, technological advancements, and stringent safety regulations. Future opportunities lie in emerging markets, the development of innovative glass solutions for electric and autonomous vehicles, and the integration of advanced functionalities. The market’s value is expected to surpass $XX million by 2033, reflecting significant market potential for key players.
Windscreen Glass Segmentation
-
1. Application
- 1.1. OEM
- 1.2. Aftermarket
-
2. Type
- 2.1. Front Windscreen Glass
- 2.2. Rear Windscreen Glass
- 2.3. Side Windscreen Glass
Windscreen Glass Segmentation By Geography
-
1. North America
- 1.1. United States
- 1.2. Canada
- 1.3. Mexico
-
2. South America
- 2.1. Brazil
- 2.2. Argentina
- 2.3. Rest of South America
-
3. Europe
- 3.1. United Kingdom
- 3.2. Germany
- 3.3. France
- 3.4. Italy
- 3.5. Spain
- 3.6. Russia
- 3.7. Benelux
- 3.8. Nordics
- 3.9. Rest of Europe
-
4. Middle East & Africa
- 4.1. Turkey
- 4.2. Israel
- 4.3. GCC
- 4.4. North Africa
- 4.5. South Africa
- 4.6. Rest of Middle East & Africa
-
5. Asia Pacific
- 5.1. China
- 5.2. India
- 5.3. Japan
- 5.4. South Korea
- 5.5. ASEAN
- 5.6. Oceania
- 5.7. Rest of Asia Pacific
Windscreen Glass Regional Market Share
Geographic Coverage of Windscreen Glass
Windscreen Glass REPORT HIGHLIGHTS
| Aspects | Details |
|---|---|
| Study Period | 2020-2034 |
| Base Year | 2025 |
| Estimated Year | 2026 |
| Forecast Period | 2026-2034 |
| Historical Period | 2020-2025 |
| Growth Rate | CAGR of 9.5% from 2020-2034 |
| Segmentation |
|
Table of Contents
- 1. Introduction
- 1.1. Research Scope
- 1.2. Market Segmentation
- 1.3. Research Methodology
- 1.4. Definitions and Assumptions
- 2. Executive Summary
- 2.1. Introduction
- 3. Market Dynamics
- 3.1. Introduction
- 3.2. Market Drivers
- 3.3. Market Restrains
- 3.4. Market Trends
- 4. Market Factor Analysis
- 4.1. Porters Five Forces
- 4.2. Supply/Value Chain
- 4.3. PESTEL analysis
- 4.4. Market Entropy
- 4.5. Patent/Trademark Analysis
- 5. Global Windscreen Glass Analysis, Insights and Forecast, 2020-2032
- 5.1. Market Analysis, Insights and Forecast - by Application
- 5.1.1. OEM
- 5.1.2. Aftermarket
- 5.2. Market Analysis, Insights and Forecast - by Type
- 5.2.1. Front Windscreen Glass
- 5.2.2. Rear Windscreen Glass
- 5.2.3. Side Windscreen Glass
- 5.3. Market Analysis, Insights and Forecast - by Region
- 5.3.1. North America
- 5.3.2. South America
- 5.3.3. Europe
- 5.3.4. Middle East & Africa
- 5.3.5. Asia Pacific
- 5.1. Market Analysis, Insights and Forecast - by Application
- 6. North America Windscreen Glass Analysis, Insights and Forecast, 2020-2032
- 6.1. Market Analysis, Insights and Forecast - by Application
- 6.1.1. OEM
- 6.1.2. Aftermarket
- 6.2. Market Analysis, Insights and Forecast - by Type
- 6.2.1. Front Windscreen Glass
- 6.2.2. Rear Windscreen Glass
- 6.2.3. Side Windscreen Glass
- 6.1. Market Analysis, Insights and Forecast - by Application
- 7. South America Windscreen Glass Analysis, Insights and Forecast, 2020-2032
- 7.1. Market Analysis, Insights and Forecast - by Application
- 7.1.1. OEM
- 7.1.2. Aftermarket
- 7.2. Market Analysis, Insights and Forecast - by Type
- 7.2.1. Front Windscreen Glass
- 7.2.2. Rear Windscreen Glass
- 7.2.3. Side Windscreen Glass
- 7.1. Market Analysis, Insights and Forecast - by Application
- 8. Europe Windscreen Glass Analysis, Insights and Forecast, 2020-2032
- 8.1. Market Analysis, Insights and Forecast - by Application
- 8.1.1. OEM
- 8.1.2. Aftermarket
- 8.2. Market Analysis, Insights and Forecast - by Type
- 8.2.1. Front Windscreen Glass
- 8.2.2. Rear Windscreen Glass
- 8.2.3. Side Windscreen Glass
- 8.1. Market Analysis, Insights and Forecast - by Application
- 9. Middle East & Africa Windscreen Glass Analysis, Insights and Forecast, 2020-2032
- 9.1. Market Analysis, Insights and Forecast - by Application
- 9.1.1. OEM
- 9.1.2. Aftermarket
- 9.2. Market Analysis, Insights and Forecast - by Type
- 9.2.1. Front Windscreen Glass
- 9.2.2. Rear Windscreen Glass
- 9.2.3. Side Windscreen Glass
- 9.1. Market Analysis, Insights and Forecast - by Application
- 10. Asia Pacific Windscreen Glass Analysis, Insights and Forecast, 2020-2032
- 10.1. Market Analysis, Insights and Forecast - by Application
- 10.1.1. OEM
- 10.1.2. Aftermarket
- 10.2. Market Analysis, Insights and Forecast - by Type
- 10.2.1. Front Windscreen Glass
- 10.2.2. Rear Windscreen Glass
- 10.2.3. Side Windscreen Glass
- 10.1. Market Analysis, Insights and Forecast - by Application
- 11. Competitive Analysis
- 11.1. Global Market Share Analysis 2025
- 11.2. Company Profiles
- 11.2.1 Asahi Glass Co.
- 11.2.1.1. Overview
- 11.2.1.2. Products
- 11.2.1.3. SWOT Analysis
- 11.2.1.4. Recent Developments
- 11.2.1.5. Financials (Based on Availability)
- 11.2.2 Ltd (AGC)
- 11.2.2.1. Overview
- 11.2.2.2. Products
- 11.2.2.3. SWOT Analysis
- 11.2.2.4. Recent Developments
- 11.2.2.5. Financials (Based on Availability)
- 11.2.3 Nippon Sheet Glass Co.
- 11.2.3.1. Overview
- 11.2.3.2. Products
- 11.2.3.3. SWOT Analysis
- 11.2.3.4. Recent Developments
- 11.2.3.5. Financials (Based on Availability)
- 11.2.4 Ltd (NSG)
- 11.2.4.1. Overview
- 11.2.4.2. Products
- 11.2.4.3. SWOT Analysis
- 11.2.4.4. Recent Developments
- 11.2.4.5. Financials (Based on Availability)
- 11.2.5 Fuyao Group
- 11.2.5.1. Overview
- 11.2.5.2. Products
- 11.2.5.3. SWOT Analysis
- 11.2.5.4. Recent Developments
- 11.2.5.5. Financials (Based on Availability)
- 11.2.6 Saint-Gobain
- 11.2.6.1. Overview
- 11.2.6.2. Products
- 11.2.6.3. SWOT Analysis
- 11.2.6.4. Recent Developments
- 11.2.6.5. Financials (Based on Availability)
- 11.2.7 Vitro SAB de CV
- 11.2.7.1. Overview
- 11.2.7.2. Products
- 11.2.7.3. SWOT Analysis
- 11.2.7.4. Recent Developments
- 11.2.7.5. Financials (Based on Availability)
- 11.2.8 Central Glass Co.
- 11.2.8.1. Overview
- 11.2.8.2. Products
- 11.2.8.3. SWOT Analysis
- 11.2.8.4. Recent Developments
- 11.2.8.5. Financials (Based on Availability)
- 11.2.9 Ltd
- 11.2.9.1. Overview
- 11.2.9.2. Products
- 11.2.9.3. SWOT Analysis
- 11.2.9.4. Recent Developments
- 11.2.9.5. Financials (Based on Availability)
- 11.2.10 Xinyi Glass
- 11.2.10.1. Overview
- 11.2.10.2. Products
- 11.2.10.3. SWOT Analysis
- 11.2.10.4. Recent Developments
- 11.2.10.5. Financials (Based on Availability)
- 11.2.1 Asahi Glass Co.
List of Figures
- Figure 1: Global Windscreen Glass Revenue Breakdown (undefined, %) by Region 2025 & 2033
- Figure 2: Global Windscreen Glass Volume Breakdown (K, %) by Region 2025 & 2033
- Figure 3: North America Windscreen Glass Revenue (undefined), by Application 2025 & 2033
- Figure 4: North America Windscreen Glass Volume (K), by Application 2025 & 2033
- Figure 5: North America Windscreen Glass Revenue Share (%), by Application 2025 & 2033
- Figure 6: North America Windscreen Glass Volume Share (%), by Application 2025 & 2033
- Figure 7: North America Windscreen Glass Revenue (undefined), by Type 2025 & 2033
- Figure 8: North America Windscreen Glass Volume (K), by Type 2025 & 2033
- Figure 9: North America Windscreen Glass Revenue Share (%), by Type 2025 & 2033
- Figure 10: North America Windscreen Glass Volume Share (%), by Type 2025 & 2033
- Figure 11: North America Windscreen Glass Revenue (undefined), by Country 2025 & 2033
- Figure 12: North America Windscreen Glass Volume (K), by Country 2025 & 2033
- Figure 13: North America Windscreen Glass Revenue Share (%), by Country 2025 & 2033
- Figure 14: North America Windscreen Glass Volume Share (%), by Country 2025 & 2033
- Figure 15: South America Windscreen Glass Revenue (undefined), by Application 2025 & 2033
- Figure 16: South America Windscreen Glass Volume (K), by Application 2025 & 2033
- Figure 17: South America Windscreen Glass Revenue Share (%), by Application 2025 & 2033
- Figure 18: South America Windscreen Glass Volume Share (%), by Application 2025 & 2033
- Figure 19: South America Windscreen Glass Revenue (undefined), by Type 2025 & 2033
- Figure 20: South America Windscreen Glass Volume (K), by Type 2025 & 2033
- Figure 21: South America Windscreen Glass Revenue Share (%), by Type 2025 & 2033
- Figure 22: South America Windscreen Glass Volume Share (%), by Type 2025 & 2033
- Figure 23: South America Windscreen Glass Revenue (undefined), by Country 2025 & 2033
- Figure 24: South America Windscreen Glass Volume (K), by Country 2025 & 2033
- Figure 25: South America Windscreen Glass Revenue Share (%), by Country 2025 & 2033
- Figure 26: South America Windscreen Glass Volume Share (%), by Country 2025 & 2033
- Figure 27: Europe Windscreen Glass Revenue (undefined), by Application 2025 & 2033
- Figure 28: Europe Windscreen Glass Volume (K), by Application 2025 & 2033
- Figure 29: Europe Windscreen Glass Revenue Share (%), by Application 2025 & 2033
- Figure 30: Europe Windscreen Glass Volume Share (%), by Application 2025 & 2033
- Figure 31: Europe Windscreen Glass Revenue (undefined), by Type 2025 & 2033
- Figure 32: Europe Windscreen Glass Volume (K), by Type 2025 & 2033
- Figure 33: Europe Windscreen Glass Revenue Share (%), by Type 2025 & 2033
- Figure 34: Europe Windscreen Glass Volume Share (%), by Type 2025 & 2033
- Figure 35: Europe Windscreen Glass Revenue (undefined), by Country 2025 & 2033
- Figure 36: Europe Windscreen Glass Volume (K), by Country 2025 & 2033
- Figure 37: Europe Windscreen Glass Revenue Share (%), by Country 2025 & 2033
- Figure 38: Europe Windscreen Glass Volume Share (%), by Country 2025 & 2033
- Figure 39: Middle East & Africa Windscreen Glass Revenue (undefined), by Application 2025 & 2033
- Figure 40: Middle East & Africa Windscreen Glass Volume (K), by Application 2025 & 2033
- Figure 41: Middle East & Africa Windscreen Glass Revenue Share (%), by Application 2025 & 2033
- Figure 42: Middle East & Africa Windscreen Glass Volume Share (%), by Application 2025 & 2033
- Figure 43: Middle East & Africa Windscreen Glass Revenue (undefined), by Type 2025 & 2033
- Figure 44: Middle East & Africa Windscreen Glass Volume (K), by Type 2025 & 2033
- Figure 45: Middle East & Africa Windscreen Glass Revenue Share (%), by Type 2025 & 2033
- Figure 46: Middle East & Africa Windscreen Glass Volume Share (%), by Type 2025 & 2033
- Figure 47: Middle East & Africa Windscreen Glass Revenue (undefined), by Country 2025 & 2033
- Figure 48: Middle East & Africa Windscreen Glass Volume (K), by Country 2025 & 2033
- Figure 49: Middle East & Africa Windscreen Glass Revenue Share (%), by Country 2025 & 2033
- Figure 50: Middle East & Africa Windscreen Glass Volume Share (%), by Country 2025 & 2033
- Figure 51: Asia Pacific Windscreen Glass Revenue (undefined), by Application 2025 & 2033
- Figure 52: Asia Pacific Windscreen Glass Volume (K), by Application 2025 & 2033
- Figure 53: Asia Pacific Windscreen Glass Revenue Share (%), by Application 2025 & 2033
- Figure 54: Asia Pacific Windscreen Glass Volume Share (%), by Application 2025 & 2033
- Figure 55: Asia Pacific Windscreen Glass Revenue (undefined), by Type 2025 & 2033
- Figure 56: Asia Pacific Windscreen Glass Volume (K), by Type 2025 & 2033
- Figure 57: Asia Pacific Windscreen Glass Revenue Share (%), by Type 2025 & 2033
- Figure 58: Asia Pacific Windscreen Glass Volume Share (%), by Type 2025 & 2033
- Figure 59: Asia Pacific Windscreen Glass Revenue (undefined), by Country 2025 & 2033
- Figure 60: Asia Pacific Windscreen Glass Volume (K), by Country 2025 & 2033
- Figure 61: Asia Pacific Windscreen Glass Revenue Share (%), by Country 2025 & 2033
- Figure 62: Asia Pacific Windscreen Glass Volume Share (%), by Country 2025 & 2033
List of Tables
- Table 1: Global Windscreen Glass Revenue undefined Forecast, by Application 2020 & 2033
- Table 2: Global Windscreen Glass Volume K Forecast, by Application 2020 & 2033
- Table 3: Global Windscreen Glass Revenue undefined Forecast, by Type 2020 & 2033
- Table 4: Global Windscreen Glass Volume K Forecast, by Type 2020 & 2033
- Table 5: Global Windscreen Glass Revenue undefined Forecast, by Region 2020 & 2033
- Table 6: Global Windscreen Glass Volume K Forecast, by Region 2020 & 2033
- Table 7: Global Windscreen Glass Revenue undefined Forecast, by Application 2020 & 2033
- Table 8: Global Windscreen Glass Volume K Forecast, by Application 2020 & 2033
- Table 9: Global Windscreen Glass Revenue undefined Forecast, by Type 2020 & 2033
- Table 10: Global Windscreen Glass Volume K Forecast, by Type 2020 & 2033
- Table 11: Global Windscreen Glass Revenue undefined Forecast, by Country 2020 & 2033
- Table 12: Global Windscreen Glass Volume K Forecast, by Country 2020 & 2033
- Table 13: United States Windscreen Glass Revenue (undefined) Forecast, by Application 2020 & 2033
- Table 14: United States Windscreen Glass Volume (K) Forecast, by Application 2020 & 2033
- Table 15: Canada Windscreen Glass Revenue (undefined) Forecast, by Application 2020 & 2033
- Table 16: Canada Windscreen Glass Volume (K) Forecast, by Application 2020 & 2033
- Table 17: Mexico Windscreen Glass Revenue (undefined) Forecast, by Application 2020 & 2033
- Table 18: Mexico Windscreen Glass Volume (K) Forecast, by Application 2020 & 2033
- Table 19: Global Windscreen Glass Revenue undefined Forecast, by Application 2020 & 2033
- Table 20: Global Windscreen Glass Volume K Forecast, by Application 2020 & 2033
- Table 21: Global Windscreen Glass Revenue undefined Forecast, by Type 2020 & 2033
- Table 22: Global Windscreen Glass Volume K Forecast, by Type 2020 & 2033
- Table 23: Global Windscreen Glass Revenue undefined Forecast, by Country 2020 & 2033
- Table 24: Global Windscreen Glass Volume K Forecast, by Country 2020 & 2033
- Table 25: Brazil Windscreen Glass Revenue (undefined) Forecast, by Application 2020 & 2033
- Table 26: Brazil Windscreen Glass Volume (K) Forecast, by Application 2020 & 2033
- Table 27: Argentina Windscreen Glass Revenue (undefined) Forecast, by Application 2020 & 2033
- Table 28: Argentina Windscreen Glass Volume (K) Forecast, by Application 2020 & 2033
- Table 29: Rest of South America Windscreen Glass Revenue (undefined) Forecast, by Application 2020 & 2033
- Table 30: Rest of South America Windscreen Glass Volume (K) Forecast, by Application 2020 & 2033
- Table 31: Global Windscreen Glass Revenue undefined Forecast, by Application 2020 & 2033
- Table 32: Global Windscreen Glass Volume K Forecast, by Application 2020 & 2033
- Table 33: Global Windscreen Glass Revenue undefined Forecast, by Type 2020 & 2033
- Table 34: Global Windscreen Glass Volume K Forecast, by Type 2020 & 2033
- Table 35: Global Windscreen Glass Revenue undefined Forecast, by Country 2020 & 2033
- Table 36: Global Windscreen Glass Volume K Forecast, by Country 2020 & 2033
- Table 37: United Kingdom Windscreen Glass Revenue (undefined) Forecast, by Application 2020 & 2033
- Table 38: United Kingdom Windscreen Glass Volume (K) Forecast, by Application 2020 & 2033
- Table 39: Germany Windscreen Glass Revenue (undefined) Forecast, by Application 2020 & 2033
- Table 40: Germany Windscreen Glass Volume (K) Forecast, by Application 2020 & 2033
- Table 41: France Windscreen Glass Revenue (undefined) Forecast, by Application 2020 & 2033
- Table 42: France Windscreen Glass Volume (K) Forecast, by Application 2020 & 2033
- Table 43: Italy Windscreen Glass Revenue (undefined) Forecast, by Application 2020 & 2033
- Table 44: Italy Windscreen Glass Volume (K) Forecast, by Application 2020 & 2033
- Table 45: Spain Windscreen Glass Revenue (undefined) Forecast, by Application 2020 & 2033
- Table 46: Spain Windscreen Glass Volume (K) Forecast, by Application 2020 & 2033
- Table 47: Russia Windscreen Glass Revenue (undefined) Forecast, by Application 2020 & 2033
- Table 48: Russia Windscreen Glass Volume (K) Forecast, by Application 2020 & 2033
- Table 49: Benelux Windscreen Glass Revenue (undefined) Forecast, by Application 2020 & 2033
- Table 50: Benelux Windscreen Glass Volume (K) Forecast, by Application 2020 & 2033
- Table 51: Nordics Windscreen Glass Revenue (undefined) Forecast, by Application 2020 & 2033
- Table 52: Nordics Windscreen Glass Volume (K) Forecast, by Application 2020 & 2033
- Table 53: Rest of Europe Windscreen Glass Revenue (undefined) Forecast, by Application 2020 & 2033
- Table 54: Rest of Europe Windscreen Glass Volume (K) Forecast, by Application 2020 & 2033
- Table 55: Global Windscreen Glass Revenue undefined Forecast, by Application 2020 & 2033
- Table 56: Global Windscreen Glass Volume K Forecast, by Application 2020 & 2033
- Table 57: Global Windscreen Glass Revenue undefined Forecast, by Type 2020 & 2033
- Table 58: Global Windscreen Glass Volume K Forecast, by Type 2020 & 2033
- Table 59: Global Windscreen Glass Revenue undefined Forecast, by Country 2020 & 2033
- Table 60: Global Windscreen Glass Volume K Forecast, by Country 2020 & 2033
- Table 61: Turkey Windscreen Glass Revenue (undefined) Forecast, by Application 2020 & 2033
- Table 62: Turkey Windscreen Glass Volume (K) Forecast, by Application 2020 & 2033
- Table 63: Israel Windscreen Glass Revenue (undefined) Forecast, by Application 2020 & 2033
- Table 64: Israel Windscreen Glass Volume (K) Forecast, by Application 2020 & 2033
- Table 65: GCC Windscreen Glass Revenue (undefined) Forecast, by Application 2020 & 2033
- Table 66: GCC Windscreen Glass Volume (K) Forecast, by Application 2020 & 2033
- Table 67: North Africa Windscreen Glass Revenue (undefined) Forecast, by Application 2020 & 2033
- Table 68: North Africa Windscreen Glass Volume (K) Forecast, by Application 2020 & 2033
- Table 69: South Africa Windscreen Glass Revenue (undefined) Forecast, by Application 2020 & 2033
- Table 70: South Africa Windscreen Glass Volume (K) Forecast, by Application 2020 & 2033
- Table 71: Rest of Middle East & Africa Windscreen Glass Revenue (undefined) Forecast, by Application 2020 & 2033
- Table 72: Rest of Middle East & Africa Windscreen Glass Volume (K) Forecast, by Application 2020 & 2033
- Table 73: Global Windscreen Glass Revenue undefined Forecast, by Application 2020 & 2033
- Table 74: Global Windscreen Glass Volume K Forecast, by Application 2020 & 2033
- Table 75: Global Windscreen Glass Revenue undefined Forecast, by Type 2020 & 2033
- Table 76: Global Windscreen Glass Volume K Forecast, by Type 2020 & 2033
- Table 77: Global Windscreen Glass Revenue undefined Forecast, by Country 2020 & 2033
- Table 78: Global Windscreen Glass Volume K Forecast, by Country 2020 & 2033
- Table 79: China Windscreen Glass Revenue (undefined) Forecast, by Application 2020 & 2033
- Table 80: China Windscreen Glass Volume (K) Forecast, by Application 2020 & 2033
- Table 81: India Windscreen Glass Revenue (undefined) Forecast, by Application 2020 & 2033
- Table 82: India Windscreen Glass Volume (K) Forecast, by Application 2020 & 2033
- Table 83: Japan Windscreen Glass Revenue (undefined) Forecast, by Application 2020 & 2033
- Table 84: Japan Windscreen Glass Volume (K) Forecast, by Application 2020 & 2033
- Table 85: South Korea Windscreen Glass Revenue (undefined) Forecast, by Application 2020 & 2033
- Table 86: South Korea Windscreen Glass Volume (K) Forecast, by Application 2020 & 2033
- Table 87: ASEAN Windscreen Glass Revenue (undefined) Forecast, by Application 2020 & 2033
- Table 88: ASEAN Windscreen Glass Volume (K) Forecast, by Application 2020 & 2033
- Table 89: Oceania Windscreen Glass Revenue (undefined) Forecast, by Application 2020 & 2033
- Table 90: Oceania Windscreen Glass Volume (K) Forecast, by Application 2020 & 2033
- Table 91: Rest of Asia Pacific Windscreen Glass Revenue (undefined) Forecast, by Application 2020 & 2033
- Table 92: Rest of Asia Pacific Windscreen Glass Volume (K) Forecast, by Application 2020 & 2033
Frequently Asked Questions
1. What is the projected Compound Annual Growth Rate (CAGR) of the Windscreen Glass?
The projected CAGR is approximately 9.5%.
2. Which companies are prominent players in the Windscreen Glass?
Key companies in the market include Asahi Glass Co., Ltd (AGC), Nippon Sheet Glass Co., Ltd (NSG), Fuyao Group, Saint-Gobain, Vitro SAB de CV, Central Glass Co., Ltd, Xinyi Glass.
3. What are the main segments of the Windscreen Glass?
The market segments include Application, Type.
4. Can you provide details about the market size?
The market size is estimated to be USD XXX N/A as of 2022.
5. What are some drivers contributing to market growth?
N/A
6. What are the notable trends driving market growth?
N/A
7. Are there any restraints impacting market growth?
N/A
8. Can you provide examples of recent developments in the market?
N/A
9. What pricing options are available for accessing the report?
Pricing options include single-user, multi-user, and enterprise licenses priced at USD 3950.00, USD 5925.00, and USD 7900.00 respectively.
10. Is the market size provided in terms of value or volume?
The market size is provided in terms of value, measured in N/A and volume, measured in K.
11. Are there any specific market keywords associated with the report?
Yes, the market keyword associated with the report is "Windscreen Glass," which aids in identifying and referencing the specific market segment covered.
12. How do I determine which pricing option suits my needs best?
The pricing options vary based on user requirements and access needs. Individual users may opt for single-user licenses, while businesses requiring broader access may choose multi-user or enterprise licenses for cost-effective access to the report.
13. Are there any additional resources or data provided in the Windscreen Glass report?
While the report offers comprehensive insights, it's advisable to review the specific contents or supplementary materials provided to ascertain if additional resources or data are available.
14. How can I stay updated on further developments or reports in the Windscreen Glass?
To stay informed about further developments, trends, and reports in the Windscreen Glass, consider subscribing to industry newsletters, following relevant companies and organizations, or regularly checking reputable industry news sources and publications.
Methodology
Step 1 - Identification of Relevant Samples Size from Population Database


Step 2 - Approaches for Defining Global Market Size (Value, Volume* & Price*)

Note*: In applicable scenarios
Step 3 - Data Sources
Primary Research
- Web Analytics
- Survey Reports
- Research Institute
- Latest Research Reports
- Opinion Leaders
Secondary Research
- Annual Reports
- White Paper
- Latest Press Release
- Industry Association
- Paid Database
- Investor Presentations

Step 4 - Data Triangulation
Involves using different sources of information in order to increase the validity of a study
These sources are likely to be stakeholders in a program - participants, other researchers, program staff, other community members, and so on.
Then we put all data in single framework & apply various statistical tools to find out the dynamic on the market.
During the analysis stage, feedback from the stakeholder groups would be compared to determine areas of agreement as well as areas of divergence