

Key Insights
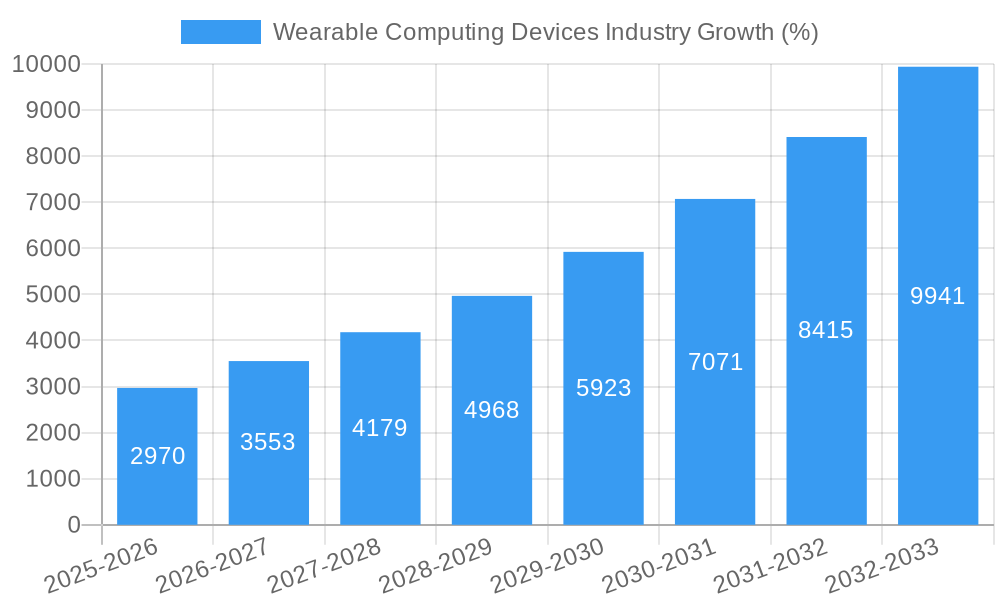
The Wearable Computing Devices market is experiencing robust growth, projected to reach a substantial size by 2033. A compound annual growth rate (CAGR) of 19.90% from 2025 to 2033 signifies significant market expansion driven by several key factors. The increasing demand for health and fitness tracking devices, coupled with technological advancements leading to smaller, more stylish, and feature-rich wearables, are major contributors. The integration of advanced sensors and AI capabilities allows for more accurate data collection and personalized health insights, further fueling market growth. Smartwatches, fitness trackers, and hearables continue to dominate the product landscape, while emerging technologies like smart clothing and exoskeletons are poised for significant future growth. The Fitness and Wellness end-user segment leads market share, driven by the rising health-conscious population globally. However, challenges remain; concerns regarding data privacy and security, high initial costs of certain devices (particularly exoskeletons), and the need for improved battery life present potential restraints to broader market penetration. Furthermore, regulatory hurdles and standardization issues related to medical-grade wearables need to be addressed to enable seamless market expansion.
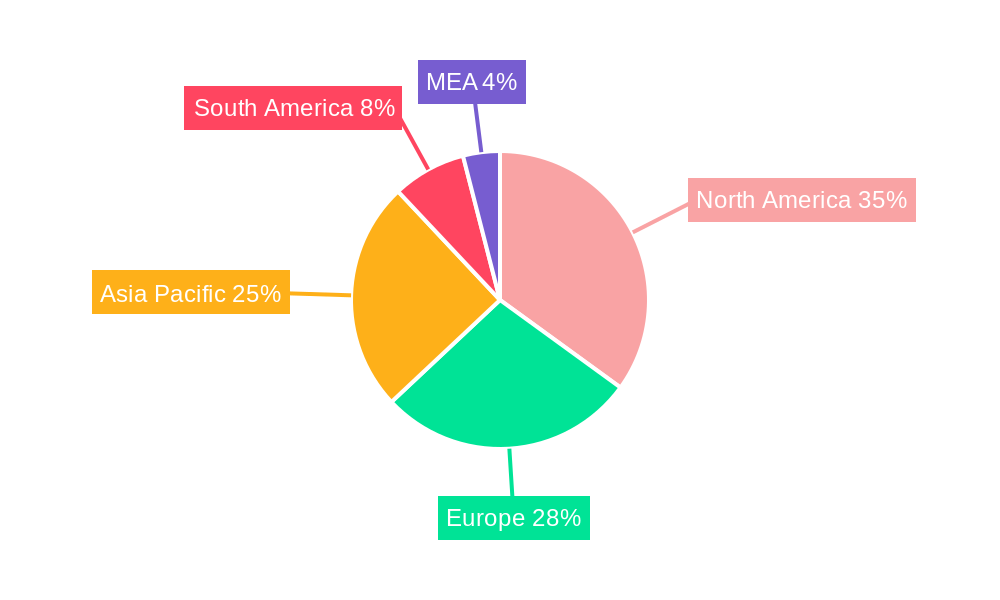
Geographical distribution reveals a diverse market landscape. North America and Europe currently hold significant market shares, thanks to high consumer disposable incomes and advanced technological infrastructure. However, rapidly developing economies in Asia-Pacific, particularly China and India, are showing immense growth potential, driven by increasing smartphone penetration and a burgeoning middle class with rising health awareness. The market is highly competitive, with major players like Apple, Samsung, Fitbit, and Garmin vying for market dominance. This competitive landscape fosters innovation and continuous improvement, ultimately benefiting consumers with a wide array of choices and technological advancements. The continued focus on user experience, along with strategic partnerships and product diversification, will shape the future of the wearable computing device industry.
Wearable Computing Devices Industry: A Comprehensive Market Report (2019-2033)
This insightful report provides a detailed analysis of the Wearable Computing Devices industry, encompassing market trends, leading players, technological advancements, and future growth prospects. With a focus on the period 2019-2033, this report is essential for stakeholders seeking to understand and capitalize on the dynamic opportunities within this rapidly evolving sector. The report uses 2025 as its base and estimated year, with a forecast period spanning 2025-2033 and a historical period covering 2019-2024. The global market size is projected to reach xx Million by 2033.
Wearable Computing Devices Industry Market Composition & Trends
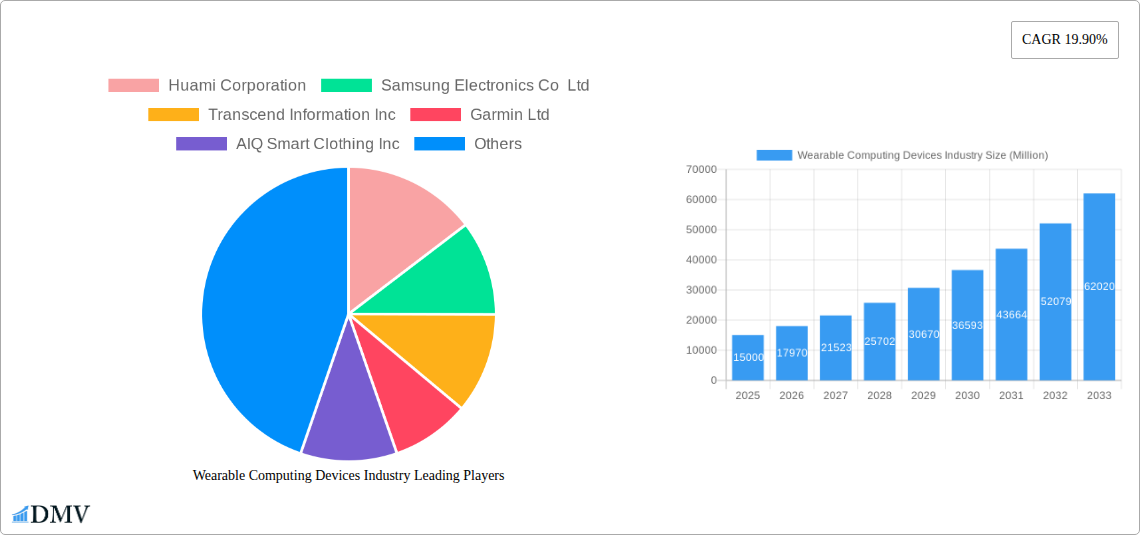
The Wearable Computing Devices market exhibits a moderately concentrated landscape, with key players like Apple Inc., Samsung Electronics Co Ltd, and Fitbit Inc. holding significant market share. However, the market is characterized by continuous innovation, driven by advancements in miniaturization, sensor technology, and artificial intelligence. Regulatory landscapes vary across regions, impacting data privacy and device approvals. Substitute products, such as smartphones with similar functionalities, pose a competitive challenge. End-user segments, including fitness and wellness, medical and healthcare, and industrial sectors, demonstrate diverse needs and adoption rates. M&A activity has been substantial, with deal values totaling xx Million in the past five years, reflecting the industry's consolidation and expansion.
- Market Share Distribution (2024): Apple Inc. (xx%), Samsung Electronics Co Ltd (xx%), Fitbit Inc. (xx%), Others (xx%)
- M&A Deal Value (2019-2024): xx Million
- Key Innovation Catalysts: Improved battery life, advanced sensor integration, AI-powered health analytics, enhanced user interfaces.
- Regulatory Landscape: Varies by region, impacting data privacy, medical device approvals, and safety standards.
Wearable Computing Devices Industry Industry Evolution
The Wearable Computing Devices industry has witnessed phenomenal growth, fueled by escalating consumer demand for fitness tracking, health monitoring, and connected experiences. From 2019 to 2024, the market expanded at a CAGR of xx%, reaching xx Million in 2024. This growth is attributable to several factors, including decreasing device costs, improved functionality, and expanding application areas. Technological advancements, such as the incorporation of advanced sensors, superior processing power, and enhanced connectivity, have significantly improved device capabilities. Consumer demands are evolving, with a growing preference for seamless integration with smartphones, personalized health insights, and stylish designs. This trend is expected to continue, driving market expansion in the forecast period (2025-2033) with a projected CAGR of xx%, reaching an estimated xx Million by 2033.
Leading Regions, Countries, or Segments in Wearable Computing Devices Industry
The North American region currently dominates the Wearable Computing Devices market, driven by high consumer adoption rates, strong technological infrastructure, and significant investments in R&D. Within product types, smartwatches and fitness trackers hold the largest market share, reflecting the popularity of fitness and wellness applications. The medical and healthcare segment exhibits strong growth potential, fueled by the rising demand for remote patient monitoring and personalized healthcare solutions.
- Key Drivers:
- North America: High consumer disposable income, strong technological advancement, early adoption of new technologies.
- Asia-Pacific: Rising smartphone penetration, increasing health consciousness, favorable government policies.
- Smartwatches & Fitness Trackers: Wide consumer appeal, diverse functionalities, affordability.
- Medical & Healthcare: Growing demand for remote patient monitoring, increasing chronic disease prevalence, technological advancements enabling remote diagnostics and treatment.
The dominance of North America is attributable to high consumer spending on electronics, a culture of health and wellness, and the early adoption of innovative technologies. However, the Asia-Pacific region is experiencing rapid growth, driven by increasing smartphone penetration, rising health consciousness among consumers, and supportive government initiatives.
Wearable Computing Devices Industry Product Innovations
Recent innovations include advanced health sensors that provide detailed physiological data, improved battery life extending usage time, and seamless integration with smartphone apps and cloud platforms that offer personalized insights and data analysis. Unique selling propositions include features like ECG monitoring, sleep stage tracking, and stress level detection. Miniaturization and improved comfort are also significant advancements.
Propelling Factors for Wearable Computing Devices Industry Growth
Technological advancements, such as the development of more efficient and smaller sensors and processors, are a major driver of growth. Economic factors, including the increasing affordability of wearable devices and rising disposable incomes, are fueling adoption. Regulatory support in various regions, fostering innovation and encouraging the use of wearable tech in healthcare, is also significant.
Obstacles in the Wearable Computing Devices Industry Market
Data privacy concerns and stringent regulations in certain regions present challenges. Supply chain disruptions, particularly related to component sourcing, can impact production and device availability. Intense competition from established players and emerging startups creates pricing pressure.
Future Opportunities in Wearable Computing Devices Industry
Expansion into new markets, particularly developing economies, offers substantial growth potential. The development of advanced materials and sensors will improve device capabilities, while growing interest in personalized wellness and preventive healthcare will drive demand.
Major Players in the Wearable Computing Devices Industry Ecosystem
- Huami Corporation
- Samsung Electronics Co Ltd
- Transcend Information Inc
- Garmin Ltd
- AIQ Smart Clothing Inc
- GoPro Inc
- Microsoft Corporation
- Medtronic PLC
- Cyberdyne Inc
- Fitbit Inc
- Ekso Bionics Holdings Inc
- Withings
- Huawei Technologies Co Ltd
- Sensoria Inc
- Omron Healthcare Inc
- Fossil Group Inc
- Apple Inc
- Sony Corporation
- Nuheara Limited
Key Developments in Wearable Computing Devices Industry Industry
- October 2022: Microsoft deployed the IVAS (Integrated Visual Augmentation System) to the US Army, showcasing advanced features in military applications.
- October 2022: Emirates Global Aluminium (EGA) implemented Kenzen's wearable technology to monitor worker health and prevent heat stress, highlighting the industrial applications of wearables.
- December 2022: Comfiknit launched a specialized T-shirt for atopic dermatitis patients, demonstrating the expanding applications of smart clothing in healthcare.
- December 2022: Acemoney introduced a smart ring for NFC-based digital payments, illustrating the potential of wearables in financial technology.
Strategic Wearable Computing Devices Industry Market Forecast
The Wearable Computing Devices market is poised for sustained growth, driven by technological innovations, expanding applications, and increasing consumer awareness of health and wellness. New product categories, such as advanced medical wearables and augmented reality headsets, are expected to fuel market expansion. The integration of artificial intelligence and machine learning capabilities will further enhance device functionality and personalize user experiences, creating significant growth opportunities in the coming years. The market's robust trajectory suggests substantial market potential, with continued expansion across various segments and geographies.
Wearable Computing Devices Industry Segmentation
-
1. Product Type
- 1.1. Smartwatches
- 1.2. Head Mounted Displays
- 1.3. Smart Clothing
- 1.4. Ear Worn
- 1.5. Fitness Trackers
- 1.6. Body Worn Camera
- 1.7. Exoskeleton
- 1.8. Other We
-
2. End User
- 2.1. Fitness and Wellness
- 2.2. Medical and Healthcare
- 2.3. Infotainment
- 2.4. Industrial and Defense
- 2.5. Other End Users
Wearable Computing Devices Industry Segmentation By Geography
- 1. North America: United States Canada Mexico
- 2. Europe: Germany: France: Italy: United Kingdom Netherlands Rest of Europe
- 3. Asia Pacific: China, Japan, India, South Korea, Taiwan, Australia, Rest of Asia-Pacific
- 4. South America : Brazil, Argentina, Rest of South America
- 5. MEA: Middle East, Africa
Wearable Computing Devices Industry REPORT HIGHLIGHTS
| Aspects | Details |
|---|---|
| Study Period | 2019-2033 |
| Base Year | 2024 |
| Estimated Year | 2025 |
| Forecast Period | 2025-2033 |
| Historical Period | 2019-2024 |
| Growth Rate | CAGR of 19.90% from 2019-2033 |
| Segmentation |
|
Table of Contents
- 1. Introduction
- 1.1. Research Scope
- 1.2. Market Segmentation
- 1.3. Research Methodology
- 1.4. Definitions and Assumptions
- 2. Executive Summary
- 2.1. Introduction
- 3. Market Dynamics
- 3.1. Introduction
- 3.2. Market Drivers
- 3.2.1. Increasing Technological Advancements in the Wearables Market; Increase in Health Awareness Among Consumers
- 3.3. Market Restrains
- 3.3.1 Growing Complexity of Wearable Devices and Limited Use of Features
- 3.3.2 Augmented by Security Risks
- 3.4. Market Trends
- 3.4.1. Smart Clothing Expected to Witness Significant Growth
- 4. Market Factor Analysis
- 4.1. Porters Five Forces
- 4.2. Supply/Value Chain
- 4.3. PESTEL analysis
- 4.4. Market Entropy
- 4.5. Patent/Trademark Analysis
- 5. Global Wearable Computing Devices Industry Analysis, Insights and Forecast, 2019-2031
- 5.1. Market Analysis, Insights and Forecast - by Product Type
- 5.1.1. Smartwatches
- 5.1.2. Head Mounted Displays
- 5.1.3. Smart Clothing
- 5.1.4. Ear Worn
- 5.1.5. Fitness Trackers
- 5.1.6. Body Worn Camera
- 5.1.7. Exoskeleton
- 5.1.8. Other We
- 5.2. Market Analysis, Insights and Forecast - by End User
- 5.2.1. Fitness and Wellness
- 5.2.2. Medical and Healthcare
- 5.2.3. Infotainment
- 5.2.4. Industrial and Defense
- 5.2.5. Other End Users
- 5.3. Market Analysis, Insights and Forecast - by Region
- 5.3.1. North America: United States Canada Mexico
- 5.3.2. Europe: Germany: France: Italy: United Kingdom Netherlands Rest of Europe
- 5.3.3. Asia Pacific: China, Japan, India, South Korea, Taiwan, Australia, Rest of Asia-Pacific
- 5.3.4. South America : Brazil, Argentina, Rest of South America
- 5.3.5. MEA: Middle East, Africa
- 5.1. Market Analysis, Insights and Forecast - by Product Type
- 6. North America: United States Canada Mexico Wearable Computing Devices Industry Analysis, Insights and Forecast, 2019-2031
- 6.1. Market Analysis, Insights and Forecast - by Product Type
- 6.1.1. Smartwatches
- 6.1.2. Head Mounted Displays
- 6.1.3. Smart Clothing
- 6.1.4. Ear Worn
- 6.1.5. Fitness Trackers
- 6.1.6. Body Worn Camera
- 6.1.7. Exoskeleton
- 6.1.8. Other We
- 6.2. Market Analysis, Insights and Forecast - by End User
- 6.2.1. Fitness and Wellness
- 6.2.2. Medical and Healthcare
- 6.2.3. Infotainment
- 6.2.4. Industrial and Defense
- 6.2.5. Other End Users
- 6.1. Market Analysis, Insights and Forecast - by Product Type
- 7. Europe: Germany: France: Italy: United Kingdom Netherlands Rest of Europe Wearable Computing Devices Industry Analysis, Insights and Forecast, 2019-2031
- 7.1. Market Analysis, Insights and Forecast - by Product Type
- 7.1.1. Smartwatches
- 7.1.2. Head Mounted Displays
- 7.1.3. Smart Clothing
- 7.1.4. Ear Worn
- 7.1.5. Fitness Trackers
- 7.1.6. Body Worn Camera
- 7.1.7. Exoskeleton
- 7.1.8. Other We
- 7.2. Market Analysis, Insights and Forecast - by End User
- 7.2.1. Fitness and Wellness
- 7.2.2. Medical and Healthcare
- 7.2.3. Infotainment
- 7.2.4. Industrial and Defense
- 7.2.5. Other End Users
- 7.1. Market Analysis, Insights and Forecast - by Product Type
- 8. Asia Pacific: China, Japan, India, South Korea, Taiwan, Australia, Rest of Asia-Pacific Wearable Computing Devices Industry Analysis, Insights and Forecast, 2019-2031
- 8.1. Market Analysis, Insights and Forecast - by Product Type
- 8.1.1. Smartwatches
- 8.1.2. Head Mounted Displays
- 8.1.3. Smart Clothing
- 8.1.4. Ear Worn
- 8.1.5. Fitness Trackers
- 8.1.6. Body Worn Camera
- 8.1.7. Exoskeleton
- 8.1.8. Other We
- 8.2. Market Analysis, Insights and Forecast - by End User
- 8.2.1. Fitness and Wellness
- 8.2.2. Medical and Healthcare
- 8.2.3. Infotainment
- 8.2.4. Industrial and Defense
- 8.2.5. Other End Users
- 8.1. Market Analysis, Insights and Forecast - by Product Type
- 9. South America : Brazil, Argentina, Rest of South America Wearable Computing Devices Industry Analysis, Insights and Forecast, 2019-2031
- 9.1. Market Analysis, Insights and Forecast - by Product Type
- 9.1.1. Smartwatches
- 9.1.2. Head Mounted Displays
- 9.1.3. Smart Clothing
- 9.1.4. Ear Worn
- 9.1.5. Fitness Trackers
- 9.1.6. Body Worn Camera
- 9.1.7. Exoskeleton
- 9.1.8. Other We
- 9.2. Market Analysis, Insights and Forecast - by End User
- 9.2.1. Fitness and Wellness
- 9.2.2. Medical and Healthcare
- 9.2.3. Infotainment
- 9.2.4. Industrial and Defense
- 9.2.5. Other End Users
- 9.1. Market Analysis, Insights and Forecast - by Product Type
- 10. MEA: Middle East, Africa Wearable Computing Devices Industry Analysis, Insights and Forecast, 2019-2031
- 10.1. Market Analysis, Insights and Forecast - by Product Type
- 10.1.1. Smartwatches
- 10.1.2. Head Mounted Displays
- 10.1.3. Smart Clothing
- 10.1.4. Ear Worn
- 10.1.5. Fitness Trackers
- 10.1.6. Body Worn Camera
- 10.1.7. Exoskeleton
- 10.1.8. Other We
- 10.2. Market Analysis, Insights and Forecast - by End User
- 10.2.1. Fitness and Wellness
- 10.2.2. Medical and Healthcare
- 10.2.3. Infotainment
- 10.2.4. Industrial and Defense
- 10.2.5. Other End Users
- 10.1. Market Analysis, Insights and Forecast - by Product Type
- 11. North America Wearable Computing Devices Industry Analysis, Insights and Forecast, 2019-2031
- 11.1. Market Analysis, Insights and Forecast - By Country/Sub-region
- 11.1.1 United States
- 11.1.2 Canada
- 11.1.3 Mexico
- 12. Europe Wearable Computing Devices Industry Analysis, Insights and Forecast, 2019-2031
- 12.1. Market Analysis, Insights and Forecast - By Country/Sub-region
- 12.1.1 Germany
- 12.1.2 United Kingdom
- 12.1.3 France
- 12.1.4 Spain
- 12.1.5 Italy
- 12.1.6 Spain
- 12.1.7 Belgium
- 12.1.8 Netherland
- 12.1.9 Nordics
- 12.1.10 Rest of Europe
- 13. Asia Pacific Wearable Computing Devices Industry Analysis, Insights and Forecast, 2019-2031
- 13.1. Market Analysis, Insights and Forecast - By Country/Sub-region
- 13.1.1 China
- 13.1.2 Japan
- 13.1.3 India
- 13.1.4 South Korea
- 13.1.5 Southeast Asia
- 13.1.6 Australia
- 13.1.7 Indonesia
- 13.1.8 Phillipes
- 13.1.9 Singapore
- 13.1.10 Thailandc
- 13.1.11 Rest of Asia Pacific
- 14. South America Wearable Computing Devices Industry Analysis, Insights and Forecast, 2019-2031
- 14.1. Market Analysis, Insights and Forecast - By Country/Sub-region
- 14.1.1 Brazil
- 14.1.2 Argentina
- 14.1.3 Peru
- 14.1.4 Chile
- 14.1.5 Colombia
- 14.1.6 Ecuador
- 14.1.7 Venezuela
- 14.1.8 Rest of South America
- 15. North America Wearable Computing Devices Industry Analysis, Insights and Forecast, 2019-2031
- 15.1. Market Analysis, Insights and Forecast - By Country/Sub-region
- 15.1.1 United States
- 15.1.2 Canada
- 15.1.3 Mexico
- 16. MEA Wearable Computing Devices Industry Analysis, Insights and Forecast, 2019-2031
- 16.1. Market Analysis, Insights and Forecast - By Country/Sub-region
- 16.1.1 United Arab Emirates
- 16.1.2 Saudi Arabia
- 16.1.3 South Africa
- 16.1.4 Rest of Middle East and Africa
- 17. Competitive Analysis
- 17.1. Global Market Share Analysis 2024
- 17.2. Company Profiles
- 17.2.1 Huami Corporation
- 17.2.1.1. Overview
- 17.2.1.2. Products
- 17.2.1.3. SWOT Analysis
- 17.2.1.4. Recent Developments
- 17.2.1.5. Financials (Based on Availability)
- 17.2.2 Samsung Electronics Co Ltd
- 17.2.2.1. Overview
- 17.2.2.2. Products
- 17.2.2.3. SWOT Analysis
- 17.2.2.4. Recent Developments
- 17.2.2.5. Financials (Based on Availability)
- 17.2.3 Transcend Information Inc
- 17.2.3.1. Overview
- 17.2.3.2. Products
- 17.2.3.3. SWOT Analysis
- 17.2.3.4. Recent Developments
- 17.2.3.5. Financials (Based on Availability)
- 17.2.4 Garmin Ltd
- 17.2.4.1. Overview
- 17.2.4.2. Products
- 17.2.4.3. SWOT Analysis
- 17.2.4.4. Recent Developments
- 17.2.4.5. Financials (Based on Availability)
- 17.2.5 AIQ Smart Clothing Inc
- 17.2.5.1. Overview
- 17.2.5.2. Products
- 17.2.5.3. SWOT Analysis
- 17.2.5.4. Recent Developments
- 17.2.5.5. Financials (Based on Availability)
- 17.2.6 GoPro Inc
- 17.2.6.1. Overview
- 17.2.6.2. Products
- 17.2.6.3. SWOT Analysis
- 17.2.6.4. Recent Developments
- 17.2.6.5. Financials (Based on Availability)
- 17.2.7 Microsoft Corporation
- 17.2.7.1. Overview
- 17.2.7.2. Products
- 17.2.7.3. SWOT Analysis
- 17.2.7.4. Recent Developments
- 17.2.7.5. Financials (Based on Availability)
- 17.2.8 Medtronic PLC
- 17.2.8.1. Overview
- 17.2.8.2. Products
- 17.2.8.3. SWOT Analysis
- 17.2.8.4. Recent Developments
- 17.2.8.5. Financials (Based on Availability)
- 17.2.9 Cyberdyne Inc
- 17.2.9.1. Overview
- 17.2.9.2. Products
- 17.2.9.3. SWOT Analysis
- 17.2.9.4. Recent Developments
- 17.2.9.5. Financials (Based on Availability)
- 17.2.10 Fitbit Inc
- 17.2.10.1. Overview
- 17.2.10.2. Products
- 17.2.10.3. SWOT Analysis
- 17.2.10.4. Recent Developments
- 17.2.10.5. Financials (Based on Availability)
- 17.2.11 Ekso Bionics Holdings Inc
- 17.2.11.1. Overview
- 17.2.11.2. Products
- 17.2.11.3. SWOT Analysis
- 17.2.11.4. Recent Developments
- 17.2.11.5. Financials (Based on Availability)
- 17.2.12 Withings
- 17.2.12.1. Overview
- 17.2.12.2. Products
- 17.2.12.3. SWOT Analysis
- 17.2.12.4. Recent Developments
- 17.2.12.5. Financials (Based on Availability)
- 17.2.13 Huawei Technologies Co Ltd
- 17.2.13.1. Overview
- 17.2.13.2. Products
- 17.2.13.3. SWOT Analysis
- 17.2.13.4. Recent Developments
- 17.2.13.5. Financials (Based on Availability)
- 17.2.14 Sensoria Inc
- 17.2.14.1. Overview
- 17.2.14.2. Products
- 17.2.14.3. SWOT Analysis
- 17.2.14.4. Recent Developments
- 17.2.14.5. Financials (Based on Availability)
- 17.2.15 Omron Healthcare Inc
- 17.2.15.1. Overview
- 17.2.15.2. Products
- 17.2.15.3. SWOT Analysis
- 17.2.15.4. Recent Developments
- 17.2.15.5. Financials (Based on Availability)
- 17.2.16 Fossil Group Inc
- 17.2.16.1. Overview
- 17.2.16.2. Products
- 17.2.16.3. SWOT Analysis
- 17.2.16.4. Recent Developments
- 17.2.16.5. Financials (Based on Availability)
- 17.2.17 Apple Inc
- 17.2.17.1. Overview
- 17.2.17.2. Products
- 17.2.17.3. SWOT Analysis
- 17.2.17.4. Recent Developments
- 17.2.17.5. Financials (Based on Availability)
- 17.2.18 Sony Corporation
- 17.2.18.1. Overview
- 17.2.18.2. Products
- 17.2.18.3. SWOT Analysis
- 17.2.18.4. Recent Developments
- 17.2.18.5. Financials (Based on Availability)
- 17.2.19 Nuheara Limited
- 17.2.19.1. Overview
- 17.2.19.2. Products
- 17.2.19.3. SWOT Analysis
- 17.2.19.4. Recent Developments
- 17.2.19.5. Financials (Based on Availability)
- 17.2.1 Huami Corporation
List of Figures
- Figure 1: Global Wearable Computing Devices Industry Revenue Breakdown (Million, %) by Region 2024 & 2032
- Figure 2: Global Wearable Computing Devices Industry Volume Breakdown (K Unit, %) by Region 2024 & 2032
- Figure 3: North America Wearable Computing Devices Industry Revenue (Million), by Country 2024 & 2032
- Figure 4: North America Wearable Computing Devices Industry Volume (K Unit), by Country 2024 & 2032
- Figure 5: North America Wearable Computing Devices Industry Revenue Share (%), by Country 2024 & 2032
- Figure 6: North America Wearable Computing Devices Industry Volume Share (%), by Country 2024 & 2032
- Figure 7: Europe Wearable Computing Devices Industry Revenue (Million), by Country 2024 & 2032
- Figure 8: Europe Wearable Computing Devices Industry Volume (K Unit), by Country 2024 & 2032
- Figure 9: Europe Wearable Computing Devices Industry Revenue Share (%), by Country 2024 & 2032
- Figure 10: Europe Wearable Computing Devices Industry Volume Share (%), by Country 2024 & 2032
- Figure 11: Asia Pacific Wearable Computing Devices Industry Revenue (Million), by Country 2024 & 2032
- Figure 12: Asia Pacific Wearable Computing Devices Industry Volume (K Unit), by Country 2024 & 2032
- Figure 13: Asia Pacific Wearable Computing Devices Industry Revenue Share (%), by Country 2024 & 2032
- Figure 14: Asia Pacific Wearable Computing Devices Industry Volume Share (%), by Country 2024 & 2032
- Figure 15: South America Wearable Computing Devices Industry Revenue (Million), by Country 2024 & 2032
- Figure 16: South America Wearable Computing Devices Industry Volume (K Unit), by Country 2024 & 2032
- Figure 17: South America Wearable Computing Devices Industry Revenue Share (%), by Country 2024 & 2032
- Figure 18: South America Wearable Computing Devices Industry Volume Share (%), by Country 2024 & 2032
- Figure 19: North America Wearable Computing Devices Industry Revenue (Million), by Country 2024 & 2032
- Figure 20: North America Wearable Computing Devices Industry Volume (K Unit), by Country 2024 & 2032
- Figure 21: North America Wearable Computing Devices Industry Revenue Share (%), by Country 2024 & 2032
- Figure 22: North America Wearable Computing Devices Industry Volume Share (%), by Country 2024 & 2032
- Figure 23: MEA Wearable Computing Devices Industry Revenue (Million), by Country 2024 & 2032
- Figure 24: MEA Wearable Computing Devices Industry Volume (K Unit), by Country 2024 & 2032
- Figure 25: MEA Wearable Computing Devices Industry Revenue Share (%), by Country 2024 & 2032
- Figure 26: MEA Wearable Computing Devices Industry Volume Share (%), by Country 2024 & 2032
- Figure 27: North America: United States Canada Mexico Wearable Computing Devices Industry Revenue (Million), by Product Type 2024 & 2032
- Figure 28: North America: United States Canada Mexico Wearable Computing Devices Industry Volume (K Unit), by Product Type 2024 & 2032
- Figure 29: North America: United States Canada Mexico Wearable Computing Devices Industry Revenue Share (%), by Product Type 2024 & 2032
- Figure 30: North America: United States Canada Mexico Wearable Computing Devices Industry Volume Share (%), by Product Type 2024 & 2032
- Figure 31: North America: United States Canada Mexico Wearable Computing Devices Industry Revenue (Million), by End User 2024 & 2032
- Figure 32: North America: United States Canada Mexico Wearable Computing Devices Industry Volume (K Unit), by End User 2024 & 2032
- Figure 33: North America: United States Canada Mexico Wearable Computing Devices Industry Revenue Share (%), by End User 2024 & 2032
- Figure 34: North America: United States Canada Mexico Wearable Computing Devices Industry Volume Share (%), by End User 2024 & 2032
- Figure 35: North America: United States Canada Mexico Wearable Computing Devices Industry Revenue (Million), by Country 2024 & 2032
- Figure 36: North America: United States Canada Mexico Wearable Computing Devices Industry Volume (K Unit), by Country 2024 & 2032
- Figure 37: North America: United States Canada Mexico Wearable Computing Devices Industry Revenue Share (%), by Country 2024 & 2032
- Figure 38: North America: United States Canada Mexico Wearable Computing Devices Industry Volume Share (%), by Country 2024 & 2032
- Figure 39: Europe: Germany: France: Italy: United Kingdom Netherlands Rest of Europe Wearable Computing Devices Industry Revenue (Million), by Product Type 2024 & 2032
- Figure 40: Europe: Germany: France: Italy: United Kingdom Netherlands Rest of Europe Wearable Computing Devices Industry Volume (K Unit), by Product Type 2024 & 2032
- Figure 41: Europe: Germany: France: Italy: United Kingdom Netherlands Rest of Europe Wearable Computing Devices Industry Revenue Share (%), by Product Type 2024 & 2032
- Figure 42: Europe: Germany: France: Italy: United Kingdom Netherlands Rest of Europe Wearable Computing Devices Industry Volume Share (%), by Product Type 2024 & 2032
- Figure 43: Europe: Germany: France: Italy: United Kingdom Netherlands Rest of Europe Wearable Computing Devices Industry Revenue (Million), by End User 2024 & 2032
- Figure 44: Europe: Germany: France: Italy: United Kingdom Netherlands Rest of Europe Wearable Computing Devices Industry Volume (K Unit), by End User 2024 & 2032
- Figure 45: Europe: Germany: France: Italy: United Kingdom Netherlands Rest of Europe Wearable Computing Devices Industry Revenue Share (%), by End User 2024 & 2032
- Figure 46: Europe: Germany: France: Italy: United Kingdom Netherlands Rest of Europe Wearable Computing Devices Industry Volume Share (%), by End User 2024 & 2032
- Figure 47: Europe: Germany: France: Italy: United Kingdom Netherlands Rest of Europe Wearable Computing Devices Industry Revenue (Million), by Country 2024 & 2032
- Figure 48: Europe: Germany: France: Italy: United Kingdom Netherlands Rest of Europe Wearable Computing Devices Industry Volume (K Unit), by Country 2024 & 2032
- Figure 49: Europe: Germany: France: Italy: United Kingdom Netherlands Rest of Europe Wearable Computing Devices Industry Revenue Share (%), by Country 2024 & 2032
- Figure 50: Europe: Germany: France: Italy: United Kingdom Netherlands Rest of Europe Wearable Computing Devices Industry Volume Share (%), by Country 2024 & 2032
- Figure 51: Asia Pacific: China, Japan, India, South Korea, Taiwan, Australia, Rest of Asia-Pacific Wearable Computing Devices Industry Revenue (Million), by Product Type 2024 & 2032
- Figure 52: Asia Pacific: China, Japan, India, South Korea, Taiwan, Australia, Rest of Asia-Pacific Wearable Computing Devices Industry Volume (K Unit), by Product Type 2024 & 2032
- Figure 53: Asia Pacific: China, Japan, India, South Korea, Taiwan, Australia, Rest of Asia-Pacific Wearable Computing Devices Industry Revenue Share (%), by Product Type 2024 & 2032
- Figure 54: Asia Pacific: China, Japan, India, South Korea, Taiwan, Australia, Rest of Asia-Pacific Wearable Computing Devices Industry Volume Share (%), by Product Type 2024 & 2032
- Figure 55: Asia Pacific: China, Japan, India, South Korea, Taiwan, Australia, Rest of Asia-Pacific Wearable Computing Devices Industry Revenue (Million), by End User 2024 & 2032
- Figure 56: Asia Pacific: China, Japan, India, South Korea, Taiwan, Australia, Rest of Asia-Pacific Wearable Computing Devices Industry Volume (K Unit), by End User 2024 & 2032
- Figure 57: Asia Pacific: China, Japan, India, South Korea, Taiwan, Australia, Rest of Asia-Pacific Wearable Computing Devices Industry Revenue Share (%), by End User 2024 & 2032
- Figure 58: Asia Pacific: China, Japan, India, South Korea, Taiwan, Australia, Rest of Asia-Pacific Wearable Computing Devices Industry Volume Share (%), by End User 2024 & 2032
- Figure 59: Asia Pacific: China, Japan, India, South Korea, Taiwan, Australia, Rest of Asia-Pacific Wearable Computing Devices Industry Revenue (Million), by Country 2024 & 2032
- Figure 60: Asia Pacific: China, Japan, India, South Korea, Taiwan, Australia, Rest of Asia-Pacific Wearable Computing Devices Industry Volume (K Unit), by Country 2024 & 2032
- Figure 61: Asia Pacific: China, Japan, India, South Korea, Taiwan, Australia, Rest of Asia-Pacific Wearable Computing Devices Industry Revenue Share (%), by Country 2024 & 2032
- Figure 62: Asia Pacific: China, Japan, India, South Korea, Taiwan, Australia, Rest of Asia-Pacific Wearable Computing Devices Industry Volume Share (%), by Country 2024 & 2032
- Figure 63: South America : Brazil, Argentina, Rest of South America Wearable Computing Devices Industry Revenue (Million), by Product Type 2024 & 2032
- Figure 64: South America : Brazil, Argentina, Rest of South America Wearable Computing Devices Industry Volume (K Unit), by Product Type 2024 & 2032
- Figure 65: South America : Brazil, Argentina, Rest of South America Wearable Computing Devices Industry Revenue Share (%), by Product Type 2024 & 2032
- Figure 66: South America : Brazil, Argentina, Rest of South America Wearable Computing Devices Industry Volume Share (%), by Product Type 2024 & 2032
- Figure 67: South America : Brazil, Argentina, Rest of South America Wearable Computing Devices Industry Revenue (Million), by End User 2024 & 2032
- Figure 68: South America : Brazil, Argentina, Rest of South America Wearable Computing Devices Industry Volume (K Unit), by End User 2024 & 2032
- Figure 69: South America : Brazil, Argentina, Rest of South America Wearable Computing Devices Industry Revenue Share (%), by End User 2024 & 2032
- Figure 70: South America : Brazil, Argentina, Rest of South America Wearable Computing Devices Industry Volume Share (%), by End User 2024 & 2032
- Figure 71: South America : Brazil, Argentina, Rest of South America Wearable Computing Devices Industry Revenue (Million), by Country 2024 & 2032
- Figure 72: South America : Brazil, Argentina, Rest of South America Wearable Computing Devices Industry Volume (K Unit), by Country 2024 & 2032
- Figure 73: South America : Brazil, Argentina, Rest of South America Wearable Computing Devices Industry Revenue Share (%), by Country 2024 & 2032
- Figure 74: South America : Brazil, Argentina, Rest of South America Wearable Computing Devices Industry Volume Share (%), by Country 2024 & 2032
- Figure 75: MEA: Middle East, Africa Wearable Computing Devices Industry Revenue (Million), by Product Type 2024 & 2032
- Figure 76: MEA: Middle East, Africa Wearable Computing Devices Industry Volume (K Unit), by Product Type 2024 & 2032
- Figure 77: MEA: Middle East, Africa Wearable Computing Devices Industry Revenue Share (%), by Product Type 2024 & 2032
- Figure 78: MEA: Middle East, Africa Wearable Computing Devices Industry Volume Share (%), by Product Type 2024 & 2032
- Figure 79: MEA: Middle East, Africa Wearable Computing Devices Industry Revenue (Million), by End User 2024 & 2032
- Figure 80: MEA: Middle East, Africa Wearable Computing Devices Industry Volume (K Unit), by End User 2024 & 2032
- Figure 81: MEA: Middle East, Africa Wearable Computing Devices Industry Revenue Share (%), by End User 2024 & 2032
- Figure 82: MEA: Middle East, Africa Wearable Computing Devices Industry Volume Share (%), by End User 2024 & 2032
- Figure 83: MEA: Middle East, Africa Wearable Computing Devices Industry Revenue (Million), by Country 2024 & 2032
- Figure 84: MEA: Middle East, Africa Wearable Computing Devices Industry Volume (K Unit), by Country 2024 & 2032
- Figure 85: MEA: Middle East, Africa Wearable Computing Devices Industry Revenue Share (%), by Country 2024 & 2032
- Figure 86: MEA: Middle East, Africa Wearable Computing Devices Industry Volume Share (%), by Country 2024 & 2032
List of Tables
- Table 1: Global Wearable Computing Devices Industry Revenue Million Forecast, by Region 2019 & 2032
- Table 2: Global Wearable Computing Devices Industry Volume K Unit Forecast, by Region 2019 & 2032
- Table 3: Global Wearable Computing Devices Industry Revenue Million Forecast, by Product Type 2019 & 2032
- Table 4: Global Wearable Computing Devices Industry Volume K Unit Forecast, by Product Type 2019 & 2032
- Table 5: Global Wearable Computing Devices Industry Revenue Million Forecast, by End User 2019 & 2032
- Table 6: Global Wearable Computing Devices Industry Volume K Unit Forecast, by End User 2019 & 2032
- Table 7: Global Wearable Computing Devices Industry Revenue Million Forecast, by Region 2019 & 2032
- Table 8: Global Wearable Computing Devices Industry Volume K Unit Forecast, by Region 2019 & 2032
- Table 9: Global Wearable Computing Devices Industry Revenue Million Forecast, by Country 2019 & 2032
- Table 10: Global Wearable Computing Devices Industry Volume K Unit Forecast, by Country 2019 & 2032
- Table 11: United States Wearable Computing Devices Industry Revenue (Million) Forecast, by Application 2019 & 2032
- Table 12: United States Wearable Computing Devices Industry Volume (K Unit) Forecast, by Application 2019 & 2032
- Table 13: Canada Wearable Computing Devices Industry Revenue (Million) Forecast, by Application 2019 & 2032
- Table 14: Canada Wearable Computing Devices Industry Volume (K Unit) Forecast, by Application 2019 & 2032
- Table 15: Mexico Wearable Computing Devices Industry Revenue (Million) Forecast, by Application 2019 & 2032
- Table 16: Mexico Wearable Computing Devices Industry Volume (K Unit) Forecast, by Application 2019 & 2032
- Table 17: Global Wearable Computing Devices Industry Revenue Million Forecast, by Country 2019 & 2032
- Table 18: Global Wearable Computing Devices Industry Volume K Unit Forecast, by Country 2019 & 2032
- Table 19: Germany Wearable Computing Devices Industry Revenue (Million) Forecast, by Application 2019 & 2032
- Table 20: Germany Wearable Computing Devices Industry Volume (K Unit) Forecast, by Application 2019 & 2032
- Table 21: United Kingdom Wearable Computing Devices Industry Revenue (Million) Forecast, by Application 2019 & 2032
- Table 22: United Kingdom Wearable Computing Devices Industry Volume (K Unit) Forecast, by Application 2019 & 2032
- Table 23: France Wearable Computing Devices Industry Revenue (Million) Forecast, by Application 2019 & 2032
- Table 24: France Wearable Computing Devices Industry Volume (K Unit) Forecast, by Application 2019 & 2032
- Table 25: Spain Wearable Computing Devices Industry Revenue (Million) Forecast, by Application 2019 & 2032
- Table 26: Spain Wearable Computing Devices Industry Volume (K Unit) Forecast, by Application 2019 & 2032
- Table 27: Italy Wearable Computing Devices Industry Revenue (Million) Forecast, by Application 2019 & 2032
- Table 28: Italy Wearable Computing Devices Industry Volume (K Unit) Forecast, by Application 2019 & 2032
- Table 29: Spain Wearable Computing Devices Industry Revenue (Million) Forecast, by Application 2019 & 2032
- Table 30: Spain Wearable Computing Devices Industry Volume (K Unit) Forecast, by Application 2019 & 2032
- Table 31: Belgium Wearable Computing Devices Industry Revenue (Million) Forecast, by Application 2019 & 2032
- Table 32: Belgium Wearable Computing Devices Industry Volume (K Unit) Forecast, by Application 2019 & 2032
- Table 33: Netherland Wearable Computing Devices Industry Revenue (Million) Forecast, by Application 2019 & 2032
- Table 34: Netherland Wearable Computing Devices Industry Volume (K Unit) Forecast, by Application 2019 & 2032
- Table 35: Nordics Wearable Computing Devices Industry Revenue (Million) Forecast, by Application 2019 & 2032
- Table 36: Nordics Wearable Computing Devices Industry Volume (K Unit) Forecast, by Application 2019 & 2032
- Table 37: Rest of Europe Wearable Computing Devices Industry Revenue (Million) Forecast, by Application 2019 & 2032
- Table 38: Rest of Europe Wearable Computing Devices Industry Volume (K Unit) Forecast, by Application 2019 & 2032
- Table 39: Global Wearable Computing Devices Industry Revenue Million Forecast, by Country 2019 & 2032
- Table 40: Global Wearable Computing Devices Industry Volume K Unit Forecast, by Country 2019 & 2032
- Table 41: China Wearable Computing Devices Industry Revenue (Million) Forecast, by Application 2019 & 2032
- Table 42: China Wearable Computing Devices Industry Volume (K Unit) Forecast, by Application 2019 & 2032
- Table 43: Japan Wearable Computing Devices Industry Revenue (Million) Forecast, by Application 2019 & 2032
- Table 44: Japan Wearable Computing Devices Industry Volume (K Unit) Forecast, by Application 2019 & 2032
- Table 45: India Wearable Computing Devices Industry Revenue (Million) Forecast, by Application 2019 & 2032
- Table 46: India Wearable Computing Devices Industry Volume (K Unit) Forecast, by Application 2019 & 2032
- Table 47: South Korea Wearable Computing Devices Industry Revenue (Million) Forecast, by Application 2019 & 2032
- Table 48: South Korea Wearable Computing Devices Industry Volume (K Unit) Forecast, by Application 2019 & 2032
- Table 49: Southeast Asia Wearable Computing Devices Industry Revenue (Million) Forecast, by Application 2019 & 2032
- Table 50: Southeast Asia Wearable Computing Devices Industry Volume (K Unit) Forecast, by Application 2019 & 2032
- Table 51: Australia Wearable Computing Devices Industry Revenue (Million) Forecast, by Application 2019 & 2032
- Table 52: Australia Wearable Computing Devices Industry Volume (K Unit) Forecast, by Application 2019 & 2032
- Table 53: Indonesia Wearable Computing Devices Industry Revenue (Million) Forecast, by Application 2019 & 2032
- Table 54: Indonesia Wearable Computing Devices Industry Volume (K Unit) Forecast, by Application 2019 & 2032
- Table 55: Phillipes Wearable Computing Devices Industry Revenue (Million) Forecast, by Application 2019 & 2032
- Table 56: Phillipes Wearable Computing Devices Industry Volume (K Unit) Forecast, by Application 2019 & 2032
- Table 57: Singapore Wearable Computing Devices Industry Revenue (Million) Forecast, by Application 2019 & 2032
- Table 58: Singapore Wearable Computing Devices Industry Volume (K Unit) Forecast, by Application 2019 & 2032
- Table 59: Thailandc Wearable Computing Devices Industry Revenue (Million) Forecast, by Application 2019 & 2032
- Table 60: Thailandc Wearable Computing Devices Industry Volume (K Unit) Forecast, by Application 2019 & 2032
- Table 61: Rest of Asia Pacific Wearable Computing Devices Industry Revenue (Million) Forecast, by Application 2019 & 2032
- Table 62: Rest of Asia Pacific Wearable Computing Devices Industry Volume (K Unit) Forecast, by Application 2019 & 2032
- Table 63: Global Wearable Computing Devices Industry Revenue Million Forecast, by Country 2019 & 2032
- Table 64: Global Wearable Computing Devices Industry Volume K Unit Forecast, by Country 2019 & 2032
- Table 65: Brazil Wearable Computing Devices Industry Revenue (Million) Forecast, by Application 2019 & 2032
- Table 66: Brazil Wearable Computing Devices Industry Volume (K Unit) Forecast, by Application 2019 & 2032
- Table 67: Argentina Wearable Computing Devices Industry Revenue (Million) Forecast, by Application 2019 & 2032
- Table 68: Argentina Wearable Computing Devices Industry Volume (K Unit) Forecast, by Application 2019 & 2032
- Table 69: Peru Wearable Computing Devices Industry Revenue (Million) Forecast, by Application 2019 & 2032
- Table 70: Peru Wearable Computing Devices Industry Volume (K Unit) Forecast, by Application 2019 & 2032
- Table 71: Chile Wearable Computing Devices Industry Revenue (Million) Forecast, by Application 2019 & 2032
- Table 72: Chile Wearable Computing Devices Industry Volume (K Unit) Forecast, by Application 2019 & 2032
- Table 73: Colombia Wearable Computing Devices Industry Revenue (Million) Forecast, by Application 2019 & 2032
- Table 74: Colombia Wearable Computing Devices Industry Volume (K Unit) Forecast, by Application 2019 & 2032
- Table 75: Ecuador Wearable Computing Devices Industry Revenue (Million) Forecast, by Application 2019 & 2032
- Table 76: Ecuador Wearable Computing Devices Industry Volume (K Unit) Forecast, by Application 2019 & 2032
- Table 77: Venezuela Wearable Computing Devices Industry Revenue (Million) Forecast, by Application 2019 & 2032
- Table 78: Venezuela Wearable Computing Devices Industry Volume (K Unit) Forecast, by Application 2019 & 2032
- Table 79: Rest of South America Wearable Computing Devices Industry Revenue (Million) Forecast, by Application 2019 & 2032
- Table 80: Rest of South America Wearable Computing Devices Industry Volume (K Unit) Forecast, by Application 2019 & 2032
- Table 81: Global Wearable Computing Devices Industry Revenue Million Forecast, by Country 2019 & 2032
- Table 82: Global Wearable Computing Devices Industry Volume K Unit Forecast, by Country 2019 & 2032
- Table 83: United States Wearable Computing Devices Industry Revenue (Million) Forecast, by Application 2019 & 2032
- Table 84: United States Wearable Computing Devices Industry Volume (K Unit) Forecast, by Application 2019 & 2032
- Table 85: Canada Wearable Computing Devices Industry Revenue (Million) Forecast, by Application 2019 & 2032
- Table 86: Canada Wearable Computing Devices Industry Volume (K Unit) Forecast, by Application 2019 & 2032
- Table 87: Mexico Wearable Computing Devices Industry Revenue (Million) Forecast, by Application 2019 & 2032
- Table 88: Mexico Wearable Computing Devices Industry Volume (K Unit) Forecast, by Application 2019 & 2032
- Table 89: Global Wearable Computing Devices Industry Revenue Million Forecast, by Country 2019 & 2032
- Table 90: Global Wearable Computing Devices Industry Volume K Unit Forecast, by Country 2019 & 2032
- Table 91: United Arab Emirates Wearable Computing Devices Industry Revenue (Million) Forecast, by Application 2019 & 2032
- Table 92: United Arab Emirates Wearable Computing Devices Industry Volume (K Unit) Forecast, by Application 2019 & 2032
- Table 93: Saudi Arabia Wearable Computing Devices Industry Revenue (Million) Forecast, by Application 2019 & 2032
- Table 94: Saudi Arabia Wearable Computing Devices Industry Volume (K Unit) Forecast, by Application 2019 & 2032
- Table 95: South Africa Wearable Computing Devices Industry Revenue (Million) Forecast, by Application 2019 & 2032
- Table 96: South Africa Wearable Computing Devices Industry Volume (K Unit) Forecast, by Application 2019 & 2032
- Table 97: Rest of Middle East and Africa Wearable Computing Devices Industry Revenue (Million) Forecast, by Application 2019 & 2032
- Table 98: Rest of Middle East and Africa Wearable Computing Devices Industry Volume (K Unit) Forecast, by Application 2019 & 2032
- Table 99: Global Wearable Computing Devices Industry Revenue Million Forecast, by Product Type 2019 & 2032
- Table 100: Global Wearable Computing Devices Industry Volume K Unit Forecast, by Product Type 2019 & 2032
- Table 101: Global Wearable Computing Devices Industry Revenue Million Forecast, by End User 2019 & 2032
- Table 102: Global Wearable Computing Devices Industry Volume K Unit Forecast, by End User 2019 & 2032
- Table 103: Global Wearable Computing Devices Industry Revenue Million Forecast, by Country 2019 & 2032
- Table 104: Global Wearable Computing Devices Industry Volume K Unit Forecast, by Country 2019 & 2032
- Table 105: Global Wearable Computing Devices Industry Revenue Million Forecast, by Product Type 2019 & 2032
- Table 106: Global Wearable Computing Devices Industry Volume K Unit Forecast, by Product Type 2019 & 2032
- Table 107: Global Wearable Computing Devices Industry Revenue Million Forecast, by End User 2019 & 2032
- Table 108: Global Wearable Computing Devices Industry Volume K Unit Forecast, by End User 2019 & 2032
- Table 109: Global Wearable Computing Devices Industry Revenue Million Forecast, by Country 2019 & 2032
- Table 110: Global Wearable Computing Devices Industry Volume K Unit Forecast, by Country 2019 & 2032
- Table 111: Global Wearable Computing Devices Industry Revenue Million Forecast, by Product Type 2019 & 2032
- Table 112: Global Wearable Computing Devices Industry Volume K Unit Forecast, by Product Type 2019 & 2032
- Table 113: Global Wearable Computing Devices Industry Revenue Million Forecast, by End User 2019 & 2032
- Table 114: Global Wearable Computing Devices Industry Volume K Unit Forecast, by End User 2019 & 2032
- Table 115: Global Wearable Computing Devices Industry Revenue Million Forecast, by Country 2019 & 2032
- Table 116: Global Wearable Computing Devices Industry Volume K Unit Forecast, by Country 2019 & 2032
- Table 117: Global Wearable Computing Devices Industry Revenue Million Forecast, by Product Type 2019 & 2032
- Table 118: Global Wearable Computing Devices Industry Volume K Unit Forecast, by Product Type 2019 & 2032
- Table 119: Global Wearable Computing Devices Industry Revenue Million Forecast, by End User 2019 & 2032
- Table 120: Global Wearable Computing Devices Industry Volume K Unit Forecast, by End User 2019 & 2032
- Table 121: Global Wearable Computing Devices Industry Revenue Million Forecast, by Country 2019 & 2032
- Table 122: Global Wearable Computing Devices Industry Volume K Unit Forecast, by Country 2019 & 2032
- Table 123: Global Wearable Computing Devices Industry Revenue Million Forecast, by Product Type 2019 & 2032
- Table 124: Global Wearable Computing Devices Industry Volume K Unit Forecast, by Product Type 2019 & 2032
- Table 125: Global Wearable Computing Devices Industry Revenue Million Forecast, by End User 2019 & 2032
- Table 126: Global Wearable Computing Devices Industry Volume K Unit Forecast, by End User 2019 & 2032
- Table 127: Global Wearable Computing Devices Industry Revenue Million Forecast, by Country 2019 & 2032
- Table 128: Global Wearable Computing Devices Industry Volume K Unit Forecast, by Country 2019 & 2032
Frequently Asked Questions
1. What is the projected Compound Annual Growth Rate (CAGR) of the Wearable Computing Devices Industry?
The projected CAGR is approximately 19.90%.
2. Which companies are prominent players in the Wearable Computing Devices Industry?
Key companies in the market include Huami Corporation, Samsung Electronics Co Ltd, Transcend Information Inc, Garmin Ltd, AIQ Smart Clothing Inc, GoPro Inc, Microsoft Corporation, Medtronic PLC, Cyberdyne Inc, Fitbit Inc, Ekso Bionics Holdings Inc, Withings, Huawei Technologies Co Ltd, Sensoria Inc, Omron Healthcare Inc, Fossil Group Inc, Apple Inc, Sony Corporation, Nuheara Limited.
3. What are the main segments of the Wearable Computing Devices Industry?
The market segments include Product Type, End User.
4. Can you provide details about the market size?
The market size is estimated to be USD XX Million as of 2022.
5. What are some drivers contributing to market growth?
Increasing Technological Advancements in the Wearables Market; Increase in Health Awareness Among Consumers.
6. What are the notable trends driving market growth?
Smart Clothing Expected to Witness Significant Growth.
7. Are there any restraints impacting market growth?
Growing Complexity of Wearable Devices and Limited Use of Features. Augmented by Security Risks.
8. Can you provide examples of recent developments in the market?
October 2022- Microsoft rolled out the first batch of IVAS (Integrated Visual Augmentation System) to US Army. The headsets are designed with advanced features like night and thermal vision, tactical edge computing, situational awareness, passive targeting, and Microsoft Azure cloud computing.
9. What pricing options are available for accessing the report?
Pricing options include single-user, multi-user, and enterprise licenses priced at USD 4750, USD 5250, and USD 8750 respectively.
10. Is the market size provided in terms of value or volume?
The market size is provided in terms of value, measured in Million and volume, measured in K Unit.
11. Are there any specific market keywords associated with the report?
Yes, the market keyword associated with the report is "Wearable Computing Devices Industry," which aids in identifying and referencing the specific market segment covered.
12. How do I determine which pricing option suits my needs best?
The pricing options vary based on user requirements and access needs. Individual users may opt for single-user licenses, while businesses requiring broader access may choose multi-user or enterprise licenses for cost-effective access to the report.
13. Are there any additional resources or data provided in the Wearable Computing Devices Industry report?
While the report offers comprehensive insights, it's advisable to review the specific contents or supplementary materials provided to ascertain if additional resources or data are available.
14. How can I stay updated on further developments or reports in the Wearable Computing Devices Industry?
To stay informed about further developments, trends, and reports in the Wearable Computing Devices Industry, consider subscribing to industry newsletters, following relevant companies and organizations, or regularly checking reputable industry news sources and publications.
Methodology
Step 1 - Identification of Relevant Samples Size from Population Database


Step 2 - Approaches for Defining Global Market Size (Value, Volume* & Price*)

Note*: In applicable scenarios
Step 3 - Data Sources
Primary Research
- Web Analytics
- Survey Reports
- Research Institute
- Latest Research Reports
- Opinion Leaders
Secondary Research
- Annual Reports
- White Paper
- Latest Press Release
- Industry Association
- Paid Database
- Investor Presentations

Step 4 - Data Triangulation
Involves using different sources of information in order to increase the validity of a study
These sources are likely to be stakeholders in a program - participants, other researchers, program staff, other community members, and so on.
Then we put all data in single framework & apply various statistical tools to find out the dynamic on the market.
During the analysis stage, feedback from the stakeholder groups would be compared to determine areas of agreement as well as areas of divergence
