

Key Insights
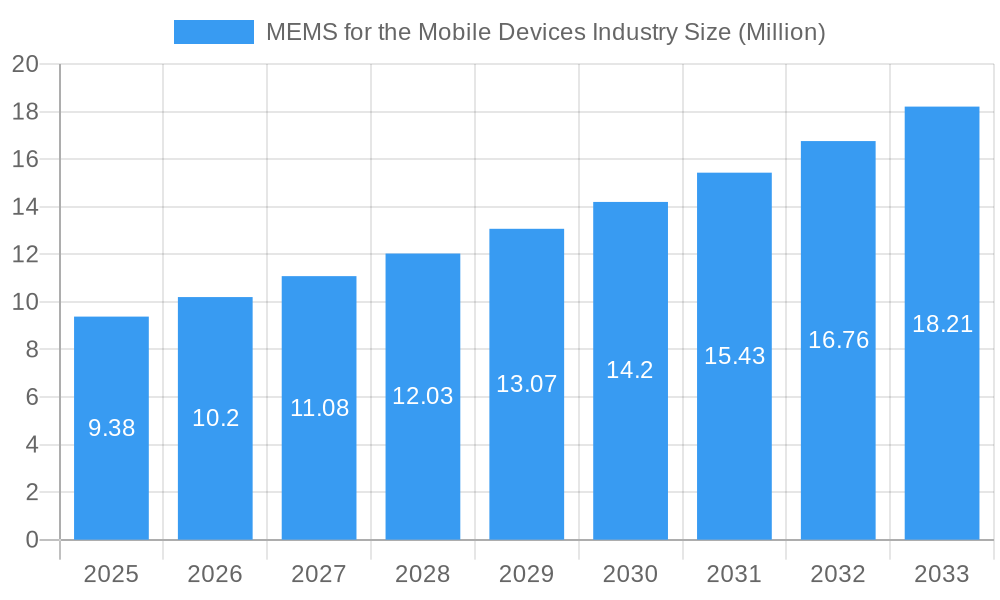
The MEMS for the Mobile Devices Industry is poised for substantial growth, with a current market size of approximately $9.38 billion. Projected to expand at a Compound Annual Growth Rate (CAGR) of 8.80% from 2025 to 2033, the market value is expected to reach over $20 billion by the end of the forecast period. This robust expansion is primarily driven by the increasing demand for advanced smartphone features that rely heavily on MEMS technology. Innovations in camera stabilization, audio quality, haptic feedback, and advanced sensing capabilities, such as environmental monitoring and enhanced biometric security, are key growth catalysts. The continuous evolution of mobile device form factors, including foldable phones and wearables, further necessitates miniaturized and high-performance MEMS solutions. Furthermore, the integration of artificial intelligence and machine learning in mobile devices leverages the data provided by MEMS sensors for sophisticated user experiences and contextual awareness, fueling market penetration.
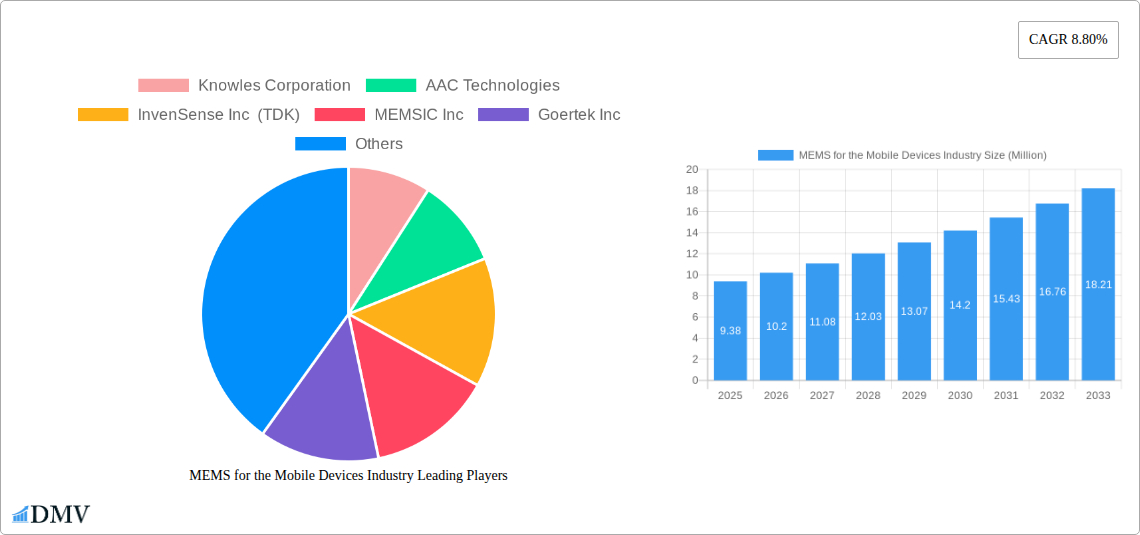
MEMS for the Mobile Devices Industry Market Size (In Million)
Despite the optimistic outlook, several factors present challenges to the market's unhindered growth. High development costs associated with cutting-edge MEMS fabrication and the complexity of integrating multiple sensors into increasingly compact device architectures can act as a restraint. Additionally, the industry faces pressure to continually reduce component costs to maintain competitive pricing for end-user devices, which can impact profit margins for MEMS manufacturers. Supply chain disruptions and the reliance on specialized raw materials can also pose potential hurdles. However, the relentless pursuit of enhanced functionality and improved user engagement in the fiercely competitive mobile device market ensures that the demand for innovative MEMS solutions will persist, driving the industry forward. Key sensor types like fingerprint sensors, accelerometers, and microphones are expected to witness significant adoption, with emerging sensor technologies also gaining traction.
MEMS for the Mobile Devices Industry Company Market Share
MEMS for the Mobile Devices Industry Market Composition & Trends
This comprehensive report offers an in-depth analysis of the Micro-Electro-Mechanical Systems (MEMS) market specifically tailored for the mobile devices industry. Spanning a study period from 2019 to 2033, with a base year of 2025, this report delves into the intricate market composition and prevailing trends. We evaluate market concentration, identifying key players and their approximate market share distribution, which is projected to see significant shifts within the forecast period (2025-2033). Innovation catalysts are thoroughly examined, highlighting how advancements in miniaturization, power efficiency, and sensor fusion are driving adoption. The regulatory landscapes impacting MEMS development and deployment are assessed, alongside the identification of potential substitute products and their influence on market dynamics. End-user profiles for mobile device manufacturers are detailed, outlining their evolving needs and specifications for MEMS components. Furthermore, an overview of Mergers & Acquisitions (M&A) activities is provided, including estimated deal values and their strategic implications for market consolidation. The report offers insights into the competitive landscape, where market share is expected to evolve from approximately 40% for leading players in the historical period (2019-2024) to a more consolidated structure in the coming years.
MEMS for the Mobile Devices Industry Industry Evolution
The MEMS for the Mobile Devices Industry market is undergoing a significant evolution, driven by relentless technological innovation and the ever-increasing demand for sophisticated mobile functionalities. Throughout the study period (2019-2033), the market has witnessed a consistent upward trajectory in growth, with the base year of 2025 serving as a critical benchmark for understanding current market dynamics. The historical period (2019-2024) laid the foundation for this growth, characterized by the widespread adoption of MEMS in smartphones for features like motion sensing and audio capture. Looking ahead to the forecast period (2025-2033), we anticipate a Compound Annual Growth Rate (CAGR) of approximately 15%, fueled by emerging applications in augmented reality (AR), virtual reality (VR), advanced driver-assistance systems (ADAS) integrated into mobile platforms, and the burgeoning Internet of Things (IoT) ecosystem. Technological advancements are at the forefront of this evolution. The relentless pursuit of smaller, more power-efficient, and highly accurate MEMS sensors, such as advanced accelerometers, gyroscopes, and pressure sensors, is enabling the creation of thinner, more feature-rich mobile devices. Moreover, the integration of artificial intelligence (AI) and machine learning (ML) directly onto MEMS chips is unlocking new levels of intelligence and personalization for mobile users. Shifting consumer demands are also playing a pivotal role. Consumers are increasingly expecting their mobile devices to be not just communication tools, but also sophisticated personal assistants, health trackers, and immersive entertainment platforms. This expectation directly translates into a greater need for diverse and high-performance MEMS sensors capable of capturing a wide array of environmental and user data. For instance, the adoption rate of advanced biometric sensors, including high-resolution fingerprint sensors and sophisticated facial recognition modules powered by MEMS, has seen a significant surge, contributing to an estimated market penetration of over 80% in premium smartphones by 2025. Similarly, the demand for enhanced audio experiences, driven by the popularity of streaming services and voice assistants, has propelled the growth of MEMS microphones and BAW filters, with their integration now becoming standard across nearly all mobile device categories. The industry's ability to innovate and adapt to these evolving consumer needs and technological possibilities will dictate the pace and direction of market growth in the coming years, solidifying MEMS as an indispensable component of the modern mobile device.
Leading Regions, Countries, or Segments in MEMS for the Mobile Devices Industry
Within the dynamic MEMS for the Mobile Devices Industry, several key segments and geographical regions are emerging as dominant forces, shaping the market's trajectory. Among the various sensor types, Microphones are poised to exhibit the most significant growth and market dominance during the forecast period (2025-2033). This ascendancy is driven by a confluence of factors, including their ubiquitous presence in virtually every mobile device for voice calls, voice assistants, and advanced audio recording. The increasing sophistication of voice-activated features, the rise of true wireless stereo (TWS) earbuds, and the growing demand for high-fidelity audio experiences are all contributing to the insatiable appetite for MEMS microphones.
- Key Drivers for Microphone Dominance:
- Ubiquitous Integration: Essential for basic phone functionality and increasingly for advanced AI-driven interactions.
- TWS Earbud Boom: Driving demand for compact, high-performance MEMS microphones in smaller form factors.
- Voice Assistant Proliferation: Fueling the need for multiple, noise-canceling microphones for superior voice recognition.
- Advancements in Audio Quality: Enabling richer sound capture for content creation and consumption.
- Innovation in Acoustic Performance: Development of microphones with enhanced signal-to-noise ratios, lower power consumption, and improved environmental noise cancellation.
Geographically, Asia Pacific is predicted to remain the leading region in the MEMS for Mobile Devices Industry. This dominance is underpinned by several critical factors:
- Manufacturing Hub: The region is the global epicenter for mobile device manufacturing, housing a vast ecosystem of component suppliers, assemblers, and original design manufacturers (ODMs). Countries like China, South Korea, and Taiwan are at the forefront of this production.
- Surging Consumer Demand: The sheer volume of mobile device sales in countries like China, India, and Southeast Asian nations creates an immense domestic market for MEMS-enabled products.
- Investment in R&D: Significant investments in research and development by both local and international companies within Asia Pacific are driving innovation and production capabilities.
- Government Support: Favorable government policies and incentives aimed at promoting the semiconductor and electronics industries further bolster the region's leadership.
While microphones are expected to lead in growth, other sensor types like Fingerprint Sensors and Accelerometers will continue to command significant market share due to their essential roles in security and motion sensing, respectively. The demand for Gyroscopes will also remain robust, particularly with the growth of AR/VR applications and advanced mobile gaming. Pressure Sensors are finding increasing applications in environmental sensing and health monitoring, contributing to their steady growth. BAW Sensors, though a more specialized segment, are critical for advanced wireless communication and will see increased adoption with the rollout of 5G and beyond. The interplay between these sensor segments and their integration into diverse mobile device form factors will define the competitive landscape, with Asia Pacific consistently serving as the primary engine of growth and production for MEMS technologies in the mobile sector.
MEMS for the Mobile Devices Industry Product Innovations
Product innovations in MEMS for mobile devices are continuously pushing the boundaries of what these devices can achieve. We are witnessing the development of highly integrated System-in-Package (SiP) solutions that combine multiple MEMS sensors with control circuitry, leading to smaller footprints and enhanced functionality. For instance, advanced MEMS microphones are now offering superior noise cancellation and beamforming capabilities, crucial for clear voice commands in noisy environments. Innovations in accelerometers and gyroscopes are delivering higher precision and lower power consumption, enabling more sophisticated motion tracking for gaming and fitness applications. Pressure sensors are being miniaturized for advanced environmental monitoring, such as altitude and weather prediction directly from a smartphone. These innovations are not just about performance; they are about enabling new user experiences and functionalities that were previously unimaginable in a pocket-sized device, driving the evolution of the mobile ecosystem.
Propelling Factors for MEMS for the Mobile Devices Industry Growth
Several key growth drivers are propelling the MEMS for the Mobile Devices Industry forward. The relentless demand for miniaturization and power efficiency in mobile devices is a primary catalyst, forcing manufacturers to integrate more functionality into smaller, thinner designs, which MEMS technology facilitates. The proliferation of advanced features and applications, such as augmented reality (AR), virtual reality (VR), advanced voice assistants, and sophisticated biometrics, directly fuels the need for a wider array of specialized MEMS sensors. Economic factors like the increasing disposable income in emerging economies and the desire for the latest consumer electronics contribute to higher sales volumes. Furthermore, supportive regulatory frameworks and government initiatives promoting semiconductor innovation and domestic manufacturing in key regions are also playing a significant role in the market's expansion.
Obstacles in the MEMS for the Mobile Devices Industry Market
Despite its robust growth, the MEMS for the Mobile Devices Industry faces several obstacles. Intense price competition among manufacturers often leads to squeezed profit margins, especially for commoditized MEMS components. Supply chain disruptions, as witnessed in recent years, can significantly impact production volumes and lead times, affecting the ability of mobile device manufacturers to meet demand. The high cost of research and development for novel MEMS technologies can be a barrier for smaller players, creating consolidation pressures. Moreover, stringent quality control and reliability standards required for consumer electronics necessitate significant investment in testing and validation, adding to the overall cost of production. Navigating these challenges is crucial for sustained market success.
Future Opportunities in MEMS for the Mobile Devices Industry
The future holds significant opportunities for the MEMS for the Mobile Devices Industry. The growing integration of MEMS in wearable devices beyond smartwatches, such as smart clothing and advanced hearables, presents a substantial new market. The expansion of 5G technology will necessitate more sophisticated RF MEMS components for enhanced connectivity and performance. The increasing focus on health and wellness monitoring through mobile devices creates a demand for more advanced biomedical MEMS sensors. Furthermore, the continued development of AI and edge computing capabilities within mobile devices will require highly efficient and intelligent MEMS solutions for real-time data processing and decision-making.
Major Players in the MEMS for the Mobile Devices Industry Ecosystem
- Knowles Corporation
- AAC Technologies
- InvenSense Inc (TDK)
- MEMSIC Inc
- Goertek Inc
- Bosch Sensortec GmbH
- Murata Manufacturing
- STMicroelectronics NV
- Analog Devices Inc
- BSE Co Ltd
Key Developments in MEMS for the Mobile Devices Industry Industry
- December 2022: Knowles introduced new balanced armatures and MEMS microphones for over-the-counter hearing aids. The new product release provides performance and design flexibility to help speed up the production of hearing health products. Three full-range balanced armature receivers and two updated MEMS microphones will meet the stringent design and acoustic performance requirements of hearing aids.
- November 2022: Bosch partnered with microsystems design house Hahn-Schickard to develop MEMS micro speakers for audio and voice-based applications. The collaboration with Hahn-Schickard allowed the company to expand its expertise in MEMS micro speakers to strengthen its market position as a top manufacturer of sensor solutions for consumer electronics and position it as a critical player for mobile and audio-based applications.
Strategic MEMS for the Mobile Devices Industry Market Forecast
The strategic forecast for the MEMS for the Mobile Devices Industry is exceptionally bright, driven by ongoing technological advancements and evolving consumer needs. The persistent demand for thinner, more feature-rich mobile devices will continue to fuel the adoption of miniaturized and highly integrated MEMS solutions. Emerging applications in augmented reality, advanced voice control, and pervasive health monitoring are creating new avenues for growth. Key players are focusing on developing next-generation MEMS sensors with enhanced precision, lower power consumption, and intelligent processing capabilities. The increasing sophistication of mobile AI and the expansion of the 5G ecosystem will further necessitate advanced MEMS components, creating a robust market environment with substantial opportunities for innovation and expansion through the forecast period.
MEMS for the Mobile Devices Industry Segmentation
-
1. Type of Sensor
- 1.1. Fingerprint Sensor
- 1.2. Accelerometer Sensor
- 1.3. Gyroscope
- 1.4. Pressure Sensor
- 1.5. BAW Sensor
- 1.6. Microphones
- 1.7. Other Types of Sensors
MEMS for the Mobile Devices Industry Segmentation By Geography
- 1. North America
- 2. Europe
- 3. Asia Pacific
- 4. Latin America
- 5. Middle East and Africa
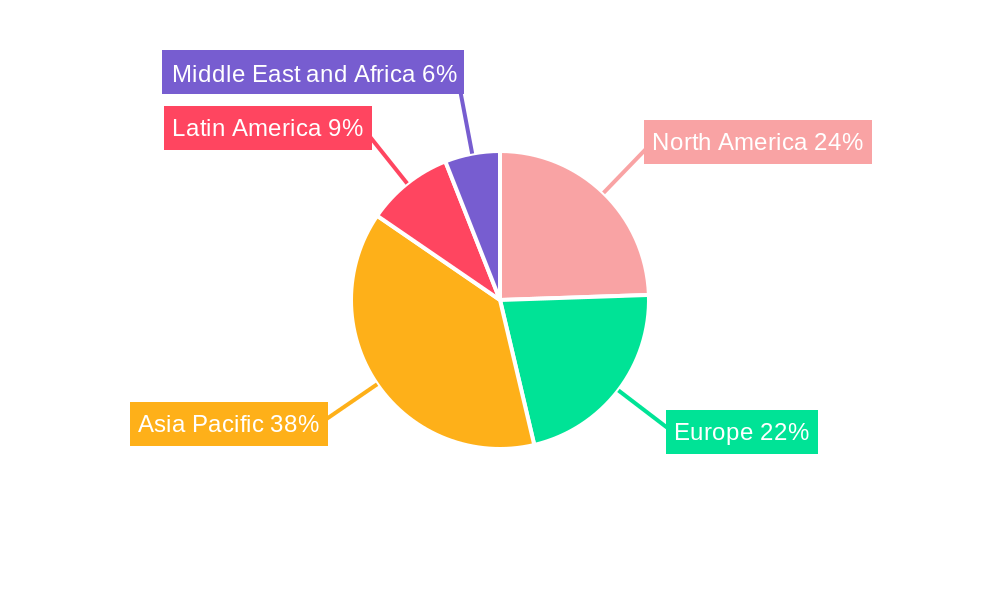
MEMS for the Mobile Devices Industry Regional Market Share
Geographic Coverage of MEMS for the Mobile Devices Industry
MEMS for the Mobile Devices Industry REPORT HIGHLIGHTS
| Aspects | Details |
|---|---|
| Study Period | 2020-2034 |
| Base Year | 2025 |
| Estimated Year | 2026 |
| Forecast Period | 2026-2034 |
| Historical Period | 2020-2025 |
| Growth Rate | CAGR of 8.80% from 2020-2034 |
| Segmentation |
|
Table of Contents
- 1. Introduction
- 1.1. Research Scope
- 1.2. Market Segmentation
- 1.3. Research Methodology
- 1.4. Definitions and Assumptions
- 2. Executive Summary
- 2.1. Introduction
- 3. Market Dynamics
- 3.1. Introduction
- 3.2. Market Drivers
- 3.2.1. Increasing Acceptance of Miniaturization Trend; Increasing Demand for High-Performance Devices
- 3.3. Market Restrains
- 3.3.1. Highly Complex Manufacturing Process and Demanding Cycle Time; Lack of Standardized Fabrication Process
- 3.4. Market Trends
- 3.4.1. Increasing Acceptance of Miniaturization Trend to Drive the Market
- 4. Market Factor Analysis
- 4.1. Porters Five Forces
- 4.2. Supply/Value Chain
- 4.3. PESTEL analysis
- 4.4. Market Entropy
- 4.5. Patent/Trademark Analysis
- 5. Global MEMS for the Mobile Devices Industry Analysis, Insights and Forecast, 2020-2032
- 5.1. Market Analysis, Insights and Forecast - by Type of Sensor
- 5.1.1. Fingerprint Sensor
- 5.1.2. Accelerometer Sensor
- 5.1.3. Gyroscope
- 5.1.4. Pressure Sensor
- 5.1.5. BAW Sensor
- 5.1.6. Microphones
- 5.1.7. Other Types of Sensors
- 5.2. Market Analysis, Insights and Forecast - by Region
- 5.2.1. North America
- 5.2.2. Europe
- 5.2.3. Asia Pacific
- 5.2.4. Latin America
- 5.2.5. Middle East and Africa
- 5.1. Market Analysis, Insights and Forecast - by Type of Sensor
- 6. North America MEMS for the Mobile Devices Industry Analysis, Insights and Forecast, 2020-2032
- 6.1. Market Analysis, Insights and Forecast - by Type of Sensor
- 6.1.1. Fingerprint Sensor
- 6.1.2. Accelerometer Sensor
- 6.1.3. Gyroscope
- 6.1.4. Pressure Sensor
- 6.1.5. BAW Sensor
- 6.1.6. Microphones
- 6.1.7. Other Types of Sensors
- 6.1. Market Analysis, Insights and Forecast - by Type of Sensor
- 7. Europe MEMS for the Mobile Devices Industry Analysis, Insights and Forecast, 2020-2032
- 7.1. Market Analysis, Insights and Forecast - by Type of Sensor
- 7.1.1. Fingerprint Sensor
- 7.1.2. Accelerometer Sensor
- 7.1.3. Gyroscope
- 7.1.4. Pressure Sensor
- 7.1.5. BAW Sensor
- 7.1.6. Microphones
- 7.1.7. Other Types of Sensors
- 7.1. Market Analysis, Insights and Forecast - by Type of Sensor
- 8. Asia Pacific MEMS for the Mobile Devices Industry Analysis, Insights and Forecast, 2020-2032
- 8.1. Market Analysis, Insights and Forecast - by Type of Sensor
- 8.1.1. Fingerprint Sensor
- 8.1.2. Accelerometer Sensor
- 8.1.3. Gyroscope
- 8.1.4. Pressure Sensor
- 8.1.5. BAW Sensor
- 8.1.6. Microphones
- 8.1.7. Other Types of Sensors
- 8.1. Market Analysis, Insights and Forecast - by Type of Sensor
- 9. Latin America MEMS for the Mobile Devices Industry Analysis, Insights and Forecast, 2020-2032
- 9.1. Market Analysis, Insights and Forecast - by Type of Sensor
- 9.1.1. Fingerprint Sensor
- 9.1.2. Accelerometer Sensor
- 9.1.3. Gyroscope
- 9.1.4. Pressure Sensor
- 9.1.5. BAW Sensor
- 9.1.6. Microphones
- 9.1.7. Other Types of Sensors
- 9.1. Market Analysis, Insights and Forecast - by Type of Sensor
- 10. Middle East and Africa MEMS for the Mobile Devices Industry Analysis, Insights and Forecast, 2020-2032
- 10.1. Market Analysis, Insights and Forecast - by Type of Sensor
- 10.1.1. Fingerprint Sensor
- 10.1.2. Accelerometer Sensor
- 10.1.3. Gyroscope
- 10.1.4. Pressure Sensor
- 10.1.5. BAW Sensor
- 10.1.6. Microphones
- 10.1.7. Other Types of Sensors
- 10.1. Market Analysis, Insights and Forecast - by Type of Sensor
- 11. Competitive Analysis
- 11.1. Global Market Share Analysis 2025
- 11.2. Company Profiles
- 11.2.1 Knowles Corporation
- 11.2.1.1. Overview
- 11.2.1.2. Products
- 11.2.1.3. SWOT Analysis
- 11.2.1.4. Recent Developments
- 11.2.1.5. Financials (Based on Availability)
- 11.2.2 AAC Technologies
- 11.2.2.1. Overview
- 11.2.2.2. Products
- 11.2.2.3. SWOT Analysis
- 11.2.2.4. Recent Developments
- 11.2.2.5. Financials (Based on Availability)
- 11.2.3 InvenSense Inc (TDK)
- 11.2.3.1. Overview
- 11.2.3.2. Products
- 11.2.3.3. SWOT Analysis
- 11.2.3.4. Recent Developments
- 11.2.3.5. Financials (Based on Availability)
- 11.2.4 MEMSIC Inc
- 11.2.4.1. Overview
- 11.2.4.2. Products
- 11.2.4.3. SWOT Analysis
- 11.2.4.4. Recent Developments
- 11.2.4.5. Financials (Based on Availability)
- 11.2.5 Goertek Inc
- 11.2.5.1. Overview
- 11.2.5.2. Products
- 11.2.5.3. SWOT Analysis
- 11.2.5.4. Recent Developments
- 11.2.5.5. Financials (Based on Availability)
- 11.2.6 Bosch Sensortec GmbH
- 11.2.6.1. Overview
- 11.2.6.2. Products
- 11.2.6.3. SWOT Analysis
- 11.2.6.4. Recent Developments
- 11.2.6.5. Financials (Based on Availability)
- 11.2.7 Murata Manufacturing
- 11.2.7.1. Overview
- 11.2.7.2. Products
- 11.2.7.3. SWOT Analysis
- 11.2.7.4. Recent Developments
- 11.2.7.5. Financials (Based on Availability)
- 11.2.8 STMicroelectronics NV
- 11.2.8.1. Overview
- 11.2.8.2. Products
- 11.2.8.3. SWOT Analysis
- 11.2.8.4. Recent Developments
- 11.2.8.5. Financials (Based on Availability)
- 11.2.9 Analog Devices Inc
- 11.2.9.1. Overview
- 11.2.9.2. Products
- 11.2.9.3. SWOT Analysis
- 11.2.9.4. Recent Developments
- 11.2.9.5. Financials (Based on Availability)
- 11.2.10 BSE Co Ltd
- 11.2.10.1. Overview
- 11.2.10.2. Products
- 11.2.10.3. SWOT Analysis
- 11.2.10.4. Recent Developments
- 11.2.10.5. Financials (Based on Availability)
- 11.2.1 Knowles Corporation
List of Figures
- Figure 1: Global MEMS for the Mobile Devices Industry Revenue Breakdown (Million, %) by Region 2025 & 2033
- Figure 2: Global MEMS for the Mobile Devices Industry Volume Breakdown (K Unit, %) by Region 2025 & 2033
- Figure 3: North America MEMS for the Mobile Devices Industry Revenue (Million), by Type of Sensor 2025 & 2033
- Figure 4: North America MEMS for the Mobile Devices Industry Volume (K Unit), by Type of Sensor 2025 & 2033
- Figure 5: North America MEMS for the Mobile Devices Industry Revenue Share (%), by Type of Sensor 2025 & 2033
- Figure 6: North America MEMS for the Mobile Devices Industry Volume Share (%), by Type of Sensor 2025 & 2033
- Figure 7: North America MEMS for the Mobile Devices Industry Revenue (Million), by Country 2025 & 2033
- Figure 8: North America MEMS for the Mobile Devices Industry Volume (K Unit), by Country 2025 & 2033
- Figure 9: North America MEMS for the Mobile Devices Industry Revenue Share (%), by Country 2025 & 2033
- Figure 10: North America MEMS for the Mobile Devices Industry Volume Share (%), by Country 2025 & 2033
- Figure 11: Europe MEMS for the Mobile Devices Industry Revenue (Million), by Type of Sensor 2025 & 2033
- Figure 12: Europe MEMS for the Mobile Devices Industry Volume (K Unit), by Type of Sensor 2025 & 2033
- Figure 13: Europe MEMS for the Mobile Devices Industry Revenue Share (%), by Type of Sensor 2025 & 2033
- Figure 14: Europe MEMS for the Mobile Devices Industry Volume Share (%), by Type of Sensor 2025 & 2033
- Figure 15: Europe MEMS for the Mobile Devices Industry Revenue (Million), by Country 2025 & 2033
- Figure 16: Europe MEMS for the Mobile Devices Industry Volume (K Unit), by Country 2025 & 2033
- Figure 17: Europe MEMS for the Mobile Devices Industry Revenue Share (%), by Country 2025 & 2033
- Figure 18: Europe MEMS for the Mobile Devices Industry Volume Share (%), by Country 2025 & 2033
- Figure 19: Asia Pacific MEMS for the Mobile Devices Industry Revenue (Million), by Type of Sensor 2025 & 2033
- Figure 20: Asia Pacific MEMS for the Mobile Devices Industry Volume (K Unit), by Type of Sensor 2025 & 2033
- Figure 21: Asia Pacific MEMS for the Mobile Devices Industry Revenue Share (%), by Type of Sensor 2025 & 2033
- Figure 22: Asia Pacific MEMS for the Mobile Devices Industry Volume Share (%), by Type of Sensor 2025 & 2033
- Figure 23: Asia Pacific MEMS for the Mobile Devices Industry Revenue (Million), by Country 2025 & 2033
- Figure 24: Asia Pacific MEMS for the Mobile Devices Industry Volume (K Unit), by Country 2025 & 2033
- Figure 25: Asia Pacific MEMS for the Mobile Devices Industry Revenue Share (%), by Country 2025 & 2033
- Figure 26: Asia Pacific MEMS for the Mobile Devices Industry Volume Share (%), by Country 2025 & 2033
- Figure 27: Latin America MEMS for the Mobile Devices Industry Revenue (Million), by Type of Sensor 2025 & 2033
- Figure 28: Latin America MEMS for the Mobile Devices Industry Volume (K Unit), by Type of Sensor 2025 & 2033
- Figure 29: Latin America MEMS for the Mobile Devices Industry Revenue Share (%), by Type of Sensor 2025 & 2033
- Figure 30: Latin America MEMS for the Mobile Devices Industry Volume Share (%), by Type of Sensor 2025 & 2033
- Figure 31: Latin America MEMS for the Mobile Devices Industry Revenue (Million), by Country 2025 & 2033
- Figure 32: Latin America MEMS for the Mobile Devices Industry Volume (K Unit), by Country 2025 & 2033
- Figure 33: Latin America MEMS for the Mobile Devices Industry Revenue Share (%), by Country 2025 & 2033
- Figure 34: Latin America MEMS for the Mobile Devices Industry Volume Share (%), by Country 2025 & 2033
- Figure 35: Middle East and Africa MEMS for the Mobile Devices Industry Revenue (Million), by Type of Sensor 2025 & 2033
- Figure 36: Middle East and Africa MEMS for the Mobile Devices Industry Volume (K Unit), by Type of Sensor 2025 & 2033
- Figure 37: Middle East and Africa MEMS for the Mobile Devices Industry Revenue Share (%), by Type of Sensor 2025 & 2033
- Figure 38: Middle East and Africa MEMS for the Mobile Devices Industry Volume Share (%), by Type of Sensor 2025 & 2033
- Figure 39: Middle East and Africa MEMS for the Mobile Devices Industry Revenue (Million), by Country 2025 & 2033
- Figure 40: Middle East and Africa MEMS for the Mobile Devices Industry Volume (K Unit), by Country 2025 & 2033
- Figure 41: Middle East and Africa MEMS for the Mobile Devices Industry Revenue Share (%), by Country 2025 & 2033
- Figure 42: Middle East and Africa MEMS for the Mobile Devices Industry Volume Share (%), by Country 2025 & 2033
List of Tables
- Table 1: Global MEMS for the Mobile Devices Industry Revenue Million Forecast, by Type of Sensor 2020 & 2033
- Table 2: Global MEMS for the Mobile Devices Industry Volume K Unit Forecast, by Type of Sensor 2020 & 2033
- Table 3: Global MEMS for the Mobile Devices Industry Revenue Million Forecast, by Region 2020 & 2033
- Table 4: Global MEMS for the Mobile Devices Industry Volume K Unit Forecast, by Region 2020 & 2033
- Table 5: Global MEMS for the Mobile Devices Industry Revenue Million Forecast, by Type of Sensor 2020 & 2033
- Table 6: Global MEMS for the Mobile Devices Industry Volume K Unit Forecast, by Type of Sensor 2020 & 2033
- Table 7: Global MEMS for the Mobile Devices Industry Revenue Million Forecast, by Country 2020 & 2033
- Table 8: Global MEMS for the Mobile Devices Industry Volume K Unit Forecast, by Country 2020 & 2033
- Table 9: Global MEMS for the Mobile Devices Industry Revenue Million Forecast, by Type of Sensor 2020 & 2033
- Table 10: Global MEMS for the Mobile Devices Industry Volume K Unit Forecast, by Type of Sensor 2020 & 2033
- Table 11: Global MEMS for the Mobile Devices Industry Revenue Million Forecast, by Country 2020 & 2033
- Table 12: Global MEMS for the Mobile Devices Industry Volume K Unit Forecast, by Country 2020 & 2033
- Table 13: Global MEMS for the Mobile Devices Industry Revenue Million Forecast, by Type of Sensor 2020 & 2033
- Table 14: Global MEMS for the Mobile Devices Industry Volume K Unit Forecast, by Type of Sensor 2020 & 2033
- Table 15: Global MEMS for the Mobile Devices Industry Revenue Million Forecast, by Country 2020 & 2033
- Table 16: Global MEMS for the Mobile Devices Industry Volume K Unit Forecast, by Country 2020 & 2033
- Table 17: Global MEMS for the Mobile Devices Industry Revenue Million Forecast, by Type of Sensor 2020 & 2033
- Table 18: Global MEMS for the Mobile Devices Industry Volume K Unit Forecast, by Type of Sensor 2020 & 2033
- Table 19: Global MEMS for the Mobile Devices Industry Revenue Million Forecast, by Country 2020 & 2033
- Table 20: Global MEMS for the Mobile Devices Industry Volume K Unit Forecast, by Country 2020 & 2033
- Table 21: Global MEMS for the Mobile Devices Industry Revenue Million Forecast, by Type of Sensor 2020 & 2033
- Table 22: Global MEMS for the Mobile Devices Industry Volume K Unit Forecast, by Type of Sensor 2020 & 2033
- Table 23: Global MEMS for the Mobile Devices Industry Revenue Million Forecast, by Country 2020 & 2033
- Table 24: Global MEMS for the Mobile Devices Industry Volume K Unit Forecast, by Country 2020 & 2033
Frequently Asked Questions
1. What is the projected Compound Annual Growth Rate (CAGR) of the MEMS for the Mobile Devices Industry?
The projected CAGR is approximately 8.80%.
2. Which companies are prominent players in the MEMS for the Mobile Devices Industry?
Key companies in the market include Knowles Corporation, AAC Technologies, InvenSense Inc (TDK), MEMSIC Inc, Goertek Inc, Bosch Sensortec GmbH, Murata Manufacturing, STMicroelectronics NV, Analog Devices Inc, BSE Co Ltd.
3. What are the main segments of the MEMS for the Mobile Devices Industry?
The market segments include Type of Sensor.
4. Can you provide details about the market size?
The market size is estimated to be USD 9.38 Million as of 2022.
5. What are some drivers contributing to market growth?
Increasing Acceptance of Miniaturization Trend; Increasing Demand for High-Performance Devices.
6. What are the notable trends driving market growth?
Increasing Acceptance of Miniaturization Trend to Drive the Market.
7. Are there any restraints impacting market growth?
Highly Complex Manufacturing Process and Demanding Cycle Time; Lack of Standardized Fabrication Process.
8. Can you provide examples of recent developments in the market?
December 2022: Knowles introduced new balanced armatures and MEMS microphones for over-the-counter hearing aids. The new product released provides performance and design flexibility to help speed up the production of hearing health products. Three full-range balanced armature receivers and two updated MEMS microphones will meet the stringent design and acoustic performance requirements of hearing aids.
9. What pricing options are available for accessing the report?
Pricing options include single-user, multi-user, and enterprise licenses priced at USD 4750, USD 5250, and USD 8750 respectively.
10. Is the market size provided in terms of value or volume?
The market size is provided in terms of value, measured in Million and volume, measured in K Unit.
11. Are there any specific market keywords associated with the report?
Yes, the market keyword associated with the report is "MEMS for the Mobile Devices Industry," which aids in identifying and referencing the specific market segment covered.
12. How do I determine which pricing option suits my needs best?
The pricing options vary based on user requirements and access needs. Individual users may opt for single-user licenses, while businesses requiring broader access may choose multi-user or enterprise licenses for cost-effective access to the report.
13. Are there any additional resources or data provided in the MEMS for the Mobile Devices Industry report?
While the report offers comprehensive insights, it's advisable to review the specific contents or supplementary materials provided to ascertain if additional resources or data are available.
14. How can I stay updated on further developments or reports in the MEMS for the Mobile Devices Industry?
To stay informed about further developments, trends, and reports in the MEMS for the Mobile Devices Industry, consider subscribing to industry newsletters, following relevant companies and organizations, or regularly checking reputable industry news sources and publications.
Methodology
Step 1 - Identification of Relevant Samples Size from Population Database


Step 2 - Approaches for Defining Global Market Size (Value, Volume* & Price*)

Note*: In applicable scenarios
Step 3 - Data Sources
Primary Research
- Web Analytics
- Survey Reports
- Research Institute
- Latest Research Reports
- Opinion Leaders
Secondary Research
- Annual Reports
- White Paper
- Latest Press Release
- Industry Association
- Paid Database
- Investor Presentations

Step 4 - Data Triangulation
Involves using different sources of information in order to increase the validity of a study
These sources are likely to be stakeholders in a program - participants, other researchers, program staff, other community members, and so on.
Then we put all data in single framework & apply various statistical tools to find out the dynamic on the market.
During the analysis stage, feedback from the stakeholder groups would be compared to determine areas of agreement as well as areas of divergence