

Key Insights
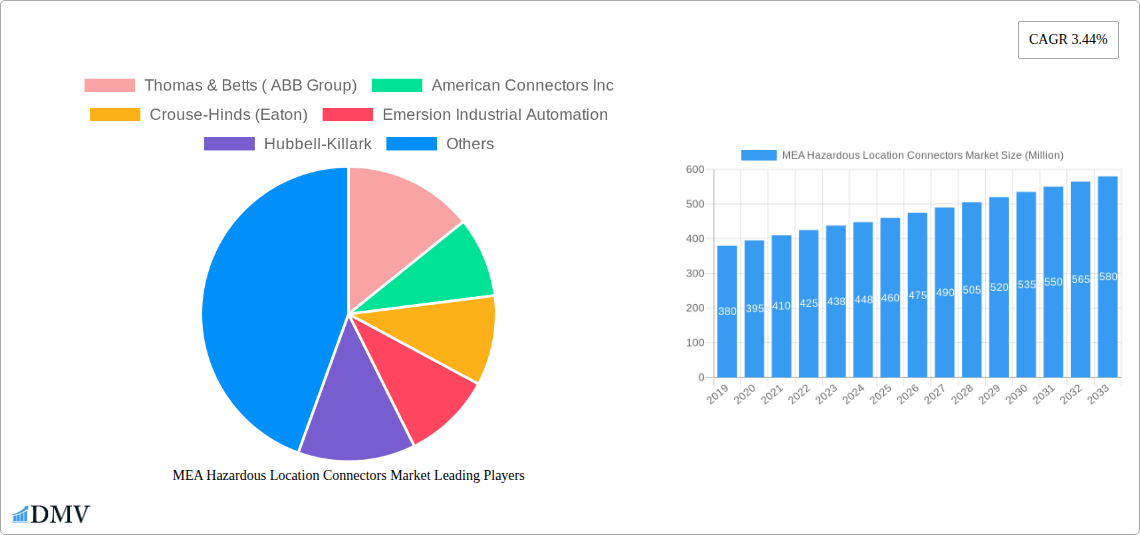
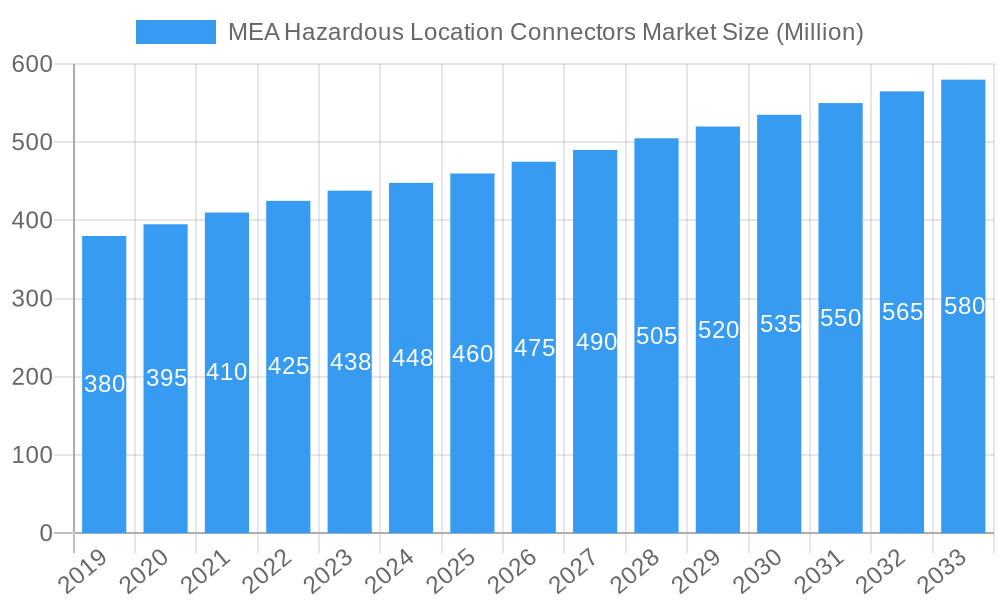
The MEA Hazardous Location Connectors Market is projected to witness robust growth, reaching an estimated market size of approximately USD 450 million by 2025 and expanding at a Compound Annual Growth Rate (CAGR) of 3.44% through 2033. This expansion is primarily fueled by the escalating demand for safe and reliable electrical connections in industries operating in volatile environments. Key drivers include the continuous development and expansion of oil and gas exploration and production activities across the Middle East and Africa, necessitating robust solutions for Zone 0, Zone 1, and Zone 2 hazardous areas. Furthermore, the increasing investment in infrastructure development, particularly in the petrochemical and wastewater treatment sectors, is creating a significant demand for specialized connectors that can withstand extreme conditions and prevent ignition sources. Regulatory mandates and a heightened focus on industrial safety standards are also compelling businesses to adopt advanced hazardous location connectors, thereby underpinning market growth.
MEA Hazardous Location Connectors Market Market Size (In Million)
Emerging trends in the MEA Hazardous Location Connectors Market point towards innovation in material science and design, with a growing emphasis on compact, lightweight, and corrosion-resistant connectors. The integration of smart technologies, offering enhanced monitoring and diagnostic capabilities, is also gaining traction, particularly in remote and challenging operational sites. While the market presents significant opportunities, certain restraints may influence its trajectory. These include the high cost of specialized connectors, potential supply chain disruptions, and the varying levels of regulatory enforcement across different regions within MEA. Nevertheless, the persistent need for operational integrity and safety in sectors like Food & Beverage Processing, Pharmaceutical Manufacturing, and Oil & Gas Production, coupled with ongoing technological advancements, is expected to drive sustained market expansion. The market segmentation by class (Class I, Class II, Class III) and hazardous zones highlights the diverse requirements and specialized nature of these connectors, catering to a wide spectrum of industrial applications.
MEA Hazardous Location Connectors Market Company Market Share
This in-depth report offers a granular analysis of the MEA Hazardous Location Connectors Market, providing stakeholders with critical insights into market dynamics, growth drivers, and future trajectories. Spanning the Study Period of 2019–2033, with a Base Year of 2025 and an extensive Forecast Period of 2025–2033, this report leverages Historical Period data from 2019–2024 to construct a robust market outlook. Discover key trends in Class I, Class II, and Class III connectors, understand the impact of Zone 0, Zone 1, and Zone 2 hazardous areas, and explore critical applications across Food & Beverage Processing, Oil & Gas Production, Oil Refineries, Petrochemical Refineries, Pharmaceutical Manufacturing, Wastewater Treatment Facilities, and more. Our analysis delves into the competitive landscape, technological innovations, and regulatory frameworks shaping this vital industry.
MEA Hazardous Location Connectors Market Market Composition & Trends
The MEA Hazardous Location Connectors Market exhibits a moderate to high concentration, driven by a few dominant players and a growing number of specialized manufacturers. Innovation is primarily catalyzed by the stringent safety regulations and the increasing demand for robust, reliable connectivity solutions in hazardous environments across the Middle East and Africa. The regulatory landscape, characterized by evolving international and regional standards for explosion protection, plays a crucial role in shaping product development and market entry strategies. Substitute products, such as intrinsically safe equipment and specialized cabling, present a competitive challenge, though hazardous location connectors remain indispensable for direct power and signal transmission. End-user profiles are diverse, ranging from large-scale industrial conglomerates in the oil and gas sector to specialized pharmaceutical and food processing facilities. Merger and acquisition (M&A) activities are expected to continue, driven by the desire to expand product portfolios, geographical reach, and technological capabilities. For instance, estimated M&A deal values in recent years have ranged from xx Million to xx Million, signaling consolidation and strategic growth. Market share distribution is influenced by a company's ability to offer certified, high-performance, and cost-effective solutions tailored to specific hazardous area classifications and environmental conditions.
MEA Hazardous Location Connectors Market Industry Evolution
The MEA Hazardous Location Connectors Market has undergone significant evolution, characterized by consistent growth fueled by industrial expansion and a heightened focus on operational safety. Throughout the historical period (2019–2024), the market witnessed a steady upward trajectory, with a Compound Annual Growth Rate (CAGR) of approximately xx% driven by increased investments in critical infrastructure projects and the stringent enforcement of safety standards across the region. The estimated year of 2025 projects a market value of approximately XXX Million, underscoring its substantial economic importance. Looking ahead, the forecast period (2025–2033) is anticipated to see a robust CAGR of xx%, propelled by several key factors. Technological advancements have been central to this evolution, with manufacturers increasingly focusing on developing connectors that offer enhanced protection against explosions, corrosion, and extreme temperatures. Innovations in materials science and manufacturing processes have led to lighter, more durable, and easier-to-install connectors. Shifting consumer demands are also playing a pivotal role. End-users are increasingly prioritizing connectors with superior sealing capabilities, wider operating temperature ranges, and improved electrical performance to minimize downtime and ensure personnel safety. The adoption of advanced connectivity technologies, such as those supporting higher data transfer rates and wireless communication in hazardous zones, is also on the rise. Furthermore, the growing emphasis on predictive maintenance and the Industrial Internet of Things (IIoT) is driving the demand for smart connectors that can transmit real-time operational data, further contributing to the industry's evolution. The proactive approach to safety regulations across many MEA countries is a significant impetus for the continuous upgrade and adoption of advanced hazardous location connector solutions.
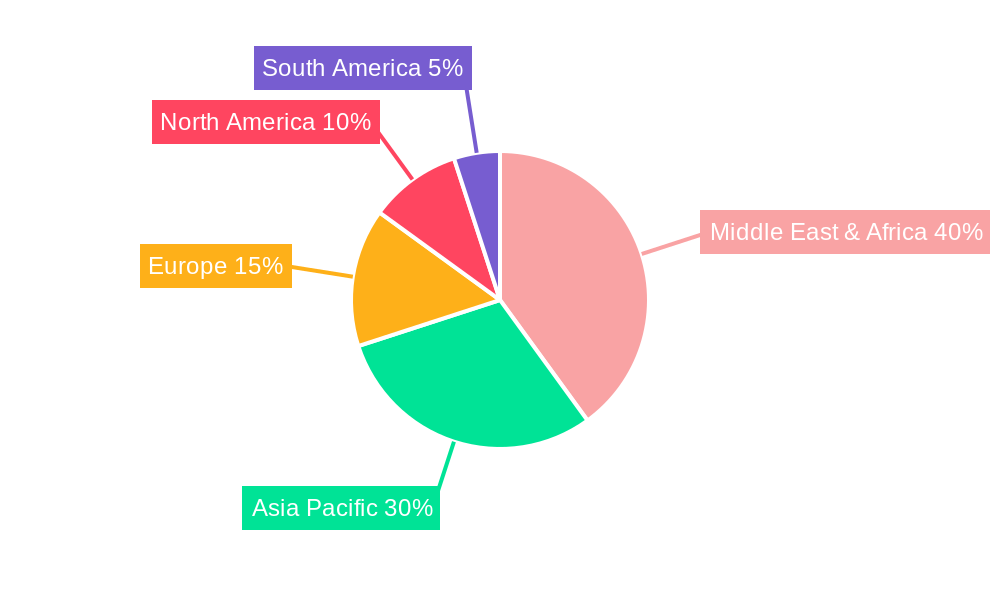
Leading Regions, Countries, or Segments in MEA Hazardous Location Connectors Market
Within the MEA region, the Oil & Gas Production and Oil Refineries sectors stand out as dominant drivers for the hazardous location connectors market, particularly within Class I and Class II classifications and Zone 1 and Zone 2 hazardous areas. This dominance is underpinned by substantial ongoing investments in exploration, extraction, and processing infrastructure across countries like Saudi Arabia, UAE, and Qatar.
- Key Drivers for Dominance in Oil & Gas:
- Massive Infrastructure Development: Continuous expansion and upgrades of offshore platforms, onshore facilities, and pipelines necessitate a constant supply of high-reliability hazardous location connectors.
- Stringent Safety Regulations: The inherent risks associated with handling volatile substances mandate adherence to the highest safety standards, making certified connectors indispensable.
- Harsh Environmental Conditions: Connectors must withstand extreme temperatures, corrosive elements, and potential for ignition, driving demand for robust Class I and Class II solutions.
- Technological Advancements: The integration of digital technologies and IIoT in oil and gas operations requires connectors capable of supporting data transmission in hazardous environments.
The Petrochemical Refineries segment also represents a significant demand center, driven by the large-scale processing of crude oil and natural gas into various chemical products. These facilities operate under highly controlled but inherently hazardous conditions, requiring explosion-proof connectors to ensure operational integrity and personnel safety.
The Class I classification, pertaining to areas where flammable gases or vapors may be present, and Class II classification, for areas with combustible dust, are the most prominent in this market due to the nature of operations in the oil, gas, and petrochemical industries. Similarly, Zone 1 (requiring equipment designed to not cause an explosion under normal operating conditions) and Zone 2 (requiring equipment designed to not cause an explosion under abnormal operating conditions) are the most prevalent hazardous zones targeted by connector manufacturers in these sectors.
While Food & Beverage Processing and Pharmaceutical Manufacturing also represent growing applications, their demand for hazardous location connectors, though increasing due to evolving regulations and automation, is still comparatively smaller than the energy sector in the MEA region. Wastewater Treatment Facilities also contribute to the demand, particularly for connectors used in potentially explosive atmospheres due to the presence of biogas. However, the sheer scale and continuous investment in the oil and gas sector solidify its position as the leading segment in the MEA Hazardous Location Connectors Market.
MEA Hazardous Location Connectors Market Product Innovations
Product innovation in the MEA Hazardous Location Connectors Market is driven by the relentless pursuit of enhanced safety, reliability, and operational efficiency. Manufacturers are continuously developing connectors with improved ingress protection (IP) ratings, ensuring superior resistance to dust and water ingress, critical for harsh industrial environments. Advancements in material science have led to the introduction of lightweight yet extremely robust connector housings, offering superior corrosion resistance. Furthermore, the integration of advanced sealing technologies and explosion-proof designs are key selling propositions, ensuring compliance with stringent ATEX and IECEx certifications. These innovations aim to simplify installation, reduce maintenance needs, and extend the operational lifespan of critical electrical connections in hazardous zones across diverse applications like oil and gas, petrochemicals, and pharmaceuticals.
Propelling Factors for MEA Hazardous Location Connectors Market Growth
The MEA Hazardous Location Connectors Market is propelled by several powerful factors. Foremost is the robust growth of the oil and gas industry in the region, with ongoing exploration, production, and refining activities demanding highly specialized and certified connectivity solutions. Stringent safety regulations and compliance requirements, such as ATEX and IECEx, are mandating the use of explosion-proof and intrinsically safe connectors, thereby driving market demand. Technological advancements in connector design, including enhanced ingress protection, material durability, and ease of installation, cater to the need for reliable performance in extreme environments. Furthermore, the increasing adoption of automation and IIoT in industrial sectors necessitates connectors that can support data transmission in hazardous locations, leading to higher value and more sophisticated product offerings.
Obstacles in the MEA Hazardous Location Connectors Market Market
Despite robust growth, the MEA Hazardous Location Connectors Market faces several obstacles. Stringent and evolving regulatory landscapes, while driving demand, can also present significant compliance challenges and increase the cost of product development and certification for manufacturers. Supply chain disruptions, exacerbated by global events and logistical complexities within the MEA region, can lead to delays and increased costs for raw materials and finished goods, impacting delivery timelines and profitability. Intense competitive pressures from established global players and emerging regional manufacturers can lead to price erosion and reduced profit margins. Furthermore, the significant upfront investment required for research, development, and certification of hazardous location connectors can be a barrier to entry for smaller companies.
Future Opportunities in MEA Hazardous Location Connectors Market
Emerging opportunities in the MEA Hazardous Location Connectors Market are abundant. The growing focus on renewable energy projects, such as solar and wind farms, in the region will create new demand for specialized hazardous location connectors for associated substations and control systems. The increasing adoption of digitalization and IIoT across various industries will drive demand for smart connectors capable of real-time data monitoring and transmission in hazardous zones. Expansion into underserved sub-regions within Africa with developing industrial sectors presents significant untapped market potential. Furthermore, the development of more cost-effective and modular connector solutions could open up new application areas and cater to a broader range of end-users with varying budget constraints.
Major Players in the MEA Hazardous Location Connectors Market Ecosystem
- Thomas & Betts ( ABB Group)
- American Connectors Inc
- Crouse-Hinds (Eaton)
- Emerson Industrial Automation
- Hubbell-Killark
- Vantage Technology
- Amphenol Industrial Products Group
- ITT BIW Connector Systems
Key Developments in MEA Hazardous Location Connectors Market Industry
- April 2022 - Emerson has expanded its ASCO series 090 lines of miniature solenoid valves, adding a new three-way series 090 valve configuration to enable more space-efficient and lighter solutions for gas control in oxygen therapy and compression therapy, and gas analyzer devices. This development indirectly influences the demand for compatible hazardous location connectors in these critical healthcare and analytical applications.
- November 2021 - Emerson introduced two new open path gas detectors, which will increase safety and reduce downtime by offering performance reliability over vast areas in extreme environments and an easier and faster installation. These new gas detectors will protect workers and property with hazard warnings in harsh environments. This innovation underscores the trend towards comprehensive safety solutions, requiring robust and reliable connectivity for monitoring and control systems within hazardous locations.
Strategic MEA Hazardous Location Connectors Market Market Forecast
The MEA Hazardous Location Connectors Market is poised for sustained growth, driven by increasing industrialization, stringent safety mandates, and technological advancements. The forecast period (2025–2033) is expected to witness a significant expansion, fueled by ongoing investments in the vital oil, gas, and petrochemical sectors, which consistently require high-performance, certified connectivity solutions. Emerging opportunities in renewable energy infrastructure and the widespread adoption of IIoT will further diversify demand and create new avenues for growth. Innovations focused on enhanced safety features, improved durability, and easier installation will be key differentiators, allowing manufacturers to capture a larger market share. The strategic importance of reliable and safe electrical connections in hazardous environments across the MEA region solidifies the optimistic outlook for this market.
MEA Hazardous Location Connectors Market Segmentation
-
1. Class
- 1.1. Class I
- 1.2. Class II
- 1.3. Class III
-
2. Hazardous Zones
- 2.1. Zone 0
- 2.2. Zone 1
- 2.3. Zone 2
-
3. Applications
- 3.1. Food & Beverage Processing
- 3.2. Oil & Gas Production
- 3.3. Oil Refineries
- 3.4. Petrochemical Refineries
- 3.5. Pharmaceutical Manufacturing
- 3.6. Wastewater Treatment Facilities
- 3.7. Other Applications
MEA Hazardous Location Connectors Market Segmentation By Geography
-
1. North America
- 1.1. United States
- 1.2. Canada
- 1.3. Mexico
-
2. South America
- 2.1. Brazil
- 2.2. Argentina
- 2.3. Rest of South America
-
3. Europe
- 3.1. United Kingdom
- 3.2. Germany
- 3.3. France
- 3.4. Italy
- 3.5. Spain
- 3.6. Russia
- 3.7. Benelux
- 3.8. Nordics
- 3.9. Rest of Europe
-
4. Middle East & Africa
- 4.1. Turkey
- 4.2. Israel
- 4.3. GCC
- 4.4. North Africa
- 4.5. South Africa
- 4.6. Rest of Middle East & Africa
-
5. Asia Pacific
- 5.1. China
- 5.2. India
- 5.3. Japan
- 5.4. South Korea
- 5.5. ASEAN
- 5.6. Oceania
- 5.7. Rest of Asia Pacific
MEA Hazardous Location Connectors Market Regional Market Share
Geographic Coverage of MEA Hazardous Location Connectors Market
MEA Hazardous Location Connectors Market REPORT HIGHLIGHTS
| Aspects | Details |
|---|---|
| Study Period | 2020-2034 |
| Base Year | 2025 |
| Estimated Year | 2026 |
| Forecast Period | 2026-2034 |
| Historical Period | 2020-2025 |
| Growth Rate | CAGR of 6.2% from 2020-2034 |
| Segmentation |
|
Table of Contents
- 1. Introduction
- 1.1. Research Scope
- 1.2. Market Segmentation
- 1.3. Research Objective
- 1.4. Definitions and Assumptions
- 2. Executive Summary
- 2.1. Market Snapshot
- 3. Market Dynamics
- 3.1. Market Drivers
- 3.2. Market Restrains
- 3.3. Market Trends
- 3.4. Market Opportunities
- 4. Market Factor Analysis
- 4.1. Porters Five Forces
- 4.1.1. Bargaining Power of Suppliers
- 4.1.2. Bargaining Power of Buyers
- 4.1.3. Threat of New Entrants
- 4.1.4. Threat of Substitutes
- 4.1.5. Competitive Rivalry
- 4.2. PESTEL analysis
- 4.3. BCG Analysis
- 4.3.1. Stars (High Growth, High Market Share)
- 4.3.2. Cash Cows (Low Growth, High Market Share)
- 4.3.3. Question Mark (High Growth, Low Market Share)
- 4.3.4. Dogs (Low Growth, Low Market Share)
- 4.4. Ansoff Matrix Analysis
- 4.5. Supply Chain Analysis
- 4.6. Regulatory Landscape
- 4.7. Current Market Potential and Opportunity Assessment (TAM–SAM–SOM Framework)
- 4.8. DMV Analyst Note
- 4.1. Porters Five Forces
- 5. Market Analysis, Insights and Forecast 2021-2033
- 5.1. Market Analysis, Insights and Forecast - by Class
- 5.1.1. Class I
- 5.1.2. Class II
- 5.1.3. Class III
- 5.2. Market Analysis, Insights and Forecast - by Hazardous Zones
- 5.2.1. Zone 0
- 5.2.2. Zone 1
- 5.2.3. Zone 2
- 5.3. Market Analysis, Insights and Forecast - by Applications
- 5.3.1. Food & Beverage Processing
- 5.3.2. Oil & Gas Production
- 5.3.3. Oil Refineries
- 5.3.4. Petrochemical Refineries
- 5.3.5. Pharmaceutical Manufacturing
- 5.3.6. Wastewater Treatment Facilities
- 5.3.7. Other Applications
- 5.4. Market Analysis, Insights and Forecast - by Region
- 5.4.1. North America
- 5.4.2. South America
- 5.4.3. Europe
- 5.4.4. Middle East & Africa
- 5.4.5. Asia Pacific
- 5.1. Market Analysis, Insights and Forecast - by Class
- 6. Global MEA Hazardous Location Connectors Market Analysis, Insights and Forecast, 2021-2033
- 6.1. Market Analysis, Insights and Forecast - by Class
- 6.1.1. Class I
- 6.1.2. Class II
- 6.1.3. Class III
- 6.2. Market Analysis, Insights and Forecast - by Hazardous Zones
- 6.2.1. Zone 0
- 6.2.2. Zone 1
- 6.2.3. Zone 2
- 6.3. Market Analysis, Insights and Forecast - by Applications
- 6.3.1. Food & Beverage Processing
- 6.3.2. Oil & Gas Production
- 6.3.3. Oil Refineries
- 6.3.4. Petrochemical Refineries
- 6.3.5. Pharmaceutical Manufacturing
- 6.3.6. Wastewater Treatment Facilities
- 6.3.7. Other Applications
- 6.1. Market Analysis, Insights and Forecast - by Class
- 7. North America MEA Hazardous Location Connectors Market Analysis, Insights and Forecast, 2020-2032
- 7.1. Market Analysis, Insights and Forecast - by Class
- 7.1.1. Class I
- 7.1.2. Class II
- 7.1.3. Class III
- 7.2. Market Analysis, Insights and Forecast - by Hazardous Zones
- 7.2.1. Zone 0
- 7.2.2. Zone 1
- 7.2.3. Zone 2
- 7.3. Market Analysis, Insights and Forecast - by Applications
- 7.3.1. Food & Beverage Processing
- 7.3.2. Oil & Gas Production
- 7.3.3. Oil Refineries
- 7.3.4. Petrochemical Refineries
- 7.3.5. Pharmaceutical Manufacturing
- 7.3.6. Wastewater Treatment Facilities
- 7.3.7. Other Applications
- 7.1. Market Analysis, Insights and Forecast - by Class
- 8. South America MEA Hazardous Location Connectors Market Analysis, Insights and Forecast, 2020-2032
- 8.1. Market Analysis, Insights and Forecast - by Class
- 8.1.1. Class I
- 8.1.2. Class II
- 8.1.3. Class III
- 8.2. Market Analysis, Insights and Forecast - by Hazardous Zones
- 8.2.1. Zone 0
- 8.2.2. Zone 1
- 8.2.3. Zone 2
- 8.3. Market Analysis, Insights and Forecast - by Applications
- 8.3.1. Food & Beverage Processing
- 8.3.2. Oil & Gas Production
- 8.3.3. Oil Refineries
- 8.3.4. Petrochemical Refineries
- 8.3.5. Pharmaceutical Manufacturing
- 8.3.6. Wastewater Treatment Facilities
- 8.3.7. Other Applications
- 8.1. Market Analysis, Insights and Forecast - by Class
- 9. Europe MEA Hazardous Location Connectors Market Analysis, Insights and Forecast, 2020-2032
- 9.1. Market Analysis, Insights and Forecast - by Class
- 9.1.1. Class I
- 9.1.2. Class II
- 9.1.3. Class III
- 9.2. Market Analysis, Insights and Forecast - by Hazardous Zones
- 9.2.1. Zone 0
- 9.2.2. Zone 1
- 9.2.3. Zone 2
- 9.3. Market Analysis, Insights and Forecast - by Applications
- 9.3.1. Food & Beverage Processing
- 9.3.2. Oil & Gas Production
- 9.3.3. Oil Refineries
- 9.3.4. Petrochemical Refineries
- 9.3.5. Pharmaceutical Manufacturing
- 9.3.6. Wastewater Treatment Facilities
- 9.3.7. Other Applications
- 9.1. Market Analysis, Insights and Forecast - by Class
- 10. Middle East & Africa MEA Hazardous Location Connectors Market Analysis, Insights and Forecast, 2020-2032
- 10.1. Market Analysis, Insights and Forecast - by Class
- 10.1.1. Class I
- 10.1.2. Class II
- 10.1.3. Class III
- 10.2. Market Analysis, Insights and Forecast - by Hazardous Zones
- 10.2.1. Zone 0
- 10.2.2. Zone 1
- 10.2.3. Zone 2
- 10.3. Market Analysis, Insights and Forecast - by Applications
- 10.3.1. Food & Beverage Processing
- 10.3.2. Oil & Gas Production
- 10.3.3. Oil Refineries
- 10.3.4. Petrochemical Refineries
- 10.3.5. Pharmaceutical Manufacturing
- 10.3.6. Wastewater Treatment Facilities
- 10.3.7. Other Applications
- 10.1. Market Analysis, Insights and Forecast - by Class
- 11. Asia Pacific MEA Hazardous Location Connectors Market Analysis, Insights and Forecast, 2020-2032
- 11.1. Market Analysis, Insights and Forecast - by Class
- 11.1.1. Class I
- 11.1.2. Class II
- 11.1.3. Class III
- 11.2. Market Analysis, Insights and Forecast - by Hazardous Zones
- 11.2.1. Zone 0
- 11.2.2. Zone 1
- 11.2.3. Zone 2
- 11.3. Market Analysis, Insights and Forecast - by Applications
- 11.3.1. Food & Beverage Processing
- 11.3.2. Oil & Gas Production
- 11.3.3. Oil Refineries
- 11.3.4. Petrochemical Refineries
- 11.3.5. Pharmaceutical Manufacturing
- 11.3.6. Wastewater Treatment Facilities
- 11.3.7. Other Applications
- 11.1. Market Analysis, Insights and Forecast - by Class
- 12. Competitive Analysis
- 12.1. Company Profiles
- 12.1.1 Thomas & Betts ( ABB Group)
- 12.1.1.1. Company Overview
- 12.1.1.2. Products
- 12.1.1.3. Company Financials
- 12.1.1.4. SWOT Analysis
- 12.1.2 American Connectors Inc
- 12.1.2.1. Company Overview
- 12.1.2.2. Products
- 12.1.2.3. Company Financials
- 12.1.2.4. SWOT Analysis
- 12.1.3 Crouse-Hinds (Eaton)
- 12.1.3.1. Company Overview
- 12.1.3.2. Products
- 12.1.3.3. Company Financials
- 12.1.3.4. SWOT Analysis
- 12.1.4 Emersion Industrial Automation
- 12.1.4.1. Company Overview
- 12.1.4.2. Products
- 12.1.4.3. Company Financials
- 12.1.4.4. SWOT Analysis
- 12.1.5 Hubbell-Killark
- 12.1.5.1. Company Overview
- 12.1.5.2. Products
- 12.1.5.3. Company Financials
- 12.1.5.4. SWOT Analysis
- 12.1.6 Vantage Technology
- 12.1.6.1. Company Overview
- 12.1.6.2. Products
- 12.1.6.3. Company Financials
- 12.1.6.4. SWOT Analysis
- 12.1.7 Amphenol Industrial Products Group
- 12.1.7.1. Company Overview
- 12.1.7.2. Products
- 12.1.7.3. Company Financials
- 12.1.7.4. SWOT Analysis
- 12.1.8 ITT BIW Connector Systems
- 12.1.8.1. Company Overview
- 12.1.8.2. Products
- 12.1.8.3. Company Financials
- 12.1.8.4. SWOT Analysis
- 12.1.1 Thomas & Betts ( ABB Group)
- 12.2. Market Entropy
- 12.2.1 Company's Key Areas Served
- 12.2.2 Recent Developments
- 12.3. Company Market Share Analysis 2025
- 12.3.1 Top 5 Companies Market Share Analysis
- 12.3.2 Top 3 Companies Market Share Analysis
- 12.4. List of Potential Customers
- 13. Research Methodology
List of Figures
- Figure 1: Global MEA Hazardous Location Connectors Market Revenue Breakdown (billion, %) by Region 2025 & 2033
- Figure 2: Global MEA Hazardous Location Connectors Market Volume Breakdown (K Unit, %) by Region 2025 & 2033
- Figure 3: North America MEA Hazardous Location Connectors Market Revenue (billion), by Class 2025 & 2033
- Figure 4: North America MEA Hazardous Location Connectors Market Volume (K Unit), by Class 2025 & 2033
- Figure 5: North America MEA Hazardous Location Connectors Market Revenue Share (%), by Class 2025 & 2033
- Figure 6: North America MEA Hazardous Location Connectors Market Volume Share (%), by Class 2025 & 2033
- Figure 7: North America MEA Hazardous Location Connectors Market Revenue (billion), by Hazardous Zones 2025 & 2033
- Figure 8: North America MEA Hazardous Location Connectors Market Volume (K Unit), by Hazardous Zones 2025 & 2033
- Figure 9: North America MEA Hazardous Location Connectors Market Revenue Share (%), by Hazardous Zones 2025 & 2033
- Figure 10: North America MEA Hazardous Location Connectors Market Volume Share (%), by Hazardous Zones 2025 & 2033
- Figure 11: North America MEA Hazardous Location Connectors Market Revenue (billion), by Applications 2025 & 2033
- Figure 12: North America MEA Hazardous Location Connectors Market Volume (K Unit), by Applications 2025 & 2033
- Figure 13: North America MEA Hazardous Location Connectors Market Revenue Share (%), by Applications 2025 & 2033
- Figure 14: North America MEA Hazardous Location Connectors Market Volume Share (%), by Applications 2025 & 2033
- Figure 15: North America MEA Hazardous Location Connectors Market Revenue (billion), by Country 2025 & 2033
- Figure 16: North America MEA Hazardous Location Connectors Market Volume (K Unit), by Country 2025 & 2033
- Figure 17: North America MEA Hazardous Location Connectors Market Revenue Share (%), by Country 2025 & 2033
- Figure 18: North America MEA Hazardous Location Connectors Market Volume Share (%), by Country 2025 & 2033
- Figure 19: South America MEA Hazardous Location Connectors Market Revenue (billion), by Class 2025 & 2033
- Figure 20: South America MEA Hazardous Location Connectors Market Volume (K Unit), by Class 2025 & 2033
- Figure 21: South America MEA Hazardous Location Connectors Market Revenue Share (%), by Class 2025 & 2033
- Figure 22: South America MEA Hazardous Location Connectors Market Volume Share (%), by Class 2025 & 2033
- Figure 23: South America MEA Hazardous Location Connectors Market Revenue (billion), by Hazardous Zones 2025 & 2033
- Figure 24: South America MEA Hazardous Location Connectors Market Volume (K Unit), by Hazardous Zones 2025 & 2033
- Figure 25: South America MEA Hazardous Location Connectors Market Revenue Share (%), by Hazardous Zones 2025 & 2033
- Figure 26: South America MEA Hazardous Location Connectors Market Volume Share (%), by Hazardous Zones 2025 & 2033
- Figure 27: South America MEA Hazardous Location Connectors Market Revenue (billion), by Applications 2025 & 2033
- Figure 28: South America MEA Hazardous Location Connectors Market Volume (K Unit), by Applications 2025 & 2033
- Figure 29: South America MEA Hazardous Location Connectors Market Revenue Share (%), by Applications 2025 & 2033
- Figure 30: South America MEA Hazardous Location Connectors Market Volume Share (%), by Applications 2025 & 2033
- Figure 31: South America MEA Hazardous Location Connectors Market Revenue (billion), by Country 2025 & 2033
- Figure 32: South America MEA Hazardous Location Connectors Market Volume (K Unit), by Country 2025 & 2033
- Figure 33: South America MEA Hazardous Location Connectors Market Revenue Share (%), by Country 2025 & 2033
- Figure 34: South America MEA Hazardous Location Connectors Market Volume Share (%), by Country 2025 & 2033
- Figure 35: Europe MEA Hazardous Location Connectors Market Revenue (billion), by Class 2025 & 2033
- Figure 36: Europe MEA Hazardous Location Connectors Market Volume (K Unit), by Class 2025 & 2033
- Figure 37: Europe MEA Hazardous Location Connectors Market Revenue Share (%), by Class 2025 & 2033
- Figure 38: Europe MEA Hazardous Location Connectors Market Volume Share (%), by Class 2025 & 2033
- Figure 39: Europe MEA Hazardous Location Connectors Market Revenue (billion), by Hazardous Zones 2025 & 2033
- Figure 40: Europe MEA Hazardous Location Connectors Market Volume (K Unit), by Hazardous Zones 2025 & 2033
- Figure 41: Europe MEA Hazardous Location Connectors Market Revenue Share (%), by Hazardous Zones 2025 & 2033
- Figure 42: Europe MEA Hazardous Location Connectors Market Volume Share (%), by Hazardous Zones 2025 & 2033
- Figure 43: Europe MEA Hazardous Location Connectors Market Revenue (billion), by Applications 2025 & 2033
- Figure 44: Europe MEA Hazardous Location Connectors Market Volume (K Unit), by Applications 2025 & 2033
- Figure 45: Europe MEA Hazardous Location Connectors Market Revenue Share (%), by Applications 2025 & 2033
- Figure 46: Europe MEA Hazardous Location Connectors Market Volume Share (%), by Applications 2025 & 2033
- Figure 47: Europe MEA Hazardous Location Connectors Market Revenue (billion), by Country 2025 & 2033
- Figure 48: Europe MEA Hazardous Location Connectors Market Volume (K Unit), by Country 2025 & 2033
- Figure 49: Europe MEA Hazardous Location Connectors Market Revenue Share (%), by Country 2025 & 2033
- Figure 50: Europe MEA Hazardous Location Connectors Market Volume Share (%), by Country 2025 & 2033
- Figure 51: Middle East & Africa MEA Hazardous Location Connectors Market Revenue (billion), by Class 2025 & 2033
- Figure 52: Middle East & Africa MEA Hazardous Location Connectors Market Volume (K Unit), by Class 2025 & 2033
- Figure 53: Middle East & Africa MEA Hazardous Location Connectors Market Revenue Share (%), by Class 2025 & 2033
- Figure 54: Middle East & Africa MEA Hazardous Location Connectors Market Volume Share (%), by Class 2025 & 2033
- Figure 55: Middle East & Africa MEA Hazardous Location Connectors Market Revenue (billion), by Hazardous Zones 2025 & 2033
- Figure 56: Middle East & Africa MEA Hazardous Location Connectors Market Volume (K Unit), by Hazardous Zones 2025 & 2033
- Figure 57: Middle East & Africa MEA Hazardous Location Connectors Market Revenue Share (%), by Hazardous Zones 2025 & 2033
- Figure 58: Middle East & Africa MEA Hazardous Location Connectors Market Volume Share (%), by Hazardous Zones 2025 & 2033
- Figure 59: Middle East & Africa MEA Hazardous Location Connectors Market Revenue (billion), by Applications 2025 & 2033
- Figure 60: Middle East & Africa MEA Hazardous Location Connectors Market Volume (K Unit), by Applications 2025 & 2033
- Figure 61: Middle East & Africa MEA Hazardous Location Connectors Market Revenue Share (%), by Applications 2025 & 2033
- Figure 62: Middle East & Africa MEA Hazardous Location Connectors Market Volume Share (%), by Applications 2025 & 2033
- Figure 63: Middle East & Africa MEA Hazardous Location Connectors Market Revenue (billion), by Country 2025 & 2033
- Figure 64: Middle East & Africa MEA Hazardous Location Connectors Market Volume (K Unit), by Country 2025 & 2033
- Figure 65: Middle East & Africa MEA Hazardous Location Connectors Market Revenue Share (%), by Country 2025 & 2033
- Figure 66: Middle East & Africa MEA Hazardous Location Connectors Market Volume Share (%), by Country 2025 & 2033
- Figure 67: Asia Pacific MEA Hazardous Location Connectors Market Revenue (billion), by Class 2025 & 2033
- Figure 68: Asia Pacific MEA Hazardous Location Connectors Market Volume (K Unit), by Class 2025 & 2033
- Figure 69: Asia Pacific MEA Hazardous Location Connectors Market Revenue Share (%), by Class 2025 & 2033
- Figure 70: Asia Pacific MEA Hazardous Location Connectors Market Volume Share (%), by Class 2025 & 2033
- Figure 71: Asia Pacific MEA Hazardous Location Connectors Market Revenue (billion), by Hazardous Zones 2025 & 2033
- Figure 72: Asia Pacific MEA Hazardous Location Connectors Market Volume (K Unit), by Hazardous Zones 2025 & 2033
- Figure 73: Asia Pacific MEA Hazardous Location Connectors Market Revenue Share (%), by Hazardous Zones 2025 & 2033
- Figure 74: Asia Pacific MEA Hazardous Location Connectors Market Volume Share (%), by Hazardous Zones 2025 & 2033
- Figure 75: Asia Pacific MEA Hazardous Location Connectors Market Revenue (billion), by Applications 2025 & 2033
- Figure 76: Asia Pacific MEA Hazardous Location Connectors Market Volume (K Unit), by Applications 2025 & 2033
- Figure 77: Asia Pacific MEA Hazardous Location Connectors Market Revenue Share (%), by Applications 2025 & 2033
- Figure 78: Asia Pacific MEA Hazardous Location Connectors Market Volume Share (%), by Applications 2025 & 2033
- Figure 79: Asia Pacific MEA Hazardous Location Connectors Market Revenue (billion), by Country 2025 & 2033
- Figure 80: Asia Pacific MEA Hazardous Location Connectors Market Volume (K Unit), by Country 2025 & 2033
- Figure 81: Asia Pacific MEA Hazardous Location Connectors Market Revenue Share (%), by Country 2025 & 2033
- Figure 82: Asia Pacific MEA Hazardous Location Connectors Market Volume Share (%), by Country 2025 & 2033
List of Tables
- Table 1: Global MEA Hazardous Location Connectors Market Revenue billion Forecast, by Class 2020 & 2033
- Table 2: Global MEA Hazardous Location Connectors Market Volume K Unit Forecast, by Class 2020 & 2033
- Table 3: Global MEA Hazardous Location Connectors Market Revenue billion Forecast, by Hazardous Zones 2020 & 2033
- Table 4: Global MEA Hazardous Location Connectors Market Volume K Unit Forecast, by Hazardous Zones 2020 & 2033
- Table 5: Global MEA Hazardous Location Connectors Market Revenue billion Forecast, by Applications 2020 & 2033
- Table 6: Global MEA Hazardous Location Connectors Market Volume K Unit Forecast, by Applications 2020 & 2033
- Table 7: Global MEA Hazardous Location Connectors Market Revenue billion Forecast, by Region 2020 & 2033
- Table 8: Global MEA Hazardous Location Connectors Market Volume K Unit Forecast, by Region 2020 & 2033
- Table 9: Global MEA Hazardous Location Connectors Market Revenue billion Forecast, by Class 2020 & 2033
- Table 10: Global MEA Hazardous Location Connectors Market Volume K Unit Forecast, by Class 2020 & 2033
- Table 11: Global MEA Hazardous Location Connectors Market Revenue billion Forecast, by Hazardous Zones 2020 & 2033
- Table 12: Global MEA Hazardous Location Connectors Market Volume K Unit Forecast, by Hazardous Zones 2020 & 2033
- Table 13: Global MEA Hazardous Location Connectors Market Revenue billion Forecast, by Applications 2020 & 2033
- Table 14: Global MEA Hazardous Location Connectors Market Volume K Unit Forecast, by Applications 2020 & 2033
- Table 15: Global MEA Hazardous Location Connectors Market Revenue billion Forecast, by Country 2020 & 2033
- Table 16: Global MEA Hazardous Location Connectors Market Volume K Unit Forecast, by Country 2020 & 2033
- Table 17: United States MEA Hazardous Location Connectors Market Revenue (billion) Forecast, by Application 2020 & 2033
- Table 18: United States MEA Hazardous Location Connectors Market Volume (K Unit) Forecast, by Application 2020 & 2033
- Table 19: Canada MEA Hazardous Location Connectors Market Revenue (billion) Forecast, by Application 2020 & 2033
- Table 20: Canada MEA Hazardous Location Connectors Market Volume (K Unit) Forecast, by Application 2020 & 2033
- Table 21: Mexico MEA Hazardous Location Connectors Market Revenue (billion) Forecast, by Application 2020 & 2033
- Table 22: Mexico MEA Hazardous Location Connectors Market Volume (K Unit) Forecast, by Application 2020 & 2033
- Table 23: Global MEA Hazardous Location Connectors Market Revenue billion Forecast, by Class 2020 & 2033
- Table 24: Global MEA Hazardous Location Connectors Market Volume K Unit Forecast, by Class 2020 & 2033
- Table 25: Global MEA Hazardous Location Connectors Market Revenue billion Forecast, by Hazardous Zones 2020 & 2033
- Table 26: Global MEA Hazardous Location Connectors Market Volume K Unit Forecast, by Hazardous Zones 2020 & 2033
- Table 27: Global MEA Hazardous Location Connectors Market Revenue billion Forecast, by Applications 2020 & 2033
- Table 28: Global MEA Hazardous Location Connectors Market Volume K Unit Forecast, by Applications 2020 & 2033
- Table 29: Global MEA Hazardous Location Connectors Market Revenue billion Forecast, by Country 2020 & 2033
- Table 30: Global MEA Hazardous Location Connectors Market Volume K Unit Forecast, by Country 2020 & 2033
- Table 31: Brazil MEA Hazardous Location Connectors Market Revenue (billion) Forecast, by Application 2020 & 2033
- Table 32: Brazil MEA Hazardous Location Connectors Market Volume (K Unit) Forecast, by Application 2020 & 2033
- Table 33: Argentina MEA Hazardous Location Connectors Market Revenue (billion) Forecast, by Application 2020 & 2033
- Table 34: Argentina MEA Hazardous Location Connectors Market Volume (K Unit) Forecast, by Application 2020 & 2033
- Table 35: Rest of South America MEA Hazardous Location Connectors Market Revenue (billion) Forecast, by Application 2020 & 2033
- Table 36: Rest of South America MEA Hazardous Location Connectors Market Volume (K Unit) Forecast, by Application 2020 & 2033
- Table 37: Global MEA Hazardous Location Connectors Market Revenue billion Forecast, by Class 2020 & 2033
- Table 38: Global MEA Hazardous Location Connectors Market Volume K Unit Forecast, by Class 2020 & 2033
- Table 39: Global MEA Hazardous Location Connectors Market Revenue billion Forecast, by Hazardous Zones 2020 & 2033
- Table 40: Global MEA Hazardous Location Connectors Market Volume K Unit Forecast, by Hazardous Zones 2020 & 2033
- Table 41: Global MEA Hazardous Location Connectors Market Revenue billion Forecast, by Applications 2020 & 2033
- Table 42: Global MEA Hazardous Location Connectors Market Volume K Unit Forecast, by Applications 2020 & 2033
- Table 43: Global MEA Hazardous Location Connectors Market Revenue billion Forecast, by Country 2020 & 2033
- Table 44: Global MEA Hazardous Location Connectors Market Volume K Unit Forecast, by Country 2020 & 2033
- Table 45: United Kingdom MEA Hazardous Location Connectors Market Revenue (billion) Forecast, by Application 2020 & 2033
- Table 46: United Kingdom MEA Hazardous Location Connectors Market Volume (K Unit) Forecast, by Application 2020 & 2033
- Table 47: Germany MEA Hazardous Location Connectors Market Revenue (billion) Forecast, by Application 2020 & 2033
- Table 48: Germany MEA Hazardous Location Connectors Market Volume (K Unit) Forecast, by Application 2020 & 2033
- Table 49: France MEA Hazardous Location Connectors Market Revenue (billion) Forecast, by Application 2020 & 2033
- Table 50: France MEA Hazardous Location Connectors Market Volume (K Unit) Forecast, by Application 2020 & 2033
- Table 51: Italy MEA Hazardous Location Connectors Market Revenue (billion) Forecast, by Application 2020 & 2033
- Table 52: Italy MEA Hazardous Location Connectors Market Volume (K Unit) Forecast, by Application 2020 & 2033
- Table 53: Spain MEA Hazardous Location Connectors Market Revenue (billion) Forecast, by Application 2020 & 2033
- Table 54: Spain MEA Hazardous Location Connectors Market Volume (K Unit) Forecast, by Application 2020 & 2033
- Table 55: Russia MEA Hazardous Location Connectors Market Revenue (billion) Forecast, by Application 2020 & 2033
- Table 56: Russia MEA Hazardous Location Connectors Market Volume (K Unit) Forecast, by Application 2020 & 2033
- Table 57: Benelux MEA Hazardous Location Connectors Market Revenue (billion) Forecast, by Application 2020 & 2033
- Table 58: Benelux MEA Hazardous Location Connectors Market Volume (K Unit) Forecast, by Application 2020 & 2033
- Table 59: Nordics MEA Hazardous Location Connectors Market Revenue (billion) Forecast, by Application 2020 & 2033
- Table 60: Nordics MEA Hazardous Location Connectors Market Volume (K Unit) Forecast, by Application 2020 & 2033
- Table 61: Rest of Europe MEA Hazardous Location Connectors Market Revenue (billion) Forecast, by Application 2020 & 2033
- Table 62: Rest of Europe MEA Hazardous Location Connectors Market Volume (K Unit) Forecast, by Application 2020 & 2033
- Table 63: Global MEA Hazardous Location Connectors Market Revenue billion Forecast, by Class 2020 & 2033
- Table 64: Global MEA Hazardous Location Connectors Market Volume K Unit Forecast, by Class 2020 & 2033
- Table 65: Global MEA Hazardous Location Connectors Market Revenue billion Forecast, by Hazardous Zones 2020 & 2033
- Table 66: Global MEA Hazardous Location Connectors Market Volume K Unit Forecast, by Hazardous Zones 2020 & 2033
- Table 67: Global MEA Hazardous Location Connectors Market Revenue billion Forecast, by Applications 2020 & 2033
- Table 68: Global MEA Hazardous Location Connectors Market Volume K Unit Forecast, by Applications 2020 & 2033
- Table 69: Global MEA Hazardous Location Connectors Market Revenue billion Forecast, by Country 2020 & 2033
- Table 70: Global MEA Hazardous Location Connectors Market Volume K Unit Forecast, by Country 2020 & 2033
- Table 71: Turkey MEA Hazardous Location Connectors Market Revenue (billion) Forecast, by Application 2020 & 2033
- Table 72: Turkey MEA Hazardous Location Connectors Market Volume (K Unit) Forecast, by Application 2020 & 2033
- Table 73: Israel MEA Hazardous Location Connectors Market Revenue (billion) Forecast, by Application 2020 & 2033
- Table 74: Israel MEA Hazardous Location Connectors Market Volume (K Unit) Forecast, by Application 2020 & 2033
- Table 75: GCC MEA Hazardous Location Connectors Market Revenue (billion) Forecast, by Application 2020 & 2033
- Table 76: GCC MEA Hazardous Location Connectors Market Volume (K Unit) Forecast, by Application 2020 & 2033
- Table 77: North Africa MEA Hazardous Location Connectors Market Revenue (billion) Forecast, by Application 2020 & 2033
- Table 78: North Africa MEA Hazardous Location Connectors Market Volume (K Unit) Forecast, by Application 2020 & 2033
- Table 79: South Africa MEA Hazardous Location Connectors Market Revenue (billion) Forecast, by Application 2020 & 2033
- Table 80: South Africa MEA Hazardous Location Connectors Market Volume (K Unit) Forecast, by Application 2020 & 2033
- Table 81: Rest of Middle East & Africa MEA Hazardous Location Connectors Market Revenue (billion) Forecast, by Application 2020 & 2033
- Table 82: Rest of Middle East & Africa MEA Hazardous Location Connectors Market Volume (K Unit) Forecast, by Application 2020 & 2033
- Table 83: Global MEA Hazardous Location Connectors Market Revenue billion Forecast, by Class 2020 & 2033
- Table 84: Global MEA Hazardous Location Connectors Market Volume K Unit Forecast, by Class 2020 & 2033
- Table 85: Global MEA Hazardous Location Connectors Market Revenue billion Forecast, by Hazardous Zones 2020 & 2033
- Table 86: Global MEA Hazardous Location Connectors Market Volume K Unit Forecast, by Hazardous Zones 2020 & 2033
- Table 87: Global MEA Hazardous Location Connectors Market Revenue billion Forecast, by Applications 2020 & 2033
- Table 88: Global MEA Hazardous Location Connectors Market Volume K Unit Forecast, by Applications 2020 & 2033
- Table 89: Global MEA Hazardous Location Connectors Market Revenue billion Forecast, by Country 2020 & 2033
- Table 90: Global MEA Hazardous Location Connectors Market Volume K Unit Forecast, by Country 2020 & 2033
- Table 91: China MEA Hazardous Location Connectors Market Revenue (billion) Forecast, by Application 2020 & 2033
- Table 92: China MEA Hazardous Location Connectors Market Volume (K Unit) Forecast, by Application 2020 & 2033
- Table 93: India MEA Hazardous Location Connectors Market Revenue (billion) Forecast, by Application 2020 & 2033
- Table 94: India MEA Hazardous Location Connectors Market Volume (K Unit) Forecast, by Application 2020 & 2033
- Table 95: Japan MEA Hazardous Location Connectors Market Revenue (billion) Forecast, by Application 2020 & 2033
- Table 96: Japan MEA Hazardous Location Connectors Market Volume (K Unit) Forecast, by Application 2020 & 2033
- Table 97: South Korea MEA Hazardous Location Connectors Market Revenue (billion) Forecast, by Application 2020 & 2033
- Table 98: South Korea MEA Hazardous Location Connectors Market Volume (K Unit) Forecast, by Application 2020 & 2033
- Table 99: ASEAN MEA Hazardous Location Connectors Market Revenue (billion) Forecast, by Application 2020 & 2033
- Table 100: ASEAN MEA Hazardous Location Connectors Market Volume (K Unit) Forecast, by Application 2020 & 2033
- Table 101: Oceania MEA Hazardous Location Connectors Market Revenue (billion) Forecast, by Application 2020 & 2033
- Table 102: Oceania MEA Hazardous Location Connectors Market Volume (K Unit) Forecast, by Application 2020 & 2033
- Table 103: Rest of Asia Pacific MEA Hazardous Location Connectors Market Revenue (billion) Forecast, by Application 2020 & 2033
- Table 104: Rest of Asia Pacific MEA Hazardous Location Connectors Market Volume (K Unit) Forecast, by Application 2020 & 2033
Frequently Asked Questions
1. What is the projected Compound Annual Growth Rate (CAGR) of the MEA Hazardous Location Connectors Market?
The projected CAGR is approximately 6.2%.
2. Which companies are prominent players in the MEA Hazardous Location Connectors Market?
Key companies in the market include Thomas & Betts ( ABB Group), American Connectors Inc, Crouse-Hinds (Eaton), Emersion Industrial Automation, Hubbell-Killark, Vantage Technology, Amphenol Industrial Products Group, ITT BIW Connector Systems.
3. What are the main segments of the MEA Hazardous Location Connectors Market?
The market segments include Class, Hazardous Zones, Applications.
4. Can you provide details about the market size?
The market size is estimated to be USD 11.89 billion as of 2022.
5. What are some drivers contributing to market growth?
Rising Industrial Safety Measures; Increasing Applications in the Industrial Sector and Reducing Costs; Growing Awareness among Industry Personnel.
6. What are the notable trends driving market growth?
Oil Refineries to have a significant growth.
7. Are there any restraints impacting market growth?
Complexity of Standards; Product Installation and Maintenance Costs.
8. Can you provide examples of recent developments in the market?
April 2022 - Emerson has expanded its ASCO series 090 lines of miniature solenoid valves, adding a new three-way series 090 valve configuration to enable more space-efficient and lighter solutions for gas control in oxygen therapy and compression therapy, and gas analyzer devices.
9. What pricing options are available for accessing the report?
Pricing options include single-user, multi-user, and enterprise licenses priced at USD 3800, USD 4500, and USD 5800 respectively.
10. Is the market size provided in terms of value or volume?
The market size is provided in terms of value, measured in billion and volume, measured in K Unit.
11. Are there any specific market keywords associated with the report?
Yes, the market keyword associated with the report is "MEA Hazardous Location Connectors Market," which aids in identifying and referencing the specific market segment covered.
12. How do I determine which pricing option suits my needs best?
The pricing options vary based on user requirements and access needs. Individual users may opt for single-user licenses, while businesses requiring broader access may choose multi-user or enterprise licenses for cost-effective access to the report.
13. Are there any additional resources or data provided in the MEA Hazardous Location Connectors Market report?
While the report offers comprehensive insights, it's advisable to review the specific contents or supplementary materials provided to ascertain if additional resources or data are available.
14. How can I stay updated on further developments or reports in the MEA Hazardous Location Connectors Market?
To stay informed about further developments, trends, and reports in the MEA Hazardous Location Connectors Market, consider subscribing to industry newsletters, following relevant companies and organizations, or regularly checking reputable industry news sources and publications.
Methodology
Step 1 - Identification of Relevant Samples Size from Population Database


Step 2 - Approaches for Defining Global Market Size (Value, Volume* & Price*)

Note*: In applicable scenarios
Step 3 - Data Sources
Primary Research
- Web Analytics
- Survey Reports
- Research Institute
- Latest Research Reports
- Opinion Leaders
Secondary Research
- Annual Reports
- White Paper
- Latest Press Release
- Industry Association
- Paid Database
- Investor Presentations

Step 4 - Data Triangulation
Involves using different sources of information in order to increase the validity of a study
These sources are likely to be stakeholders in a program - participants, other researchers, program staff, other community members, and so on.
Then we put all data in single framework & apply various statistical tools to find out the dynamic on the market.
During the analysis stage, feedback from the stakeholder groups would be compared to determine areas of agreement as well as areas of divergence