

Key Insights
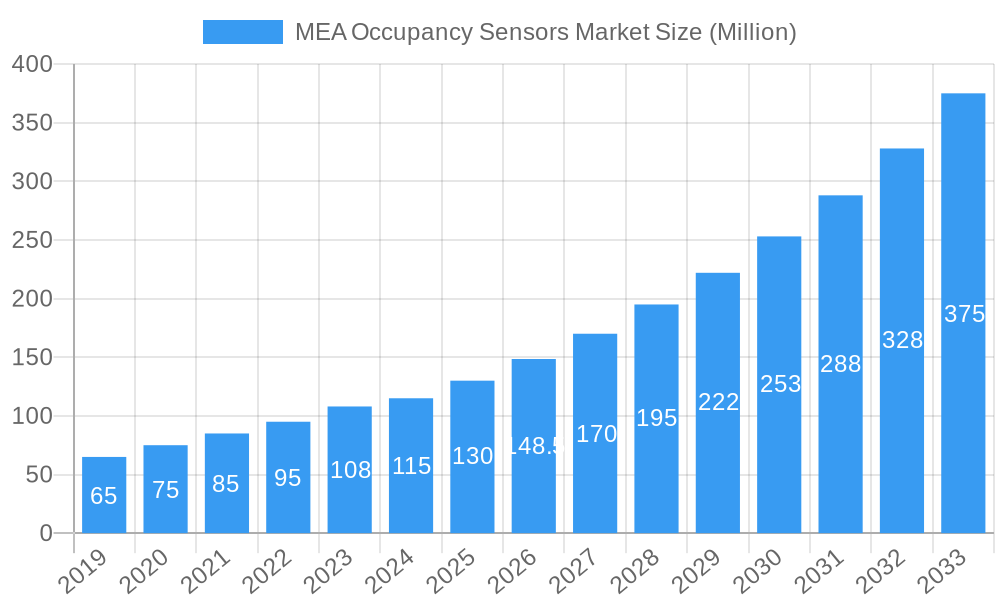
The Middle East & Africa (MEA) Occupancy Sensors Market is projected for substantial growth, anticipated to reach 3192.41 million by 2025, with a Compound Annual Growth Rate (CAGR) of 12.8% through 2033. This expansion is propelled by the increasing demand for energy efficiency and cost optimization across residential, commercial, and industrial sectors. Favorable government regulations and incentives promoting smart building technologies further fuel market adoption. Growing environmental awareness regarding energy waste also drives investment in solutions that optimize energy consumption. The proliferation of smart city initiatives and the integration of the Internet of Things (IoT) in building management systems are significant growth catalysts.
MEA Occupancy Sensors Market Market Size (In Billion)
The market is segmented by network type (Wired, Wireless) and technology (Ultrasonic, Passive Infrared (PIR), Microwave). Wireless technologies are increasingly favored for their ease of installation and flexibility. Occupancy sensors are widely adopted for Lighting Control, HVAC, and Security & Surveillance applications, enhancing user comfort, operational efficiency, and safety. The residential and commercial building segments are leading adoption, driven by new construction and retrofitting projects. Leading players are actively investing in R&D to introduce innovative solutions and expand their market reach.
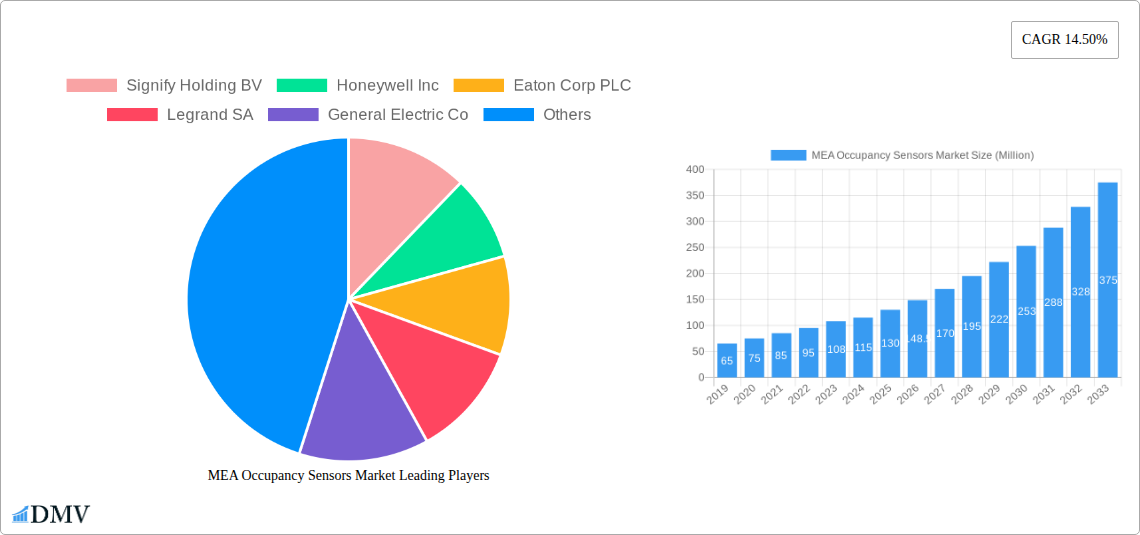
MEA Occupancy Sensors Market Company Market Share
This report offers a comprehensive analysis of the MEA Occupancy Sensors Market, providing critical insights for stakeholders. Covering a study period from 2019 to 2033, with a base year of 2025, it details market dynamics, technological advancements, regulatory frameworks, and future opportunities. The MEA region's demand for smart building solutions, driven by energy efficiency, enhanced safety, and smart city initiatives, positions occupancy sensors as pivotal for optimizing resource utilization and occupant comfort.
MEA Occupancy Sensors Market Market Composition & Trends
The MEA Occupancy Sensors Market exhibits a moderate to high concentration, with key players like Signify Holding BV, Honeywell Inc., Eaton Corp PLC, Legrand SA, and Schneider Electric SE dominating market share. Innovation is a significant catalyst, driven by advancements in sensor technology and the increasing integration of IoT in building management systems. Regulatory frameworks, while still developing in some parts of the region, are increasingly emphasizing energy efficiency standards, indirectly bolstering the adoption of occupancy sensors. The threat of substitute products, such as manual controls or simple timers, is diminishing as the cost-effectiveness and advanced features of smart occupancy sensors become more apparent. End-user profiles range from large-scale commercial developers and industrial facility managers to residential property owners seeking to enhance their living spaces and reduce utility bills. Mergers and acquisitions (M&A) activities are expected to shape the market further, with strategic consolidations aimed at expanding product portfolios and geographic reach. The total M&A deal value is projected to reach approximately $XXX Million by 2030. Key trends include the growing demand for wireless sensors due to ease of installation and flexibility, and the increasing adoption of passive infrared (PIR) and ultrasonic technologies for their reliability and cost-effectiveness.
MEA Occupancy Sensors Market Industry Evolution
The MEA Occupancy Sensors Market has undergone a remarkable transformation, evolving from basic motion detection to sophisticated, AI-driven sensing solutions. Historically, the market was characterized by the adoption of wired systems for lighting control in commercial buildings, driven by a nascent understanding of energy savings. The period between 2019 and 2024 saw a steady increase in adoption rates, particularly in established markets like the UAE and Saudi Arabia, fueled by government initiatives promoting sustainable construction. The base year 2025 marks a pivotal point, with the market poised for accelerated growth, projected to expand at a Compound Annual Growth Rate (CAGR) of approximately 12.5% during the forecast period of 2025–2033. Technological advancements have been instrumental in this evolution. The introduction of wireless communication protocols like Zigbee and Bluetooth Low Energy has democratized access to occupancy sensing technology, making it viable for a wider range of applications and building types. The accuracy and reliability of sensor technologies have also improved significantly, with advancements in passive infrared (PIR), ultrasonic, and microwave sensors offering more granular detection capabilities. Consumer demand has shifted from mere functionality to intelligent automation, with end-users expecting seamless integration with building management systems (BMS), smart home platforms, and other IoT devices. This demand is further amplified by a growing awareness of the impact of occupancy on energy consumption and operational costs. The market is also witnessing a rise in the adoption of hybrid sensor technologies that combine multiple sensing methods to enhance detection accuracy and reduce false positives, catering to the increasing need for precise environmental control in smart buildings.
Leading Regions, Countries, or Segments in MEA Occupancy Sensors Market
Within the MEA Occupancy Sensors Market, the Commercial building segment is emerging as the dominant force, driven by substantial investments in smart infrastructure and a strong focus on energy efficiency across the region. Key drivers for this dominance include:
- Government Initiatives: Proactive government policies promoting green building standards and smart city development in countries like the UAE and Saudi Arabia are creating a favorable environment for the adoption of advanced occupancy sensing solutions. These initiatives often include incentives and mandates for energy-efficient building technologies.
- Cost Savings: Businesses are increasingly recognizing the significant operational cost savings achievable through optimized lighting and HVAC control, directly impacting their bottom line. Occupancy sensors enable intelligent energy management by ensuring that lights and climate control systems are only active when spaces are occupied.
- Enhanced Occupant Comfort and Productivity: In commercial spaces, such as offices and retail environments, maintaining optimal temperature and lighting conditions based on actual occupancy can significantly improve employee comfort, leading to increased productivity and better customer experiences.
- Technological Advancements: The growing availability of sophisticated wireless occupancy sensors, capable of integrating seamlessly with Building Management Systems (BMS), is simplifying installation and management, making them an attractive proposition for commercial developers and facility managers.
The Wireless network type is also experiencing rapid growth within the MEA region, outpacing its wired counterpart due to its inherent flexibility and ease of deployment. The Passive Infrared (PIR) technology leads due to its cost-effectiveness and reliability in detecting human presence through heat signatures, making it ideal for general lighting control applications. The Lighting Control application segment is the most prominent, directly benefiting from energy-saving initiatives and the drive towards smart lighting solutions. In terms of geographical dominance, the United Arab Emirates (UAE) stands out as a leading market, characterized by significant smart city projects, a strong emphasis on sustainability, and a high concentration of commercial and hospitality developments. Other key markets showing robust growth include Saudi Arabia, driven by Vision 2030 initiatives, and South Africa, with its developing smart building ecosystem. The increasing adoption of Microwave sensors is noted for applications requiring higher detection sensitivity and the ability to penetrate through certain materials, particularly in industrial settings.
MEA Occupancy Sensors Market Product Innovations
Product innovation in the MEA Occupancy Sensors Market is characterized by enhanced sensing accuracy, integration capabilities, and energy efficiency. Manufacturers are developing multi-technology sensors that combine PIR, ultrasonic, and even microwave sensing to minimize false triggers and provide more precise occupancy detection. Innovations also include seamless integration with IoT platforms and BMS, enabling centralized control and data analytics for optimized building management. Furthermore, advancements in low-power consumption design are extending battery life for wireless sensors and reducing the overall energy footprint of these devices, aligning with the region's sustainability goals. The Eyeris Technologies, Inc. and Texas Instruments collaboration on in-cabin sensing AI solutions for the automotive sector exemplifies this trend towards sophisticated, edge-computing-enabled sensing.
Propelling Factors for MEA Occupancy Sensors Market Growth
The MEA Occupancy Sensors Market is propelled by several key factors. Government initiatives and regulations promoting energy efficiency and sustainable building practices are significant drivers, creating a strong demand for solutions that reduce energy consumption. The rapidly expanding smart city initiatives across the region necessitate intelligent building technologies like occupancy sensors for optimized resource management. Furthermore, the increasing adoption of IoT and smart home/building technologies is creating an ecosystem where occupancy sensors play a crucial role in automation and user experience. Economic growth and a rising focus on operational cost reduction by commercial and industrial entities also contribute to the market's expansion.
Obstacles in the MEA Occupancy Sensors Market Market
Despite the positive growth trajectory, the MEA Occupancy Sensors Market faces certain obstacles. Lack of widespread awareness and understanding of the full benefits of occupancy sensing technology in certain sub-regions can hinder adoption. Initial investment costs, although declining, can still be a barrier for smaller businesses or residential projects. Integration complexities with existing legacy building systems can also pose challenges. Furthermore, potential cybersecurity concerns associated with connected IoT devices and the need for robust data privacy regulations require careful consideration by manufacturers and adopters. Supply chain disruptions and geopolitical uncertainties in some parts of the MEA region can also impact market stability and product availability.
Future Opportunities in MEA Occupancy Sensors Market
The MEA Occupancy Sensors Market is ripe with future opportunities. The expansion into emerging markets within Africa, characterized by rapid urbanization and growing infrastructure development, presents significant untapped potential. The development of more advanced AI-powered sensing capabilities for predictive maintenance, space utilization analysis, and enhanced security will open new revenue streams. The increasing demand for personalized comfort and smart living environments in the residential sector also offers substantial growth prospects. Furthermore, the growing focus on health and wellness in buildings, which can be supported by occupancy-based ventilation control, will drive further innovation and adoption. The integration of occupancy sensing with other smart building technologies to create truly intelligent and self-optimizing environments is a key future opportunity.
Major Players in the MEA Occupancy Sensors Market Ecosystem
- Signify Holding BV
- Honeywell Inc.
- Eaton Corp PLC
- Legrand SA
- General Electric Co.
- Dwyer Instruments Inc.
- Schneider Electric SE
- Johnson Controls Inc.
- Analog Devices Inc.
- Texas Instruments Inc.
Key Developments in MEA Occupancy Sensors Market Industry
- January 2021: Eyeris Technologies, Inc. announced a collaboration with Texas Instruments (TI) on an industry-first in-cabin sensing AI solution at the Consumer Electronics Show (CES) 2021. This collaboration utilizes TI's JacintoTM TDA4 processors and 2D RGB-IR image sensors. Eyeris DNNs are designed to meet functional safety standards, allow for flexible camera placement, and perform efficiently on low-power edge processors. Eyeris' AI algorithm portfolio for in-cabin sensing includes driver monitoring system (DMS) and occupant monitoring system (OMS) features that meet global NCAP standards. This development signifies a major leap in sensor technology for automotive applications, hinting at broader implications for occupancy sensing in specialized environments.
Strategic MEA Occupancy Sensors Market Market Forecast
The MEA Occupancy Sensors Market is poised for robust growth, driven by the convergence of energy efficiency mandates, burgeoning smart city projects, and increasing consumer demand for automated building solutions. The strategic adoption of advanced technologies, particularly wireless and AI-integrated sensors, will be crucial for market players. The forecast indicates sustained double-digit growth throughout the projection period, fueled by significant investments in commercial and industrial sectors, alongside a rising interest in smart residential applications. Opportunities lie in expanding into underserved African markets and capitalizing on the demand for integrated building management systems. Market players who can offer innovative, cost-effective, and easily deployable solutions are best positioned to leverage the substantial growth potential in this dynamic region.
MEA Occupancy Sensors Market Segmentation
-
1. Network Type
- 1.1. Wired
- 1.2. Wireless
-
2. Technology
- 2.1. Ultrasonic
- 2.2. Passive Infrared
- 2.3. Microwave
-
3. Application
- 3.1. Lighting Control
- 3.2. HVAC
- 3.3. Security and Surveillance
-
4. Building Type
- 4.1. Residential
- 4.2. Commercial
MEA Occupancy Sensors Market Segmentation By Geography
-
1. North America
- 1.1. United States
- 1.2. Canada
- 1.3. Mexico
-
2. South America
- 2.1. Brazil
- 2.2. Argentina
- 2.3. Rest of South America
-
3. Europe
- 3.1. United Kingdom
- 3.2. Germany
- 3.3. France
- 3.4. Italy
- 3.5. Spain
- 3.6. Russia
- 3.7. Benelux
- 3.8. Nordics
- 3.9. Rest of Europe
-
4. Middle East & Africa
- 4.1. Turkey
- 4.2. Israel
- 4.3. GCC
- 4.4. North Africa
- 4.5. South Africa
- 4.6. Rest of Middle East & Africa
-
5. Asia Pacific
- 5.1. China
- 5.2. India
- 5.3. Japan
- 5.4. South Korea
- 5.5. ASEAN
- 5.6. Oceania
- 5.7. Rest of Asia Pacific
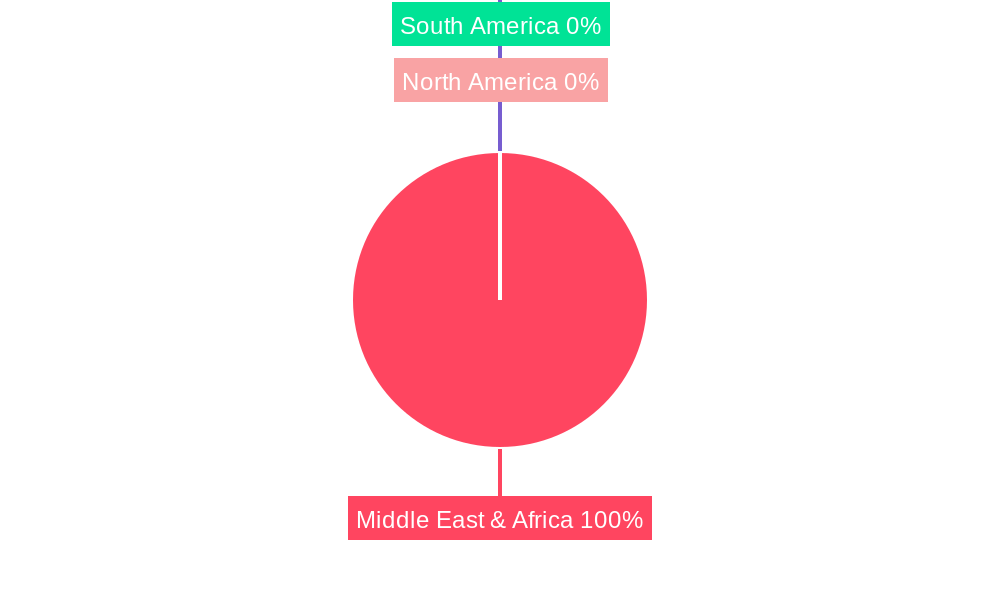
MEA Occupancy Sensors Market Regional Market Share
Geographic Coverage of MEA Occupancy Sensors Market
MEA Occupancy Sensors Market REPORT HIGHLIGHTS
| Aspects | Details |
|---|---|
| Study Period | 2020-2034 |
| Base Year | 2025 |
| Estimated Year | 2026 |
| Forecast Period | 2026-2034 |
| Historical Period | 2020-2025 |
| Growth Rate | CAGR of 12.8% from 2020-2034 |
| Segmentation |
|
Table of Contents
- 1. Introduction
- 1.1. Research Scope
- 1.2. Market Segmentation
- 1.3. Research Methodology
- 1.4. Definitions and Assumptions
- 2. Executive Summary
- 2.1. Introduction
- 3. Market Dynamics
- 3.1. Introduction
- 3.2. Market Drivers
- 3.2.1. Rising demand for energy-efficient devices; Demand for Passive Infrared Due to Low Cost and High Energy Efficiency
- 3.3. Market Restrains
- 3.3.1. Cryptojacking Threats
- 3.4. Market Trends
- 3.4.1. Residential is Expected to Witness Significant Growth
- 4. Market Factor Analysis
- 4.1. Porters Five Forces
- 4.2. Supply/Value Chain
- 4.3. PESTEL analysis
- 4.4. Market Entropy
- 4.5. Patent/Trademark Analysis
- 5. Global MEA Occupancy Sensors Market Analysis, Insights and Forecast, 2020-2032
- 5.1. Market Analysis, Insights and Forecast - by Network Type
- 5.1.1. Wired
- 5.1.2. Wireless
- 5.2. Market Analysis, Insights and Forecast - by Technology
- 5.2.1. Ultrasonic
- 5.2.2. Passive Infrared
- 5.2.3. Microwave
- 5.3. Market Analysis, Insights and Forecast - by Application
- 5.3.1. Lighting Control
- 5.3.2. HVAC
- 5.3.3. Security and Surveillance
- 5.4. Market Analysis, Insights and Forecast - by Building Type
- 5.4.1. Residential
- 5.4.2. Commercial
- 5.5. Market Analysis, Insights and Forecast - by Region
- 5.5.1. North America
- 5.5.2. South America
- 5.5.3. Europe
- 5.5.4. Middle East & Africa
- 5.5.5. Asia Pacific
- 5.1. Market Analysis, Insights and Forecast - by Network Type
- 6. North America MEA Occupancy Sensors Market Analysis, Insights and Forecast, 2020-2032
- 6.1. Market Analysis, Insights and Forecast - by Network Type
- 6.1.1. Wired
- 6.1.2. Wireless
- 6.2. Market Analysis, Insights and Forecast - by Technology
- 6.2.1. Ultrasonic
- 6.2.2. Passive Infrared
- 6.2.3. Microwave
- 6.3. Market Analysis, Insights and Forecast - by Application
- 6.3.1. Lighting Control
- 6.3.2. HVAC
- 6.3.3. Security and Surveillance
- 6.4. Market Analysis, Insights and Forecast - by Building Type
- 6.4.1. Residential
- 6.4.2. Commercial
- 6.1. Market Analysis, Insights and Forecast - by Network Type
- 7. South America MEA Occupancy Sensors Market Analysis, Insights and Forecast, 2020-2032
- 7.1. Market Analysis, Insights and Forecast - by Network Type
- 7.1.1. Wired
- 7.1.2. Wireless
- 7.2. Market Analysis, Insights and Forecast - by Technology
- 7.2.1. Ultrasonic
- 7.2.2. Passive Infrared
- 7.2.3. Microwave
- 7.3. Market Analysis, Insights and Forecast - by Application
- 7.3.1. Lighting Control
- 7.3.2. HVAC
- 7.3.3. Security and Surveillance
- 7.4. Market Analysis, Insights and Forecast - by Building Type
- 7.4.1. Residential
- 7.4.2. Commercial
- 7.1. Market Analysis, Insights and Forecast - by Network Type
- 8. Europe MEA Occupancy Sensors Market Analysis, Insights and Forecast, 2020-2032
- 8.1. Market Analysis, Insights and Forecast - by Network Type
- 8.1.1. Wired
- 8.1.2. Wireless
- 8.2. Market Analysis, Insights and Forecast - by Technology
- 8.2.1. Ultrasonic
- 8.2.2. Passive Infrared
- 8.2.3. Microwave
- 8.3. Market Analysis, Insights and Forecast - by Application
- 8.3.1. Lighting Control
- 8.3.2. HVAC
- 8.3.3. Security and Surveillance
- 8.4. Market Analysis, Insights and Forecast - by Building Type
- 8.4.1. Residential
- 8.4.2. Commercial
- 8.1. Market Analysis, Insights and Forecast - by Network Type
- 9. Middle East & Africa MEA Occupancy Sensors Market Analysis, Insights and Forecast, 2020-2032
- 9.1. Market Analysis, Insights and Forecast - by Network Type
- 9.1.1. Wired
- 9.1.2. Wireless
- 9.2. Market Analysis, Insights and Forecast - by Technology
- 9.2.1. Ultrasonic
- 9.2.2. Passive Infrared
- 9.2.3. Microwave
- 9.3. Market Analysis, Insights and Forecast - by Application
- 9.3.1. Lighting Control
- 9.3.2. HVAC
- 9.3.3. Security and Surveillance
- 9.4. Market Analysis, Insights and Forecast - by Building Type
- 9.4.1. Residential
- 9.4.2. Commercial
- 9.1. Market Analysis, Insights and Forecast - by Network Type
- 10. Asia Pacific MEA Occupancy Sensors Market Analysis, Insights and Forecast, 2020-2032
- 10.1. Market Analysis, Insights and Forecast - by Network Type
- 10.1.1. Wired
- 10.1.2. Wireless
- 10.2. Market Analysis, Insights and Forecast - by Technology
- 10.2.1. Ultrasonic
- 10.2.2. Passive Infrared
- 10.2.3. Microwave
- 10.3. Market Analysis, Insights and Forecast - by Application
- 10.3.1. Lighting Control
- 10.3.2. HVAC
- 10.3.3. Security and Surveillance
- 10.4. Market Analysis, Insights and Forecast - by Building Type
- 10.4.1. Residential
- 10.4.2. Commercial
- 10.1. Market Analysis, Insights and Forecast - by Network Type
- 11. Competitive Analysis
- 11.1. Global Market Share Analysis 2025
- 11.2. Company Profiles
- 11.2.1 Signify Holding BV
- 11.2.1.1. Overview
- 11.2.1.2. Products
- 11.2.1.3. SWOT Analysis
- 11.2.1.4. Recent Developments
- 11.2.1.5. Financials (Based on Availability)
- 11.2.2 Honeywell Inc
- 11.2.2.1. Overview
- 11.2.2.2. Products
- 11.2.2.3. SWOT Analysis
- 11.2.2.4. Recent Developments
- 11.2.2.5. Financials (Based on Availability)
- 11.2.3 Eaton Corp PLC
- 11.2.3.1. Overview
- 11.2.3.2. Products
- 11.2.3.3. SWOT Analysis
- 11.2.3.4. Recent Developments
- 11.2.3.5. Financials (Based on Availability)
- 11.2.4 Legrand SA
- 11.2.4.1. Overview
- 11.2.4.2. Products
- 11.2.4.3. SWOT Analysis
- 11.2.4.4. Recent Developments
- 11.2.4.5. Financials (Based on Availability)
- 11.2.5 General Electric Co
- 11.2.5.1. Overview
- 11.2.5.2. Products
- 11.2.5.3. SWOT Analysis
- 11.2.5.4. Recent Developments
- 11.2.5.5. Financials (Based on Availability)
- 11.2.6 Dwyer Instruments Inc
- 11.2.6.1. Overview
- 11.2.6.2. Products
- 11.2.6.3. SWOT Analysis
- 11.2.6.4. Recent Developments
- 11.2.6.5. Financials (Based on Availability)
- 11.2.7 Schneider Electric SE
- 11.2.7.1. Overview
- 11.2.7.2. Products
- 11.2.7.3. SWOT Analysis
- 11.2.7.4. Recent Developments
- 11.2.7.5. Financials (Based on Availability)
- 11.2.8 Johnson Controls Inc
- 11.2.8.1. Overview
- 11.2.8.2. Products
- 11.2.8.3. SWOT Analysis
- 11.2.8.4. Recent Developments
- 11.2.8.5. Financials (Based on Availability)
- 11.2.9 Analog Devices Inc
- 11.2.9.1. Overview
- 11.2.9.2. Products
- 11.2.9.3. SWOT Analysis
- 11.2.9.4. Recent Developments
- 11.2.9.5. Financials (Based on Availability)
- 11.2.10 Texas Instruments Inc*List Not Exhaustive
- 11.2.10.1. Overview
- 11.2.10.2. Products
- 11.2.10.3. SWOT Analysis
- 11.2.10.4. Recent Developments
- 11.2.10.5. Financials (Based on Availability)
- 11.2.1 Signify Holding BV
List of Figures
- Figure 1: Global MEA Occupancy Sensors Market Revenue Breakdown (million, %) by Region 2025 & 2033
- Figure 2: North America MEA Occupancy Sensors Market Revenue (million), by Network Type 2025 & 2033
- Figure 3: North America MEA Occupancy Sensors Market Revenue Share (%), by Network Type 2025 & 2033
- Figure 4: North America MEA Occupancy Sensors Market Revenue (million), by Technology 2025 & 2033
- Figure 5: North America MEA Occupancy Sensors Market Revenue Share (%), by Technology 2025 & 2033
- Figure 6: North America MEA Occupancy Sensors Market Revenue (million), by Application 2025 & 2033
- Figure 7: North America MEA Occupancy Sensors Market Revenue Share (%), by Application 2025 & 2033
- Figure 8: North America MEA Occupancy Sensors Market Revenue (million), by Building Type 2025 & 2033
- Figure 9: North America MEA Occupancy Sensors Market Revenue Share (%), by Building Type 2025 & 2033
- Figure 10: North America MEA Occupancy Sensors Market Revenue (million), by Country 2025 & 2033
- Figure 11: North America MEA Occupancy Sensors Market Revenue Share (%), by Country 2025 & 2033
- Figure 12: South America MEA Occupancy Sensors Market Revenue (million), by Network Type 2025 & 2033
- Figure 13: South America MEA Occupancy Sensors Market Revenue Share (%), by Network Type 2025 & 2033
- Figure 14: South America MEA Occupancy Sensors Market Revenue (million), by Technology 2025 & 2033
- Figure 15: South America MEA Occupancy Sensors Market Revenue Share (%), by Technology 2025 & 2033
- Figure 16: South America MEA Occupancy Sensors Market Revenue (million), by Application 2025 & 2033
- Figure 17: South America MEA Occupancy Sensors Market Revenue Share (%), by Application 2025 & 2033
- Figure 18: South America MEA Occupancy Sensors Market Revenue (million), by Building Type 2025 & 2033
- Figure 19: South America MEA Occupancy Sensors Market Revenue Share (%), by Building Type 2025 & 2033
- Figure 20: South America MEA Occupancy Sensors Market Revenue (million), by Country 2025 & 2033
- Figure 21: South America MEA Occupancy Sensors Market Revenue Share (%), by Country 2025 & 2033
- Figure 22: Europe MEA Occupancy Sensors Market Revenue (million), by Network Type 2025 & 2033
- Figure 23: Europe MEA Occupancy Sensors Market Revenue Share (%), by Network Type 2025 & 2033
- Figure 24: Europe MEA Occupancy Sensors Market Revenue (million), by Technology 2025 & 2033
- Figure 25: Europe MEA Occupancy Sensors Market Revenue Share (%), by Technology 2025 & 2033
- Figure 26: Europe MEA Occupancy Sensors Market Revenue (million), by Application 2025 & 2033
- Figure 27: Europe MEA Occupancy Sensors Market Revenue Share (%), by Application 2025 & 2033
- Figure 28: Europe MEA Occupancy Sensors Market Revenue (million), by Building Type 2025 & 2033
- Figure 29: Europe MEA Occupancy Sensors Market Revenue Share (%), by Building Type 2025 & 2033
- Figure 30: Europe MEA Occupancy Sensors Market Revenue (million), by Country 2025 & 2033
- Figure 31: Europe MEA Occupancy Sensors Market Revenue Share (%), by Country 2025 & 2033
- Figure 32: Middle East & Africa MEA Occupancy Sensors Market Revenue (million), by Network Type 2025 & 2033
- Figure 33: Middle East & Africa MEA Occupancy Sensors Market Revenue Share (%), by Network Type 2025 & 2033
- Figure 34: Middle East & Africa MEA Occupancy Sensors Market Revenue (million), by Technology 2025 & 2033
- Figure 35: Middle East & Africa MEA Occupancy Sensors Market Revenue Share (%), by Technology 2025 & 2033
- Figure 36: Middle East & Africa MEA Occupancy Sensors Market Revenue (million), by Application 2025 & 2033
- Figure 37: Middle East & Africa MEA Occupancy Sensors Market Revenue Share (%), by Application 2025 & 2033
- Figure 38: Middle East & Africa MEA Occupancy Sensors Market Revenue (million), by Building Type 2025 & 2033
- Figure 39: Middle East & Africa MEA Occupancy Sensors Market Revenue Share (%), by Building Type 2025 & 2033
- Figure 40: Middle East & Africa MEA Occupancy Sensors Market Revenue (million), by Country 2025 & 2033
- Figure 41: Middle East & Africa MEA Occupancy Sensors Market Revenue Share (%), by Country 2025 & 2033
- Figure 42: Asia Pacific MEA Occupancy Sensors Market Revenue (million), by Network Type 2025 & 2033
- Figure 43: Asia Pacific MEA Occupancy Sensors Market Revenue Share (%), by Network Type 2025 & 2033
- Figure 44: Asia Pacific MEA Occupancy Sensors Market Revenue (million), by Technology 2025 & 2033
- Figure 45: Asia Pacific MEA Occupancy Sensors Market Revenue Share (%), by Technology 2025 & 2033
- Figure 46: Asia Pacific MEA Occupancy Sensors Market Revenue (million), by Application 2025 & 2033
- Figure 47: Asia Pacific MEA Occupancy Sensors Market Revenue Share (%), by Application 2025 & 2033
- Figure 48: Asia Pacific MEA Occupancy Sensors Market Revenue (million), by Building Type 2025 & 2033
- Figure 49: Asia Pacific MEA Occupancy Sensors Market Revenue Share (%), by Building Type 2025 & 2033
- Figure 50: Asia Pacific MEA Occupancy Sensors Market Revenue (million), by Country 2025 & 2033
- Figure 51: Asia Pacific MEA Occupancy Sensors Market Revenue Share (%), by Country 2025 & 2033
List of Tables
- Table 1: Global MEA Occupancy Sensors Market Revenue million Forecast, by Network Type 2020 & 2033
- Table 2: Global MEA Occupancy Sensors Market Revenue million Forecast, by Technology 2020 & 2033
- Table 3: Global MEA Occupancy Sensors Market Revenue million Forecast, by Application 2020 & 2033
- Table 4: Global MEA Occupancy Sensors Market Revenue million Forecast, by Building Type 2020 & 2033
- Table 5: Global MEA Occupancy Sensors Market Revenue million Forecast, by Region 2020 & 2033
- Table 6: Global MEA Occupancy Sensors Market Revenue million Forecast, by Network Type 2020 & 2033
- Table 7: Global MEA Occupancy Sensors Market Revenue million Forecast, by Technology 2020 & 2033
- Table 8: Global MEA Occupancy Sensors Market Revenue million Forecast, by Application 2020 & 2033
- Table 9: Global MEA Occupancy Sensors Market Revenue million Forecast, by Building Type 2020 & 2033
- Table 10: Global MEA Occupancy Sensors Market Revenue million Forecast, by Country 2020 & 2033
- Table 11: United States MEA Occupancy Sensors Market Revenue (million) Forecast, by Application 2020 & 2033
- Table 12: Canada MEA Occupancy Sensors Market Revenue (million) Forecast, by Application 2020 & 2033
- Table 13: Mexico MEA Occupancy Sensors Market Revenue (million) Forecast, by Application 2020 & 2033
- Table 14: Global MEA Occupancy Sensors Market Revenue million Forecast, by Network Type 2020 & 2033
- Table 15: Global MEA Occupancy Sensors Market Revenue million Forecast, by Technology 2020 & 2033
- Table 16: Global MEA Occupancy Sensors Market Revenue million Forecast, by Application 2020 & 2033
- Table 17: Global MEA Occupancy Sensors Market Revenue million Forecast, by Building Type 2020 & 2033
- Table 18: Global MEA Occupancy Sensors Market Revenue million Forecast, by Country 2020 & 2033
- Table 19: Brazil MEA Occupancy Sensors Market Revenue (million) Forecast, by Application 2020 & 2033
- Table 20: Argentina MEA Occupancy Sensors Market Revenue (million) Forecast, by Application 2020 & 2033
- Table 21: Rest of South America MEA Occupancy Sensors Market Revenue (million) Forecast, by Application 2020 & 2033
- Table 22: Global MEA Occupancy Sensors Market Revenue million Forecast, by Network Type 2020 & 2033
- Table 23: Global MEA Occupancy Sensors Market Revenue million Forecast, by Technology 2020 & 2033
- Table 24: Global MEA Occupancy Sensors Market Revenue million Forecast, by Application 2020 & 2033
- Table 25: Global MEA Occupancy Sensors Market Revenue million Forecast, by Building Type 2020 & 2033
- Table 26: Global MEA Occupancy Sensors Market Revenue million Forecast, by Country 2020 & 2033
- Table 27: United Kingdom MEA Occupancy Sensors Market Revenue (million) Forecast, by Application 2020 & 2033
- Table 28: Germany MEA Occupancy Sensors Market Revenue (million) Forecast, by Application 2020 & 2033
- Table 29: France MEA Occupancy Sensors Market Revenue (million) Forecast, by Application 2020 & 2033
- Table 30: Italy MEA Occupancy Sensors Market Revenue (million) Forecast, by Application 2020 & 2033
- Table 31: Spain MEA Occupancy Sensors Market Revenue (million) Forecast, by Application 2020 & 2033
- Table 32: Russia MEA Occupancy Sensors Market Revenue (million) Forecast, by Application 2020 & 2033
- Table 33: Benelux MEA Occupancy Sensors Market Revenue (million) Forecast, by Application 2020 & 2033
- Table 34: Nordics MEA Occupancy Sensors Market Revenue (million) Forecast, by Application 2020 & 2033
- Table 35: Rest of Europe MEA Occupancy Sensors Market Revenue (million) Forecast, by Application 2020 & 2033
- Table 36: Global MEA Occupancy Sensors Market Revenue million Forecast, by Network Type 2020 & 2033
- Table 37: Global MEA Occupancy Sensors Market Revenue million Forecast, by Technology 2020 & 2033
- Table 38: Global MEA Occupancy Sensors Market Revenue million Forecast, by Application 2020 & 2033
- Table 39: Global MEA Occupancy Sensors Market Revenue million Forecast, by Building Type 2020 & 2033
- Table 40: Global MEA Occupancy Sensors Market Revenue million Forecast, by Country 2020 & 2033
- Table 41: Turkey MEA Occupancy Sensors Market Revenue (million) Forecast, by Application 2020 & 2033
- Table 42: Israel MEA Occupancy Sensors Market Revenue (million) Forecast, by Application 2020 & 2033
- Table 43: GCC MEA Occupancy Sensors Market Revenue (million) Forecast, by Application 2020 & 2033
- Table 44: North Africa MEA Occupancy Sensors Market Revenue (million) Forecast, by Application 2020 & 2033
- Table 45: South Africa MEA Occupancy Sensors Market Revenue (million) Forecast, by Application 2020 & 2033
- Table 46: Rest of Middle East & Africa MEA Occupancy Sensors Market Revenue (million) Forecast, by Application 2020 & 2033
- Table 47: Global MEA Occupancy Sensors Market Revenue million Forecast, by Network Type 2020 & 2033
- Table 48: Global MEA Occupancy Sensors Market Revenue million Forecast, by Technology 2020 & 2033
- Table 49: Global MEA Occupancy Sensors Market Revenue million Forecast, by Application 2020 & 2033
- Table 50: Global MEA Occupancy Sensors Market Revenue million Forecast, by Building Type 2020 & 2033
- Table 51: Global MEA Occupancy Sensors Market Revenue million Forecast, by Country 2020 & 2033
- Table 52: China MEA Occupancy Sensors Market Revenue (million) Forecast, by Application 2020 & 2033
- Table 53: India MEA Occupancy Sensors Market Revenue (million) Forecast, by Application 2020 & 2033
- Table 54: Japan MEA Occupancy Sensors Market Revenue (million) Forecast, by Application 2020 & 2033
- Table 55: South Korea MEA Occupancy Sensors Market Revenue (million) Forecast, by Application 2020 & 2033
- Table 56: ASEAN MEA Occupancy Sensors Market Revenue (million) Forecast, by Application 2020 & 2033
- Table 57: Oceania MEA Occupancy Sensors Market Revenue (million) Forecast, by Application 2020 & 2033
- Table 58: Rest of Asia Pacific MEA Occupancy Sensors Market Revenue (million) Forecast, by Application 2020 & 2033
Frequently Asked Questions
1. What is the projected Compound Annual Growth Rate (CAGR) of the MEA Occupancy Sensors Market?
The projected CAGR is approximately 12.8%.
2. Which companies are prominent players in the MEA Occupancy Sensors Market?
Key companies in the market include Signify Holding BV, Honeywell Inc, Eaton Corp PLC, Legrand SA, General Electric Co, Dwyer Instruments Inc, Schneider Electric SE, Johnson Controls Inc, Analog Devices Inc, Texas Instruments Inc*List Not Exhaustive.
3. What are the main segments of the MEA Occupancy Sensors Market?
The market segments include Network Type, Technology, Application, Building Type.
4. Can you provide details about the market size?
The market size is estimated to be USD 3192.41 million as of 2022.
5. What are some drivers contributing to market growth?
Rising demand for energy-efficient devices; Demand for Passive Infrared Due to Low Cost and High Energy Efficiency.
6. What are the notable trends driving market growth?
Residential is Expected to Witness Significant Growth.
7. Are there any restraints impacting market growth?
Cryptojacking Threats.
8. Can you provide examples of recent developments in the market?
January 2021 - Eyeris Technologies, Inc. announced a collaboration with Texas Instruments (TI) on an industry-first in-cabin sensing AI solution at the Consumer Electronics Show (CES) 2021, utilizing TI's JacintoTM TDA4 processors and 2D RGB-IR image sensors. Eyeris DNNs are designed to meet functional safety standards, allow for flexible camera placement, and perform efficiently on low-power edge processors. Eyeris' AI algorithm portfolio for in-cabin sensing includes driver monitoring system (DMS) and occupant monitoring system (OMS) features that meet global NCAP standards.
9. What pricing options are available for accessing the report?
Pricing options include single-user, multi-user, and enterprise licenses priced at USD 4750, USD 4950, and USD 6800 respectively.
10. Is the market size provided in terms of value or volume?
The market size is provided in terms of value, measured in million.
11. Are there any specific market keywords associated with the report?
Yes, the market keyword associated with the report is "MEA Occupancy Sensors Market," which aids in identifying and referencing the specific market segment covered.
12. How do I determine which pricing option suits my needs best?
The pricing options vary based on user requirements and access needs. Individual users may opt for single-user licenses, while businesses requiring broader access may choose multi-user or enterprise licenses for cost-effective access to the report.
13. Are there any additional resources or data provided in the MEA Occupancy Sensors Market report?
While the report offers comprehensive insights, it's advisable to review the specific contents or supplementary materials provided to ascertain if additional resources or data are available.
14. How can I stay updated on further developments or reports in the MEA Occupancy Sensors Market?
To stay informed about further developments, trends, and reports in the MEA Occupancy Sensors Market, consider subscribing to industry newsletters, following relevant companies and organizations, or regularly checking reputable industry news sources and publications.
Methodology
Step 1 - Identification of Relevant Samples Size from Population Database


Step 2 - Approaches for Defining Global Market Size (Value, Volume* & Price*)

Note*: In applicable scenarios
Step 3 - Data Sources
Primary Research
- Web Analytics
- Survey Reports
- Research Institute
- Latest Research Reports
- Opinion Leaders
Secondary Research
- Annual Reports
- White Paper
- Latest Press Release
- Industry Association
- Paid Database
- Investor Presentations

Step 4 - Data Triangulation
Involves using different sources of information in order to increase the validity of a study
These sources are likely to be stakeholders in a program - participants, other researchers, program staff, other community members, and so on.
Then we put all data in single framework & apply various statistical tools to find out the dynamic on the market.
During the analysis stage, feedback from the stakeholder groups would be compared to determine areas of agreement as well as areas of divergence