

Key Insights
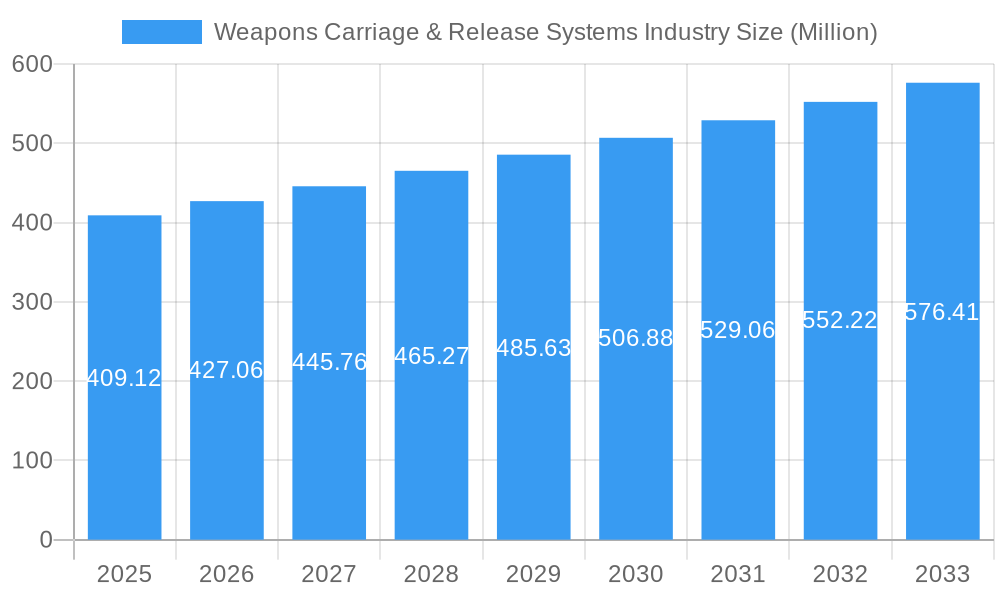
The global Weapons Carriage & Release Systems (WC&RS) market, valued at $409.12 million in 2025, is projected to experience robust growth, driven by increasing defense budgets globally and modernization efforts across various armed forces. The market's Compound Annual Growth Rate (CAGR) of 4.19% from 2025 to 2033 indicates a steady expansion, fueled by technological advancements in precision-guided munitions and the rising demand for unmanned aerial vehicle (UAV) integration. Key drivers include the development of sophisticated targeting systems, the need for enhanced weapon payload capacity, and the growing adoption of networked systems for improved situational awareness. Market segmentation reveals significant contributions from aircraft and missile weapon types, reflecting the continuing reliance on traditional platforms alongside emerging UAV technologies. Major players like The Marvin Group, L3Harris Technologies Inc., and RTX Corporation are driving innovation and competition, focusing on advanced features such as improved reliability, reduced weight, and enhanced compatibility across diverse platforms. Geopolitically, North America and Europe are expected to dominate the market share, given their significant defense expenditure and established aerospace industries. However, the Asia-Pacific region is anticipated to exhibit substantial growth, driven by increasing defense modernization programs and regional geopolitical factors.

Weapons Carriage & Release Systems Industry Market Size (In Million)
The restraints on market growth primarily stem from the high cost of research and development for advanced WC&RS technologies, alongside stringent regulatory compliance requirements. Despite these challenges, the market is poised for continued expansion, propelled by the persistent demand for improved weapon delivery accuracy, increased operational efficiency, and integration with next-generation combat systems. Further growth is expected from the integration of artificial intelligence (AI) and machine learning (ML) into WC&RS, enabling autonomous weapon selection and targeting. The ongoing conflicts and geopolitical instability worldwide will likely continue to stimulate demand, while the need for enhanced interoperability between platforms and weapon systems will drive further investment in advanced WC&RS technology. Consequently, the forecast period (2025-2033) anticipates a substantial market expansion, creating lucrative opportunities for established players and new entrants alike.
Weapons Carriage & Release Systems Industry Company Market Share
Weapons Carriage & Release Systems Industry: A Comprehensive Market Report (2019-2033)
This insightful report provides a detailed analysis of the global Weapons Carriage & Release Systems industry, offering a comprehensive overview of market trends, key players, technological advancements, and future growth prospects. With a study period spanning 2019-2033, a base year of 2025, and an estimated year of 2025, this report offers crucial data for stakeholders seeking to navigate this dynamic sector. The forecast period covers 2025-2033, with historical data encompassing 2019-2024. The market is valued at xx Million in 2025 and is projected to reach xx Million by 2033.
Weapons Carriage & Release Systems Industry Market Composition & Trends
This section delves into the intricate composition of the Weapons Carriage & Release Systems market, examining key aspects influencing its trajectory. We analyze market concentration, revealing the market share distribution amongst major players like The Marvin Group, L3Harris Technologies Inc, Systima Technologies Inc (Karman Space & Defense), Cobham Limited, Moog Inc, RTX Corporation, Alkan, and Marotta Controls Inc. We estimate that these companies collectively hold approximately 75% of the market share in 2025, with L3Harris Technologies and RTX Corporation leading the pack. The report also explores the innovation landscape, identifying key technological advancements driving market growth. Regulatory landscapes across different geographies are scrutinized, along with an analysis of substitute products and their potential impact. Furthermore, we examine the evolving end-user profiles, including the armed forces of various nations, and detail significant mergers and acquisitions (M&A) activities within the industry, including an estimated total M&A deal value of $xx Million during the historical period. The analysis incorporates:
- Market Concentration: High, with a few dominant players.
- Innovation Catalysts: Advancements in materials science, automation, and AI.
- Regulatory Landscape: Stringent safety and export control regulations.
- Substitute Products: Limited, due to specialized nature of the systems.
- End-User Profiles: Primarily military and defense organizations.
- M&A Activity: Significant consolidation observed, with several strategic acquisitions in recent years.
Weapons Carriage & Release Systems Industry Evolution
This section meticulously traces the evolution of the Weapons Carriage & Release Systems industry, focusing on market growth trajectories, technological advancements, and the shifting demands of end-users. The industry has witnessed a Compound Annual Growth Rate (CAGR) of approximately xx% during the historical period (2019-2024). This growth is largely attributed to increased defense budgets globally, the rising adoption of advanced weaponry, and ongoing modernization efforts across various armed forces. The report meticulously analyzes these trends, providing granular data on specific growth rates for different segments (Aircraft, Helicopters, UAVs; Missiles, Bombs). Technological advancements like the integration of smart munitions and improved precision guidance systems are highlighted, alongside the influence of evolving consumer demands for lighter, more efficient, and adaptable systems. The adoption of advanced technologies, such as AI-powered targeting systems, is predicted to further accelerate market growth. The increased focus on unmanned aerial vehicles (UAVs) and their associated carriage systems is a notable trend.
Leading Regions, Countries, or Segments in Weapons Carriage & Release Systems Industry
This section identifies the dominant regions, countries, and segments within the Weapons Carriage & Release Systems market. Based on our analysis, North America currently holds the largest market share, driven by significant defense spending and technological advancements.
- Key Drivers for North American Dominance:
- High defense budgets and robust R&D investments.
- Strong technological capabilities and innovation in the aerospace and defense sector.
- Presence of major industry players and a well-established supply chain.
- Favorable government policies and regulatory support.
The report also provides detailed insights into the performance of other key regions such as Europe and Asia-Pacific, analyzing factors contributing to their market share. Within weapon types, missiles command a significant share due to their strategic importance and ongoing development of advanced missile technologies. The aircraft platform segment also showcases robust growth due to modernization programs and ongoing fleet expansions.
Weapons Carriage & Release Systems Industry Product Innovations
Recent years have witnessed significant product innovations within the Weapons Carriage & Release Systems industry. These innovations primarily focus on enhanced precision, reduced weight, improved reliability, and increased adaptability across different platforms. The integration of advanced materials, such as lightweight composites, alongside improved software and control systems has resulted in more efficient and effective weapon delivery systems. The development of smart munitions with improved guidance capabilities and enhanced targeting accuracy is another key trend. These innovations contribute significantly to the unique selling propositions of leading industry players, allowing them to stand out and compete effectively.
Propelling Factors for Weapons Carriage & Release Systems Industry Growth
Several key factors drive the growth of the Weapons Carriage & Release Systems industry. Firstly, increasing global defense spending, particularly in regions experiencing geopolitical instability, fuels demand for advanced weaponry and improved delivery systems. Secondly, technological advancements, such as AI integration and improved precision guidance, enhance the effectiveness and efficiency of weapons carriage and release systems, pushing market expansion. Finally, supportive government policies and regulations incentivize innovation and the adoption of new technologies within the defense sector, providing a crucial impetus for growth.
Obstacles in the Weapons Carriage & Release Systems Industry Market
Despite the positive outlook, the Weapons Carriage & Release Systems industry faces certain challenges. Stringent regulatory frameworks related to weapon exports and safety standards can hinder market growth in certain regions. Furthermore, disruptions in the global supply chain, particularly concerning specialized components and materials, can lead to production delays and increased costs. Intense competition amongst established players, coupled with the emergence of new entrants, creates pressure on pricing and margins. These challenges influence market dynamics and growth trajectory, necessitating proactive measures from industry players.
Future Opportunities in Weapons Carriage & Release Systems Industry
The Weapons Carriage & Release Systems industry presents significant future opportunities. Emerging markets, particularly in Asia-Pacific and the Middle East, are projected to drive considerable growth due to increased defense modernization initiatives. The development of autonomous weapons systems and the integration of AI for enhanced situational awareness present key growth avenues. The continued focus on UAV technologies and the expansion of their applications within both military and civilian sectors offer promising opportunities for innovation and market expansion.
Major Players in the Weapons Carriage & Release Systems Industry Ecosystem
- The Marvin Group
- L3Harris Technologies Inc
- Systima Technologies Inc (Karman Space & Defense)
- Cobham Limited
- Moog Inc
- RTX Corporation
- Alkan
- Marotta Controls Inc
Key Developments in Weapons Carriage & Release Systems Industry Industry
- 2023-Q3: L3Harris Technologies announced a new generation of smart bomb guidance kits.
- 2022-Q4: RTX Corporation acquired a smaller competitor, expanding its product portfolio.
- 2021-Q2: Moog Inc. launched a new precision release system for UAVs.
- 2020-Q1: Significant investments in R&D were made across the industry, focusing on AI and automation.
Strategic Weapons Carriage & Release Systems Industry Market Forecast
The Weapons Carriage & Release Systems market is poised for substantial growth in the coming years, driven by a multitude of factors. Continued investment in defense modernization programs across various countries will sustain strong demand for advanced systems. The integration of new technologies, such as AI and autonomous capabilities, will further improve system efficiency and effectiveness. Opportunities within emerging markets, combined with the continued development of more sophisticated munitions, point to a robust and expanding market with significant potential for industry players in the forecast period (2025-2033).
Weapons Carriage & Release Systems Industry Segmentation
-
1. Platform
- 1.1. Aircraft
- 1.2. Helicopters
- 1.3. Unmanned Aerial Vehicles
-
2. Weapon Type
- 2.1. Missiles
- 2.2. Bombs
- 3. Geography
-
4. North America
- 4.1. United States
- 4.2. Canada
-
5. Europe
- 5.1. United Kingdom
- 5.2. France
- 5.3. Germany
- 5.4. Russia
- 5.5. Rest of Europe
-
6. Asia-Pacific
- 6.1. China
- 6.2. India
- 6.3. Japan
- 6.4. South Korea
- 6.5. Rest of Asia-Pacific
-
7. Latin America
- 7.1. Brazil
- 7.2. Mexico
- 7.3. Rest of Latin America
-
8. Middle East and Africa
- 8.1. United Arab Emirates
- 8.2. Saudi Arabia
- 8.3. Turkey
- 8.4. South Africa
- 8.5. Rest of Middle East and Africa
Weapons Carriage & Release Systems Industry Segmentation By Geography
-
1. North America
- 1.1. United States
- 1.2. Canada
- 1.3. Mexico
-
2. South America
- 2.1. Brazil
- 2.2. Argentina
- 2.3. Rest of South America
-
3. Europe
- 3.1. United Kingdom
- 3.2. Germany
- 3.3. France
- 3.4. Italy
- 3.5. Spain
- 3.6. Russia
- 3.7. Benelux
- 3.8. Nordics
- 3.9. Rest of Europe
-
4. Middle East & Africa
- 4.1. Turkey
- 4.2. Israel
- 4.3. GCC
- 4.4. North Africa
- 4.5. South Africa
- 4.6. Rest of Middle East & Africa
-
5. Asia Pacific
- 5.1. China
- 5.2. India
- 5.3. Japan
- 5.4. South Korea
- 5.5. ASEAN
- 5.6. Oceania
- 5.7. Rest of Asia Pacific

Weapons Carriage & Release Systems Industry Regional Market Share
Geographic Coverage of Weapons Carriage & Release Systems Industry
Weapons Carriage & Release Systems Industry REPORT HIGHLIGHTS
| Aspects | Details |
|---|---|
| Study Period | 2020-2034 |
| Base Year | 2025 |
| Estimated Year | 2026 |
| Forecast Period | 2026-2034 |
| Historical Period | 2020-2025 |
| Growth Rate | CAGR of 4.19% from 2020-2034 |
| Segmentation |
|
Table of Contents
- 1. Introduction
- 1.1. Research Scope
- 1.2. Market Segmentation
- 1.3. Research Methodology
- 1.4. Definitions and Assumptions
- 2. Executive Summary
- 2.1. Introduction
- 3. Market Dynamics
- 3.1. Introduction
- 3.2. Market Drivers
- 3.3. Market Restrains
- 3.4. Market Trends
- 3.4.1. Aircraft Platform to Dominate the Market
- 4. Market Factor Analysis
- 4.1. Porters Five Forces
- 4.2. Supply/Value Chain
- 4.3. PESTEL analysis
- 4.4. Market Entropy
- 4.5. Patent/Trademark Analysis
- 5. Global Weapons Carriage & Release Systems Industry Analysis, Insights and Forecast, 2020-2032
- 5.1. Market Analysis, Insights and Forecast - by Platform
- 5.1.1. Aircraft
- 5.1.2. Helicopters
- 5.1.3. Unmanned Aerial Vehicles
- 5.2. Market Analysis, Insights and Forecast - by Weapon Type
- 5.2.1. Missiles
- 5.2.2. Bombs
- 5.3. Market Analysis, Insights and Forecast - by Geography
- 5.4. Market Analysis, Insights and Forecast - by North America
- 5.4.1. United States
- 5.4.2. Canada
- 5.5. Market Analysis, Insights and Forecast - by Europe
- 5.5.1. United Kingdom
- 5.5.2. France
- 5.5.3. Germany
- 5.5.4. Russia
- 5.5.5. Rest of Europe
- 5.6. Market Analysis, Insights and Forecast - by Asia-Pacific
- 5.6.1. China
- 5.6.2. India
- 5.6.3. Japan
- 5.6.4. South Korea
- 5.6.5. Rest of Asia-Pacific
- 5.7. Market Analysis, Insights and Forecast - by Latin America
- 5.7.1. Brazil
- 5.7.2. Mexico
- 5.7.3. Rest of Latin America
- 5.8. Market Analysis, Insights and Forecast - by Middle East and Africa
- 5.8.1. United Arab Emirates
- 5.8.2. Saudi Arabia
- 5.8.3. Turkey
- 5.8.4. South Africa
- 5.8.5. Rest of Middle East and Africa
- 5.9. Market Analysis, Insights and Forecast - by Region
- 5.9.1. North America
- 5.9.2. South America
- 5.9.3. Europe
- 5.9.4. Middle East & Africa
- 5.9.5. Asia Pacific
- 5.1. Market Analysis, Insights and Forecast - by Platform
- 6. North America Weapons Carriage & Release Systems Industry Analysis, Insights and Forecast, 2020-2032
- 6.1. Market Analysis, Insights and Forecast - by Platform
- 6.1.1. Aircraft
- 6.1.2. Helicopters
- 6.1.3. Unmanned Aerial Vehicles
- 6.2. Market Analysis, Insights and Forecast - by Weapon Type
- 6.2.1. Missiles
- 6.2.2. Bombs
- 6.3. Market Analysis, Insights and Forecast - by Geography
- 6.4. Market Analysis, Insights and Forecast - by North America
- 6.4.1. United States
- 6.4.2. Canada
- 6.5. Market Analysis, Insights and Forecast - by Europe
- 6.5.1. United Kingdom
- 6.5.2. France
- 6.5.3. Germany
- 6.5.4. Russia
- 6.5.5. Rest of Europe
- 6.6. Market Analysis, Insights and Forecast - by Asia-Pacific
- 6.6.1. China
- 6.6.2. India
- 6.6.3. Japan
- 6.6.4. South Korea
- 6.6.5. Rest of Asia-Pacific
- 6.7. Market Analysis, Insights and Forecast - by Latin America
- 6.7.1. Brazil
- 6.7.2. Mexico
- 6.7.3. Rest of Latin America
- 6.8. Market Analysis, Insights and Forecast - by Middle East and Africa
- 6.8.1. United Arab Emirates
- 6.8.2. Saudi Arabia
- 6.8.3. Turkey
- 6.8.4. South Africa
- 6.8.5. Rest of Middle East and Africa
- 6.1. Market Analysis, Insights and Forecast - by Platform
- 7. South America Weapons Carriage & Release Systems Industry Analysis, Insights and Forecast, 2020-2032
- 7.1. Market Analysis, Insights and Forecast - by Platform
- 7.1.1. Aircraft
- 7.1.2. Helicopters
- 7.1.3. Unmanned Aerial Vehicles
- 7.2. Market Analysis, Insights and Forecast - by Weapon Type
- 7.2.1. Missiles
- 7.2.2. Bombs
- 7.3. Market Analysis, Insights and Forecast - by Geography
- 7.4. Market Analysis, Insights and Forecast - by North America
- 7.4.1. United States
- 7.4.2. Canada
- 7.5. Market Analysis, Insights and Forecast - by Europe
- 7.5.1. United Kingdom
- 7.5.2. France
- 7.5.3. Germany
- 7.5.4. Russia
- 7.5.5. Rest of Europe
- 7.6. Market Analysis, Insights and Forecast - by Asia-Pacific
- 7.6.1. China
- 7.6.2. India
- 7.6.3. Japan
- 7.6.4. South Korea
- 7.6.5. Rest of Asia-Pacific
- 7.7. Market Analysis, Insights and Forecast - by Latin America
- 7.7.1. Brazil
- 7.7.2. Mexico
- 7.7.3. Rest of Latin America
- 7.8. Market Analysis, Insights and Forecast - by Middle East and Africa
- 7.8.1. United Arab Emirates
- 7.8.2. Saudi Arabia
- 7.8.3. Turkey
- 7.8.4. South Africa
- 7.8.5. Rest of Middle East and Africa
- 7.1. Market Analysis, Insights and Forecast - by Platform
- 8. Europe Weapons Carriage & Release Systems Industry Analysis, Insights and Forecast, 2020-2032
- 8.1. Market Analysis, Insights and Forecast - by Platform
- 8.1.1. Aircraft
- 8.1.2. Helicopters
- 8.1.3. Unmanned Aerial Vehicles
- 8.2. Market Analysis, Insights and Forecast - by Weapon Type
- 8.2.1. Missiles
- 8.2.2. Bombs
- 8.3. Market Analysis, Insights and Forecast - by Geography
- 8.4. Market Analysis, Insights and Forecast - by North America
- 8.4.1. United States
- 8.4.2. Canada
- 8.5. Market Analysis, Insights and Forecast - by Europe
- 8.5.1. United Kingdom
- 8.5.2. France
- 8.5.3. Germany
- 8.5.4. Russia
- 8.5.5. Rest of Europe
- 8.6. Market Analysis, Insights and Forecast - by Asia-Pacific
- 8.6.1. China
- 8.6.2. India
- 8.6.3. Japan
- 8.6.4. South Korea
- 8.6.5. Rest of Asia-Pacific
- 8.7. Market Analysis, Insights and Forecast - by Latin America
- 8.7.1. Brazil
- 8.7.2. Mexico
- 8.7.3. Rest of Latin America
- 8.8. Market Analysis, Insights and Forecast - by Middle East and Africa
- 8.8.1. United Arab Emirates
- 8.8.2. Saudi Arabia
- 8.8.3. Turkey
- 8.8.4. South Africa
- 8.8.5. Rest of Middle East and Africa
- 8.1. Market Analysis, Insights and Forecast - by Platform
- 9. Middle East & Africa Weapons Carriage & Release Systems Industry Analysis, Insights and Forecast, 2020-2032
- 9.1. Market Analysis, Insights and Forecast - by Platform
- 9.1.1. Aircraft
- 9.1.2. Helicopters
- 9.1.3. Unmanned Aerial Vehicles
- 9.2. Market Analysis, Insights and Forecast - by Weapon Type
- 9.2.1. Missiles
- 9.2.2. Bombs
- 9.3. Market Analysis, Insights and Forecast - by Geography
- 9.4. Market Analysis, Insights and Forecast - by North America
- 9.4.1. United States
- 9.4.2. Canada
- 9.5. Market Analysis, Insights and Forecast - by Europe
- 9.5.1. United Kingdom
- 9.5.2. France
- 9.5.3. Germany
- 9.5.4. Russia
- 9.5.5. Rest of Europe
- 9.6. Market Analysis, Insights and Forecast - by Asia-Pacific
- 9.6.1. China
- 9.6.2. India
- 9.6.3. Japan
- 9.6.4. South Korea
- 9.6.5. Rest of Asia-Pacific
- 9.7. Market Analysis, Insights and Forecast - by Latin America
- 9.7.1. Brazil
- 9.7.2. Mexico
- 9.7.3. Rest of Latin America
- 9.8. Market Analysis, Insights and Forecast - by Middle East and Africa
- 9.8.1. United Arab Emirates
- 9.8.2. Saudi Arabia
- 9.8.3. Turkey
- 9.8.4. South Africa
- 9.8.5. Rest of Middle East and Africa
- 9.1. Market Analysis, Insights and Forecast - by Platform
- 10. Asia Pacific Weapons Carriage & Release Systems Industry Analysis, Insights and Forecast, 2020-2032
- 10.1. Market Analysis, Insights and Forecast - by Platform
- 10.1.1. Aircraft
- 10.1.2. Helicopters
- 10.1.3. Unmanned Aerial Vehicles
- 10.2. Market Analysis, Insights and Forecast - by Weapon Type
- 10.2.1. Missiles
- 10.2.2. Bombs
- 10.3. Market Analysis, Insights and Forecast - by Geography
- 10.4. Market Analysis, Insights and Forecast - by North America
- 10.4.1. United States
- 10.4.2. Canada
- 10.5. Market Analysis, Insights and Forecast - by Europe
- 10.5.1. United Kingdom
- 10.5.2. France
- 10.5.3. Germany
- 10.5.4. Russia
- 10.5.5. Rest of Europe
- 10.6. Market Analysis, Insights and Forecast - by Asia-Pacific
- 10.6.1. China
- 10.6.2. India
- 10.6.3. Japan
- 10.6.4. South Korea
- 10.6.5. Rest of Asia-Pacific
- 10.7. Market Analysis, Insights and Forecast - by Latin America
- 10.7.1. Brazil
- 10.7.2. Mexico
- 10.7.3. Rest of Latin America
- 10.8. Market Analysis, Insights and Forecast - by Middle East and Africa
- 10.8.1. United Arab Emirates
- 10.8.2. Saudi Arabia
- 10.8.3. Turkey
- 10.8.4. South Africa
- 10.8.5. Rest of Middle East and Africa
- 10.1. Market Analysis, Insights and Forecast - by Platform
- 11. Competitive Analysis
- 11.1. Global Market Share Analysis 2025
- 11.2. Company Profiles
- 11.2.1 The Marvin Group
- 11.2.1.1. Overview
- 11.2.1.2. Products
- 11.2.1.3. SWOT Analysis
- 11.2.1.4. Recent Developments
- 11.2.1.5. Financials (Based on Availability)
- 11.2.2 L3Harris Technologies Inc
- 11.2.2.1. Overview
- 11.2.2.2. Products
- 11.2.2.3. SWOT Analysis
- 11.2.2.4. Recent Developments
- 11.2.2.5. Financials (Based on Availability)
- 11.2.3 Systima Technologies Inc (Karman Space & Defense
- 11.2.3.1. Overview
- 11.2.3.2. Products
- 11.2.3.3. SWOT Analysis
- 11.2.3.4. Recent Developments
- 11.2.3.5. Financials (Based on Availability)
- 11.2.4 Cobham Limited
- 11.2.4.1. Overview
- 11.2.4.2. Products
- 11.2.4.3. SWOT Analysis
- 11.2.4.4. Recent Developments
- 11.2.4.5. Financials (Based on Availability)
- 11.2.5 Moog Inc
- 11.2.5.1. Overview
- 11.2.5.2. Products
- 11.2.5.3. SWOT Analysis
- 11.2.5.4. Recent Developments
- 11.2.5.5. Financials (Based on Availability)
- 11.2.6 RTX Corporation
- 11.2.6.1. Overview
- 11.2.6.2. Products
- 11.2.6.3. SWOT Analysis
- 11.2.6.4. Recent Developments
- 11.2.6.5. Financials (Based on Availability)
- 11.2.7 Alkan
- 11.2.7.1. Overview
- 11.2.7.2. Products
- 11.2.7.3. SWOT Analysis
- 11.2.7.4. Recent Developments
- 11.2.7.5. Financials (Based on Availability)
- 11.2.8 Marotta Controls Inc
- 11.2.8.1. Overview
- 11.2.8.2. Products
- 11.2.8.3. SWOT Analysis
- 11.2.8.4. Recent Developments
- 11.2.8.5. Financials (Based on Availability)
- 11.2.1 The Marvin Group
List of Figures
- Figure 1: Global Weapons Carriage & Release Systems Industry Revenue Breakdown (Million, %) by Region 2025 & 2033
- Figure 2: North America Weapons Carriage & Release Systems Industry Revenue (Million), by Platform 2025 & 2033
- Figure 3: North America Weapons Carriage & Release Systems Industry Revenue Share (%), by Platform 2025 & 2033
- Figure 4: North America Weapons Carriage & Release Systems Industry Revenue (Million), by Weapon Type 2025 & 2033
- Figure 5: North America Weapons Carriage & Release Systems Industry Revenue Share (%), by Weapon Type 2025 & 2033
- Figure 6: North America Weapons Carriage & Release Systems Industry Revenue (Million), by Geography 2025 & 2033
- Figure 7: North America Weapons Carriage & Release Systems Industry Revenue Share (%), by Geography 2025 & 2033
- Figure 8: North America Weapons Carriage & Release Systems Industry Revenue (Million), by North America 2025 & 2033
- Figure 9: North America Weapons Carriage & Release Systems Industry Revenue Share (%), by North America 2025 & 2033
- Figure 10: North America Weapons Carriage & Release Systems Industry Revenue (Million), by Europe 2025 & 2033
- Figure 11: North America Weapons Carriage & Release Systems Industry Revenue Share (%), by Europe 2025 & 2033
- Figure 12: North America Weapons Carriage & Release Systems Industry Revenue (Million), by Asia-Pacific 2025 & 2033
- Figure 13: North America Weapons Carriage & Release Systems Industry Revenue Share (%), by Asia-Pacific 2025 & 2033
- Figure 14: North America Weapons Carriage & Release Systems Industry Revenue (Million), by Latin America 2025 & 2033
- Figure 15: North America Weapons Carriage & Release Systems Industry Revenue Share (%), by Latin America 2025 & 2033
- Figure 16: North America Weapons Carriage & Release Systems Industry Revenue (Million), by Middle East and Africa 2025 & 2033
- Figure 17: North America Weapons Carriage & Release Systems Industry Revenue Share (%), by Middle East and Africa 2025 & 2033
- Figure 18: North America Weapons Carriage & Release Systems Industry Revenue (Million), by Country 2025 & 2033
- Figure 19: North America Weapons Carriage & Release Systems Industry Revenue Share (%), by Country 2025 & 2033
- Figure 20: South America Weapons Carriage & Release Systems Industry Revenue (Million), by Platform 2025 & 2033
- Figure 21: South America Weapons Carriage & Release Systems Industry Revenue Share (%), by Platform 2025 & 2033
- Figure 22: South America Weapons Carriage & Release Systems Industry Revenue (Million), by Weapon Type 2025 & 2033
- Figure 23: South America Weapons Carriage & Release Systems Industry Revenue Share (%), by Weapon Type 2025 & 2033
- Figure 24: South America Weapons Carriage & Release Systems Industry Revenue (Million), by Geography 2025 & 2033
- Figure 25: South America Weapons Carriage & Release Systems Industry Revenue Share (%), by Geography 2025 & 2033
- Figure 26: South America Weapons Carriage & Release Systems Industry Revenue (Million), by North America 2025 & 2033
- Figure 27: South America Weapons Carriage & Release Systems Industry Revenue Share (%), by North America 2025 & 2033
- Figure 28: South America Weapons Carriage & Release Systems Industry Revenue (Million), by Europe 2025 & 2033
- Figure 29: South America Weapons Carriage & Release Systems Industry Revenue Share (%), by Europe 2025 & 2033
- Figure 30: South America Weapons Carriage & Release Systems Industry Revenue (Million), by Asia-Pacific 2025 & 2033
- Figure 31: South America Weapons Carriage & Release Systems Industry Revenue Share (%), by Asia-Pacific 2025 & 2033
- Figure 32: South America Weapons Carriage & Release Systems Industry Revenue (Million), by Latin America 2025 & 2033
- Figure 33: South America Weapons Carriage & Release Systems Industry Revenue Share (%), by Latin America 2025 & 2033
- Figure 34: South America Weapons Carriage & Release Systems Industry Revenue (Million), by Middle East and Africa 2025 & 2033
- Figure 35: South America Weapons Carriage & Release Systems Industry Revenue Share (%), by Middle East and Africa 2025 & 2033
- Figure 36: South America Weapons Carriage & Release Systems Industry Revenue (Million), by Country 2025 & 2033
- Figure 37: South America Weapons Carriage & Release Systems Industry Revenue Share (%), by Country 2025 & 2033
- Figure 38: Europe Weapons Carriage & Release Systems Industry Revenue (Million), by Platform 2025 & 2033
- Figure 39: Europe Weapons Carriage & Release Systems Industry Revenue Share (%), by Platform 2025 & 2033
- Figure 40: Europe Weapons Carriage & Release Systems Industry Revenue (Million), by Weapon Type 2025 & 2033
- Figure 41: Europe Weapons Carriage & Release Systems Industry Revenue Share (%), by Weapon Type 2025 & 2033
- Figure 42: Europe Weapons Carriage & Release Systems Industry Revenue (Million), by Geography 2025 & 2033
- Figure 43: Europe Weapons Carriage & Release Systems Industry Revenue Share (%), by Geography 2025 & 2033
- Figure 44: Europe Weapons Carriage & Release Systems Industry Revenue (Million), by North America 2025 & 2033
- Figure 45: Europe Weapons Carriage & Release Systems Industry Revenue Share (%), by North America 2025 & 2033
- Figure 46: Europe Weapons Carriage & Release Systems Industry Revenue (Million), by Europe 2025 & 2033
- Figure 47: Europe Weapons Carriage & Release Systems Industry Revenue Share (%), by Europe 2025 & 2033
- Figure 48: Europe Weapons Carriage & Release Systems Industry Revenue (Million), by Asia-Pacific 2025 & 2033
- Figure 49: Europe Weapons Carriage & Release Systems Industry Revenue Share (%), by Asia-Pacific 2025 & 2033
- Figure 50: Europe Weapons Carriage & Release Systems Industry Revenue (Million), by Latin America 2025 & 2033
- Figure 51: Europe Weapons Carriage & Release Systems Industry Revenue Share (%), by Latin America 2025 & 2033
- Figure 52: Europe Weapons Carriage & Release Systems Industry Revenue (Million), by Middle East and Africa 2025 & 2033
- Figure 53: Europe Weapons Carriage & Release Systems Industry Revenue Share (%), by Middle East and Africa 2025 & 2033
- Figure 54: Europe Weapons Carriage & Release Systems Industry Revenue (Million), by Country 2025 & 2033
- Figure 55: Europe Weapons Carriage & Release Systems Industry Revenue Share (%), by Country 2025 & 2033
- Figure 56: Middle East & Africa Weapons Carriage & Release Systems Industry Revenue (Million), by Platform 2025 & 2033
- Figure 57: Middle East & Africa Weapons Carriage & Release Systems Industry Revenue Share (%), by Platform 2025 & 2033
- Figure 58: Middle East & Africa Weapons Carriage & Release Systems Industry Revenue (Million), by Weapon Type 2025 & 2033
- Figure 59: Middle East & Africa Weapons Carriage & Release Systems Industry Revenue Share (%), by Weapon Type 2025 & 2033
- Figure 60: Middle East & Africa Weapons Carriage & Release Systems Industry Revenue (Million), by Geography 2025 & 2033
- Figure 61: Middle East & Africa Weapons Carriage & Release Systems Industry Revenue Share (%), by Geography 2025 & 2033
- Figure 62: Middle East & Africa Weapons Carriage & Release Systems Industry Revenue (Million), by North America 2025 & 2033
- Figure 63: Middle East & Africa Weapons Carriage & Release Systems Industry Revenue Share (%), by North America 2025 & 2033
- Figure 64: Middle East & Africa Weapons Carriage & Release Systems Industry Revenue (Million), by Europe 2025 & 2033
- Figure 65: Middle East & Africa Weapons Carriage & Release Systems Industry Revenue Share (%), by Europe 2025 & 2033
- Figure 66: Middle East & Africa Weapons Carriage & Release Systems Industry Revenue (Million), by Asia-Pacific 2025 & 2033
- Figure 67: Middle East & Africa Weapons Carriage & Release Systems Industry Revenue Share (%), by Asia-Pacific 2025 & 2033
- Figure 68: Middle East & Africa Weapons Carriage & Release Systems Industry Revenue (Million), by Latin America 2025 & 2033
- Figure 69: Middle East & Africa Weapons Carriage & Release Systems Industry Revenue Share (%), by Latin America 2025 & 2033
- Figure 70: Middle East & Africa Weapons Carriage & Release Systems Industry Revenue (Million), by Middle East and Africa 2025 & 2033
- Figure 71: Middle East & Africa Weapons Carriage & Release Systems Industry Revenue Share (%), by Middle East and Africa 2025 & 2033
- Figure 72: Middle East & Africa Weapons Carriage & Release Systems Industry Revenue (Million), by Country 2025 & 2033
- Figure 73: Middle East & Africa Weapons Carriage & Release Systems Industry Revenue Share (%), by Country 2025 & 2033
- Figure 74: Asia Pacific Weapons Carriage & Release Systems Industry Revenue (Million), by Platform 2025 & 2033
- Figure 75: Asia Pacific Weapons Carriage & Release Systems Industry Revenue Share (%), by Platform 2025 & 2033
- Figure 76: Asia Pacific Weapons Carriage & Release Systems Industry Revenue (Million), by Weapon Type 2025 & 2033
- Figure 77: Asia Pacific Weapons Carriage & Release Systems Industry Revenue Share (%), by Weapon Type 2025 & 2033
- Figure 78: Asia Pacific Weapons Carriage & Release Systems Industry Revenue (Million), by Geography 2025 & 2033
- Figure 79: Asia Pacific Weapons Carriage & Release Systems Industry Revenue Share (%), by Geography 2025 & 2033
- Figure 80: Asia Pacific Weapons Carriage & Release Systems Industry Revenue (Million), by North America 2025 & 2033
- Figure 81: Asia Pacific Weapons Carriage & Release Systems Industry Revenue Share (%), by North America 2025 & 2033
- Figure 82: Asia Pacific Weapons Carriage & Release Systems Industry Revenue (Million), by Europe 2025 & 2033
- Figure 83: Asia Pacific Weapons Carriage & Release Systems Industry Revenue Share (%), by Europe 2025 & 2033
- Figure 84: Asia Pacific Weapons Carriage & Release Systems Industry Revenue (Million), by Asia-Pacific 2025 & 2033
- Figure 85: Asia Pacific Weapons Carriage & Release Systems Industry Revenue Share (%), by Asia-Pacific 2025 & 2033
- Figure 86: Asia Pacific Weapons Carriage & Release Systems Industry Revenue (Million), by Latin America 2025 & 2033
- Figure 87: Asia Pacific Weapons Carriage & Release Systems Industry Revenue Share (%), by Latin America 2025 & 2033
- Figure 88: Asia Pacific Weapons Carriage & Release Systems Industry Revenue (Million), by Middle East and Africa 2025 & 2033
- Figure 89: Asia Pacific Weapons Carriage & Release Systems Industry Revenue Share (%), by Middle East and Africa 2025 & 2033
- Figure 90: Asia Pacific Weapons Carriage & Release Systems Industry Revenue (Million), by Country 2025 & 2033
- Figure 91: Asia Pacific Weapons Carriage & Release Systems Industry Revenue Share (%), by Country 2025 & 2033
List of Tables
- Table 1: Global Weapons Carriage & Release Systems Industry Revenue Million Forecast, by Platform 2020 & 2033
- Table 2: Global Weapons Carriage & Release Systems Industry Revenue Million Forecast, by Weapon Type 2020 & 2033
- Table 3: Global Weapons Carriage & Release Systems Industry Revenue Million Forecast, by Geography 2020 & 2033
- Table 4: Global Weapons Carriage & Release Systems Industry Revenue Million Forecast, by North America 2020 & 2033
- Table 5: Global Weapons Carriage & Release Systems Industry Revenue Million Forecast, by Europe 2020 & 2033
- Table 6: Global Weapons Carriage & Release Systems Industry Revenue Million Forecast, by Asia-Pacific 2020 & 2033
- Table 7: Global Weapons Carriage & Release Systems Industry Revenue Million Forecast, by Latin America 2020 & 2033
- Table 8: Global Weapons Carriage & Release Systems Industry Revenue Million Forecast, by Middle East and Africa 2020 & 2033
- Table 9: Global Weapons Carriage & Release Systems Industry Revenue Million Forecast, by Region 2020 & 2033
- Table 10: Global Weapons Carriage & Release Systems Industry Revenue Million Forecast, by Platform 2020 & 2033
- Table 11: Global Weapons Carriage & Release Systems Industry Revenue Million Forecast, by Weapon Type 2020 & 2033
- Table 12: Global Weapons Carriage & Release Systems Industry Revenue Million Forecast, by Geography 2020 & 2033
- Table 13: Global Weapons Carriage & Release Systems Industry Revenue Million Forecast, by North America 2020 & 2033
- Table 14: Global Weapons Carriage & Release Systems Industry Revenue Million Forecast, by Europe 2020 & 2033
- Table 15: Global Weapons Carriage & Release Systems Industry Revenue Million Forecast, by Asia-Pacific 2020 & 2033
- Table 16: Global Weapons Carriage & Release Systems Industry Revenue Million Forecast, by Latin America 2020 & 2033
- Table 17: Global Weapons Carriage & Release Systems Industry Revenue Million Forecast, by Middle East and Africa 2020 & 2033
- Table 18: Global Weapons Carriage & Release Systems Industry Revenue Million Forecast, by Country 2020 & 2033
- Table 19: United States Weapons Carriage & Release Systems Industry Revenue (Million) Forecast, by Application 2020 & 2033
- Table 20: Canada Weapons Carriage & Release Systems Industry Revenue (Million) Forecast, by Application 2020 & 2033
- Table 21: Mexico Weapons Carriage & Release Systems Industry Revenue (Million) Forecast, by Application 2020 & 2033
- Table 22: Global Weapons Carriage & Release Systems Industry Revenue Million Forecast, by Platform 2020 & 2033
- Table 23: Global Weapons Carriage & Release Systems Industry Revenue Million Forecast, by Weapon Type 2020 & 2033
- Table 24: Global Weapons Carriage & Release Systems Industry Revenue Million Forecast, by Geography 2020 & 2033
- Table 25: Global Weapons Carriage & Release Systems Industry Revenue Million Forecast, by North America 2020 & 2033
- Table 26: Global Weapons Carriage & Release Systems Industry Revenue Million Forecast, by Europe 2020 & 2033
- Table 27: Global Weapons Carriage & Release Systems Industry Revenue Million Forecast, by Asia-Pacific 2020 & 2033
- Table 28: Global Weapons Carriage & Release Systems Industry Revenue Million Forecast, by Latin America 2020 & 2033
- Table 29: Global Weapons Carriage & Release Systems Industry Revenue Million Forecast, by Middle East and Africa 2020 & 2033
- Table 30: Global Weapons Carriage & Release Systems Industry Revenue Million Forecast, by Country 2020 & 2033
- Table 31: Brazil Weapons Carriage & Release Systems Industry Revenue (Million) Forecast, by Application 2020 & 2033
- Table 32: Argentina Weapons Carriage & Release Systems Industry Revenue (Million) Forecast, by Application 2020 & 2033
- Table 33: Rest of South America Weapons Carriage & Release Systems Industry Revenue (Million) Forecast, by Application 2020 & 2033
- Table 34: Global Weapons Carriage & Release Systems Industry Revenue Million Forecast, by Platform 2020 & 2033
- Table 35: Global Weapons Carriage & Release Systems Industry Revenue Million Forecast, by Weapon Type 2020 & 2033
- Table 36: Global Weapons Carriage & Release Systems Industry Revenue Million Forecast, by Geography 2020 & 2033
- Table 37: Global Weapons Carriage & Release Systems Industry Revenue Million Forecast, by North America 2020 & 2033
- Table 38: Global Weapons Carriage & Release Systems Industry Revenue Million Forecast, by Europe 2020 & 2033
- Table 39: Global Weapons Carriage & Release Systems Industry Revenue Million Forecast, by Asia-Pacific 2020 & 2033
- Table 40: Global Weapons Carriage & Release Systems Industry Revenue Million Forecast, by Latin America 2020 & 2033
- Table 41: Global Weapons Carriage & Release Systems Industry Revenue Million Forecast, by Middle East and Africa 2020 & 2033
- Table 42: Global Weapons Carriage & Release Systems Industry Revenue Million Forecast, by Country 2020 & 2033
- Table 43: United Kingdom Weapons Carriage & Release Systems Industry Revenue (Million) Forecast, by Application 2020 & 2033
- Table 44: Germany Weapons Carriage & Release Systems Industry Revenue (Million) Forecast, by Application 2020 & 2033
- Table 45: France Weapons Carriage & Release Systems Industry Revenue (Million) Forecast, by Application 2020 & 2033
- Table 46: Italy Weapons Carriage & Release Systems Industry Revenue (Million) Forecast, by Application 2020 & 2033
- Table 47: Spain Weapons Carriage & Release Systems Industry Revenue (Million) Forecast, by Application 2020 & 2033
- Table 48: Russia Weapons Carriage & Release Systems Industry Revenue (Million) Forecast, by Application 2020 & 2033
- Table 49: Benelux Weapons Carriage & Release Systems Industry Revenue (Million) Forecast, by Application 2020 & 2033
- Table 50: Nordics Weapons Carriage & Release Systems Industry Revenue (Million) Forecast, by Application 2020 & 2033
- Table 51: Rest of Europe Weapons Carriage & Release Systems Industry Revenue (Million) Forecast, by Application 2020 & 2033
- Table 52: Global Weapons Carriage & Release Systems Industry Revenue Million Forecast, by Platform 2020 & 2033
- Table 53: Global Weapons Carriage & Release Systems Industry Revenue Million Forecast, by Weapon Type 2020 & 2033
- Table 54: Global Weapons Carriage & Release Systems Industry Revenue Million Forecast, by Geography 2020 & 2033
- Table 55: Global Weapons Carriage & Release Systems Industry Revenue Million Forecast, by North America 2020 & 2033
- Table 56: Global Weapons Carriage & Release Systems Industry Revenue Million Forecast, by Europe 2020 & 2033
- Table 57: Global Weapons Carriage & Release Systems Industry Revenue Million Forecast, by Asia-Pacific 2020 & 2033
- Table 58: Global Weapons Carriage & Release Systems Industry Revenue Million Forecast, by Latin America 2020 & 2033
- Table 59: Global Weapons Carriage & Release Systems Industry Revenue Million Forecast, by Middle East and Africa 2020 & 2033
- Table 60: Global Weapons Carriage & Release Systems Industry Revenue Million Forecast, by Country 2020 & 2033
- Table 61: Turkey Weapons Carriage & Release Systems Industry Revenue (Million) Forecast, by Application 2020 & 2033
- Table 62: Israel Weapons Carriage & Release Systems Industry Revenue (Million) Forecast, by Application 2020 & 2033
- Table 63: GCC Weapons Carriage & Release Systems Industry Revenue (Million) Forecast, by Application 2020 & 2033
- Table 64: North Africa Weapons Carriage & Release Systems Industry Revenue (Million) Forecast, by Application 2020 & 2033
- Table 65: South Africa Weapons Carriage & Release Systems Industry Revenue (Million) Forecast, by Application 2020 & 2033
- Table 66: Rest of Middle East & Africa Weapons Carriage & Release Systems Industry Revenue (Million) Forecast, by Application 2020 & 2033
- Table 67: Global Weapons Carriage & Release Systems Industry Revenue Million Forecast, by Platform 2020 & 2033
- Table 68: Global Weapons Carriage & Release Systems Industry Revenue Million Forecast, by Weapon Type 2020 & 2033
- Table 69: Global Weapons Carriage & Release Systems Industry Revenue Million Forecast, by Geography 2020 & 2033
- Table 70: Global Weapons Carriage & Release Systems Industry Revenue Million Forecast, by North America 2020 & 2033
- Table 71: Global Weapons Carriage & Release Systems Industry Revenue Million Forecast, by Europe 2020 & 2033
- Table 72: Global Weapons Carriage & Release Systems Industry Revenue Million Forecast, by Asia-Pacific 2020 & 2033
- Table 73: Global Weapons Carriage & Release Systems Industry Revenue Million Forecast, by Latin America 2020 & 2033
- Table 74: Global Weapons Carriage & Release Systems Industry Revenue Million Forecast, by Middle East and Africa 2020 & 2033
- Table 75: Global Weapons Carriage & Release Systems Industry Revenue Million Forecast, by Country 2020 & 2033
- Table 76: China Weapons Carriage & Release Systems Industry Revenue (Million) Forecast, by Application 2020 & 2033
- Table 77: India Weapons Carriage & Release Systems Industry Revenue (Million) Forecast, by Application 2020 & 2033
- Table 78: Japan Weapons Carriage & Release Systems Industry Revenue (Million) Forecast, by Application 2020 & 2033
- Table 79: South Korea Weapons Carriage & Release Systems Industry Revenue (Million) Forecast, by Application 2020 & 2033
- Table 80: ASEAN Weapons Carriage & Release Systems Industry Revenue (Million) Forecast, by Application 2020 & 2033
- Table 81: Oceania Weapons Carriage & Release Systems Industry Revenue (Million) Forecast, by Application 2020 & 2033
- Table 82: Rest of Asia Pacific Weapons Carriage & Release Systems Industry Revenue (Million) Forecast, by Application 2020 & 2033
Frequently Asked Questions
1. What is the projected Compound Annual Growth Rate (CAGR) of the Weapons Carriage & Release Systems Industry?
The projected CAGR is approximately 4.19%.
2. Which companies are prominent players in the Weapons Carriage & Release Systems Industry?
Key companies in the market include The Marvin Group, L3Harris Technologies Inc, Systima Technologies Inc (Karman Space & Defense, Cobham Limited, Moog Inc, RTX Corporation, Alkan, Marotta Controls Inc.
3. What are the main segments of the Weapons Carriage & Release Systems Industry?
The market segments include Platform, Weapon Type, Geography, North America, Europe, Asia-Pacific, Latin America, Middle East and Africa.
4. Can you provide details about the market size?
The market size is estimated to be USD 409.12 Million as of 2022.
5. What are some drivers contributing to market growth?
N/A
6. What are the notable trends driving market growth?
Aircraft Platform to Dominate the Market.
7. Are there any restraints impacting market growth?
N/A
8. Can you provide examples of recent developments in the market?
N/A
9. What pricing options are available for accessing the report?
Pricing options include single-user, multi-user, and enterprise licenses priced at USD 4750, USD 5250, and USD 8750 respectively.
10. Is the market size provided in terms of value or volume?
The market size is provided in terms of value, measured in Million.
11. Are there any specific market keywords associated with the report?
Yes, the market keyword associated with the report is "Weapons Carriage & Release Systems Industry," which aids in identifying and referencing the specific market segment covered.
12. How do I determine which pricing option suits my needs best?
The pricing options vary based on user requirements and access needs. Individual users may opt for single-user licenses, while businesses requiring broader access may choose multi-user or enterprise licenses for cost-effective access to the report.
13. Are there any additional resources or data provided in the Weapons Carriage & Release Systems Industry report?
While the report offers comprehensive insights, it's advisable to review the specific contents or supplementary materials provided to ascertain if additional resources or data are available.
14. How can I stay updated on further developments or reports in the Weapons Carriage & Release Systems Industry?
To stay informed about further developments, trends, and reports in the Weapons Carriage & Release Systems Industry, consider subscribing to industry newsletters, following relevant companies and organizations, or regularly checking reputable industry news sources and publications.
Methodology
Step 1 - Identification of Relevant Samples Size from Population Database


Step 2 - Approaches for Defining Global Market Size (Value, Volume* & Price*)

Note*: In applicable scenarios
Step 3 - Data Sources
Primary Research
- Web Analytics
- Survey Reports
- Research Institute
- Latest Research Reports
- Opinion Leaders
Secondary Research
- Annual Reports
- White Paper
- Latest Press Release
- Industry Association
- Paid Database
- Investor Presentations

Step 4 - Data Triangulation
Involves using different sources of information in order to increase the validity of a study
These sources are likely to be stakeholders in a program - participants, other researchers, program staff, other community members, and so on.
Then we put all data in single framework & apply various statistical tools to find out the dynamic on the market.
During the analysis stage, feedback from the stakeholder groups would be compared to determine areas of agreement as well as areas of divergence