

Key Insights
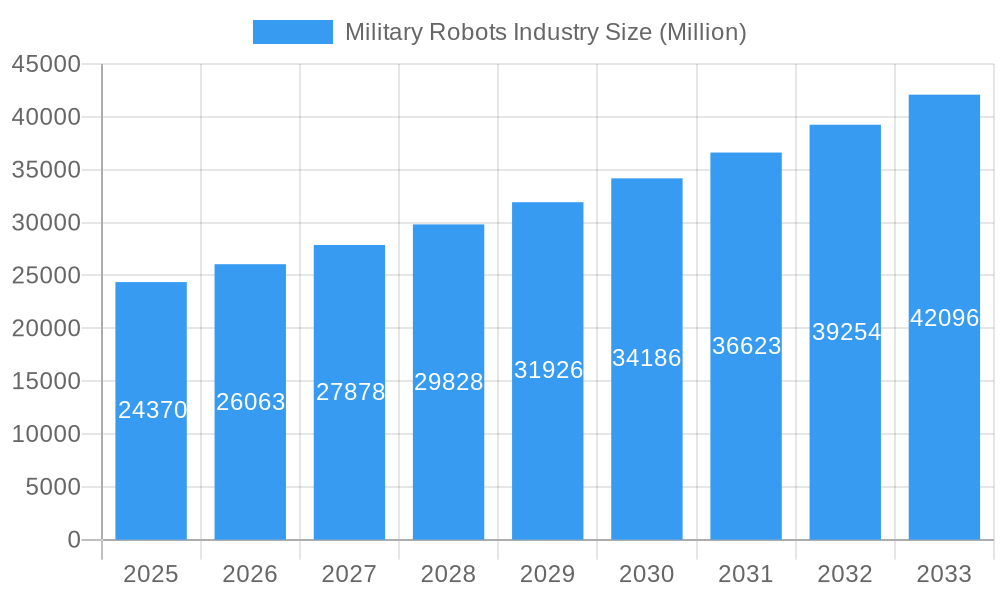
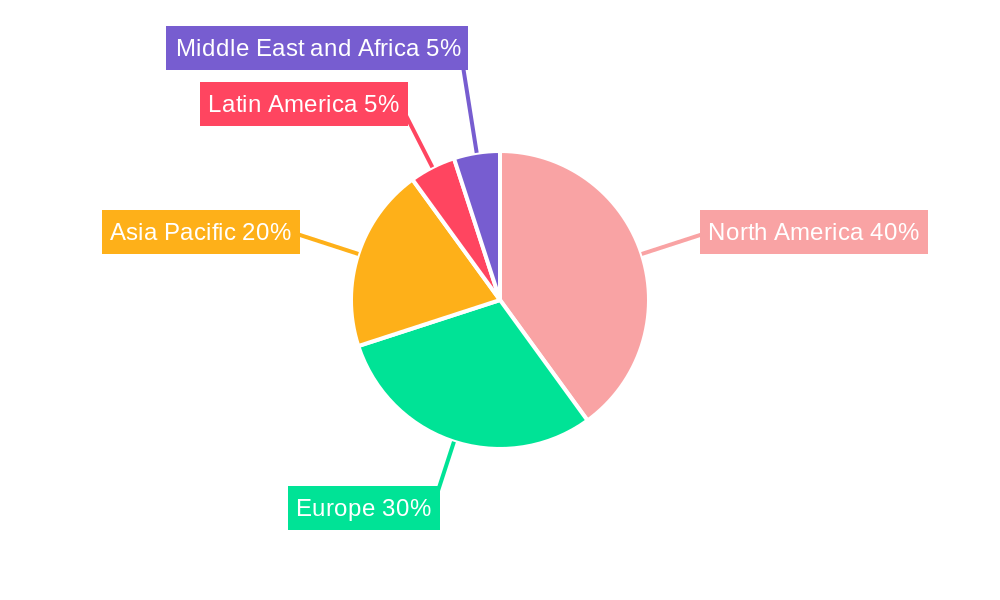
The global military robots market, valued at $24.37 billion in 2025, is projected to experience robust growth, driven by increasing defense budgets worldwide and the escalating demand for unmanned systems in diverse military operations. The market's Compound Annual Growth Rate (CAGR) of 6.97% from 2025 to 2033 signifies a significant expansion, fueled by technological advancements in robotics, artificial intelligence (AI), and autonomous navigation. Key growth drivers include the need for minimizing human casualties in hazardous environments, enhancing operational efficiency through automation, and the rising adoption of sophisticated surveillance and reconnaissance robots. The market segmentation reveals a diverse landscape with land, marine, and airborne platforms witnessing significant growth, while the autonomous segment is anticipated to outpace human-operated systems due to enhanced capabilities and reduced reliance on human operators. Geopolitically, North America and Europe are currently leading the market, but the Asia-Pacific region is expected to witness substantial growth, driven by increasing military modernization efforts and technological investments from countries such as China and India.
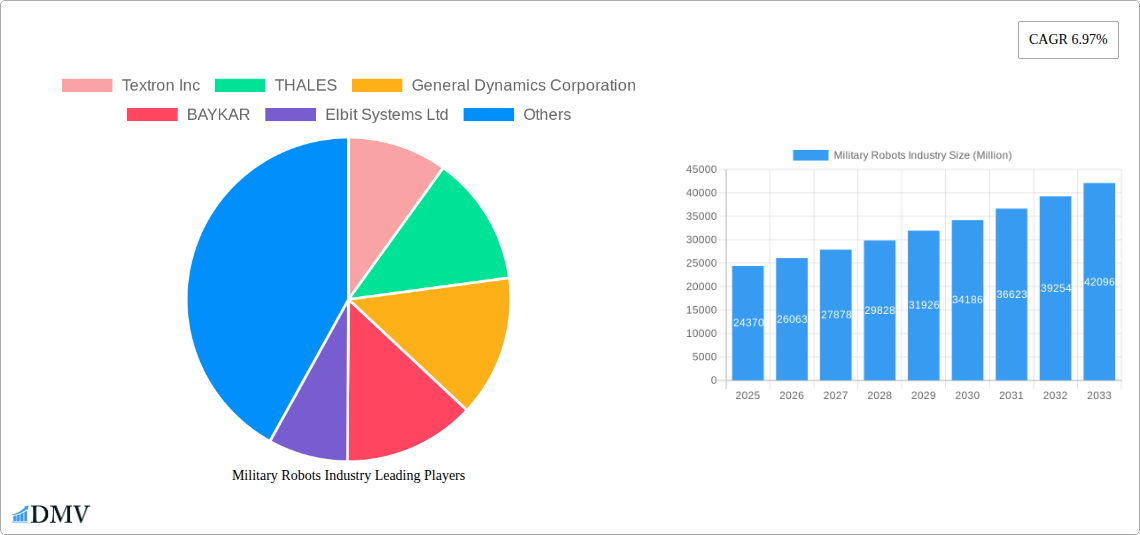
Military Robots Industry Market Size (In Billion)
The competitive landscape is highly concentrated, with major players like Textron, Thales, General Dynamics, and Lockheed Martin dominating the market. However, smaller companies specializing in niche technologies and autonomous systems are also gaining traction, fostering innovation and competition. Challenges include the high initial investment costs associated with developing and deploying advanced military robots, ethical concerns related to autonomous weapons systems, and the need for robust cybersecurity measures to prevent potential vulnerabilities. Nevertheless, ongoing technological improvements and strategic investments are expected to mitigate these challenges and propel the market toward significant expansion in the coming years. The increasing integration of AI and machine learning will further enhance the capabilities of military robots, driving demand across various applications, including bomb disposal, surveillance, and combat operations.
Military Robots Industry Company Market Share
Military Robots Industry: A Comprehensive Market Report (2019-2033)
This insightful report provides a detailed analysis of the Military Robots industry, encompassing market trends, technological advancements, key players, and future growth prospects. With a study period spanning 2019-2033, a base year of 2025, and a forecast period of 2025-2033, this report offers critical intelligence for stakeholders seeking to navigate this rapidly evolving sector. The market is expected to reach xx Million by 2033, driven by increasing defense budgets and technological innovation.
Military Robots Industry Market Composition & Trends
The Military Robots market is characterized by moderate concentration, with a handful of major players holding significant market share. However, the landscape is dynamic, with ongoing mergers and acquisitions (M&A) reshaping the competitive structure. Innovation is a key driver, fueled by advancements in artificial intelligence (AI), robotics, and sensor technologies. The regulatory landscape varies across regions, impacting adoption rates and product development. Substitute products are limited, enhancing the market’s overall growth potential. End-users primarily comprise national armed forces and governmental agencies.
- Market Share Distribution (2024 Estimate): The top 5 players hold approximately 60% of the market share. Precise figures are unavailable due to the confidential nature of some military contracts.
- M&A Activity (2019-2024): Over xx Million USD was invested in M&A activities within the sector. This includes several strategic acquisitions aimed at expanding product portfolios and geographical reach.
- Innovation Catalysts: AI-powered autonomy, improved sensor integration, and miniaturization of robotic systems are driving significant innovation.
- Regulatory Landscape: Government regulations concerning the ethical use and deployment of autonomous military robots are increasingly influencing market dynamics.
Military Robots Industry Industry Evolution
The Military Robots industry has experienced substantial growth in recent years, driven by the increasing demand for unmanned systems in military operations. Technological advancements such as improved AI algorithms, enhanced sensor capabilities, and more robust platforms have fueled this growth. The market has seen a shift toward autonomous systems, reducing reliance on human operators in hazardous environments. Growth rates are projected to remain strong throughout the forecast period, driven by increased defense spending globally and a continuing focus on technological advancement. Adoption rates are rising, with the number of robots deployed by military forces worldwide increasing significantly. Between 2019 and 2024, the market witnessed an estimated Compound Annual Growth Rate (CAGR) of xx%, reaching xx Million in 2024. The forecast for 2025-2033 predicts a CAGR of xx%, reaching xx Million by 2033.
Leading Regions, Countries, or Segments in Military Robots Industry
The North American region currently dominates the Military Robots market, driven by substantial defense spending and technological advancements. Within this region, the US holds the largest market share. Other significant markets include Europe and Asia-Pacific. Within platform segments, the Land segment is currently the most dominant, but growth is expected to be significant in the Airborne segment due to the increased demand for drones and Unmanned Aerial Vehicles (UAVs). In terms of operation mode, Human Operated systems still hold a larger share of the market, although Autonomous systems are rapidly gaining ground.
- Key Drivers for North American Dominance:
- High defense budgets
- Robust technological infrastructure
- Strong private sector involvement
- Supportive regulatory environment
- Land Segment Dominance:
- Versatility in various terrains and operational scenarios.
- Easier integration with existing military infrastructure.
- High demand for ground reconnaissance and combat support.
- Growth of Autonomous Systems:
- Reduced human risk in hazardous situations.
- Potential for improved efficiency and precision.
- Enhanced operational capabilities in diverse scenarios.
Military Robots Industry Product Innovations
Recent innovations include more robust and adaptable platforms, advanced AI-powered navigation and target recognition systems, and improved communication capabilities. These advancements enhance operational effectiveness, reducing reliance on human intervention and improving situational awareness. Miniaturization of robotic systems enables increased deployment flexibility, while enhanced payload capacity extends the range of potential missions. Unique selling propositions revolve around greater autonomy, higher precision, and reduced risk to human personnel.
Propelling Factors for Military Robots Industry Growth
Several factors contribute to the Military Robots industry's growth: Firstly, increasing defense budgets worldwide are creating a larger market for military equipment. Secondly, technological advancements in AI, robotics, and sensor technologies continue to improve the capabilities of military robots, leading to increased demand. Lastly, the desire to reduce casualties in combat situations and to perform tasks too dangerous for humans drives the adoption of military robots.
Obstacles in the Military Robots Industry Market
Several barriers hinder the Military Robots industry's growth: Firstly, high initial costs and maintenance expenses associated with these complex systems can be prohibitive for some countries. Secondly, concerns regarding the ethical implications of using autonomous weapons systems are leading to regulatory scrutiny and potential restrictions. Lastly, supply chain disruptions and geopolitical instability can negatively affect the production and deployment of these systems, increasing development and deployment costs.
Future Opportunities in Military Robots Industry
Future opportunities lie in several areas: Firstly, advancements in swarm robotics technology open doors for coordinated operations with multiple robots. Secondly, expanding applications in areas such as mine clearance, search and rescue, and disaster relief are further markets for military robot technology. Thirdly, the integration of AI and machine learning will lead to more autonomous and intelligent robots, enhancing their capabilities and value in military operations.
Major Players in the Military Robots Industry Ecosystem
Key Developments in Military Robots Industry Industry
- October 2023: The US Army initiates development of integrated robot-human operator formations, aiming for enhanced battlefield coordination.
- July 2022: Teledyne FLIR Defense secures a USD 62.1 Million contract for 500 Centaur multi-mission robots from the US Armed Services.
- January 2022: China unveils a large electrically powered quadruped robot for military logistics and reconnaissance, boasting a 352-pound payload capacity and 10 km/h speed.
Strategic Military Robots Industry Market Forecast
The Military Robots market is poised for continued robust growth, driven by technological advancements, rising defense spending, and the increasing demand for unmanned systems. The market's future potential is significant, with opportunities across various segments and geographies. Further innovation in AI, robotics, and sensor technologies will continue to propel market expansion and lead to even more capable and versatile military robots.
Military Robots Industry Segmentation
- 1. Production Analysis
- 2. Consumption Analysis
- 3. Import Market Analysis (Value & Volume)
- 4. Export Market Analysis (Value & Volume)
- 5. Price Trend Analysis
Military Robots Industry Segmentation By Geography
-
1. North America
- 1.1. United States
- 1.2. Canada
- 1.3. Mexico
-
2. South America
- 2.1. Brazil
- 2.2. Argentina
- 2.3. Rest of South America
-
3. Europe
- 3.1. United Kingdom
- 3.2. Germany
- 3.3. France
- 3.4. Italy
- 3.5. Spain
- 3.6. Russia
- 3.7. Benelux
- 3.8. Nordics
- 3.9. Rest of Europe
-
4. Middle East & Africa
- 4.1. Turkey
- 4.2. Israel
- 4.3. GCC
- 4.4. North Africa
- 4.5. South Africa
- 4.6. Rest of Middle East & Africa
-
5. Asia Pacific
- 5.1. China
- 5.2. India
- 5.3. Japan
- 5.4. South Korea
- 5.5. ASEAN
- 5.6. Oceania
- 5.7. Rest of Asia Pacific
Military Robots Industry Regional Market Share
Geographic Coverage of Military Robots Industry
Military Robots Industry REPORT HIGHLIGHTS
| Aspects | Details |
|---|---|
| Study Period | 2020-2034 |
| Base Year | 2025 |
| Estimated Year | 2026 |
| Forecast Period | 2026-2034 |
| Historical Period | 2020-2025 |
| Growth Rate | CAGR of 6.97% from 2020-2034 |
| Segmentation |
|
Table of Contents
- 1. Introduction
- 1.1. Research Scope
- 1.2. Market Segmentation
- 1.3. Research Objective
- 1.4. Definitions and Assumptions
- 2. Executive Summary
- 2.1. Market Snapshot
- 3. Market Dynamics
- 3.1. Market Drivers
- 3.2. Market Restrains
- 3.3. Market Trends
- 3.4. Market Opportunities
- 4. Market Factor Analysis
- 4.1. Porters Five Forces
- 4.1.1. Bargaining Power of Suppliers
- 4.1.2. Bargaining Power of Buyers
- 4.1.3. Threat of New Entrants
- 4.1.4. Threat of Substitutes
- 4.1.5. Competitive Rivalry
- 4.2. PESTEL analysis
- 4.3. BCG Analysis
- 4.3.1. Stars (High Growth, High Market Share)
- 4.3.2. Cash Cows (Low Growth, High Market Share)
- 4.3.3. Question Mark (High Growth, Low Market Share)
- 4.3.4. Dogs (Low Growth, Low Market Share)
- 4.4. Ansoff Matrix Analysis
- 4.5. Supply Chain Analysis
- 4.6. Regulatory Landscape
- 4.7. Current Market Potential and Opportunity Assessment (TAM–SAM–SOM Framework)
- 4.8. DMV Analyst Note
- 4.1. Porters Five Forces
- 5. Market Analysis, Insights and Forecast 2021-2033
- 5.1. Market Analysis, Insights and Forecast - by Production Analysis
- 5.2. Market Analysis, Insights and Forecast - by Consumption Analysis
- 5.3. Market Analysis, Insights and Forecast - by Import Market Analysis (Value & Volume)
- 5.4. Market Analysis, Insights and Forecast - by Export Market Analysis (Value & Volume)
- 5.5. Market Analysis, Insights and Forecast - by Price Trend Analysis
- 5.6. Market Analysis, Insights and Forecast - by Region
- 5.6.1. North America
- 5.6.2. South America
- 5.6.3. Europe
- 5.6.4. Middle East & Africa
- 5.6.5. Asia Pacific
- 6. Global Military Robots Industry Analysis, Insights and Forecast, 2021-2033
- 6.1. Market Analysis, Insights and Forecast - by Production Analysis
- 6.2. Market Analysis, Insights and Forecast - by Consumption Analysis
- 6.3. Market Analysis, Insights and Forecast - by Import Market Analysis (Value & Volume)
- 6.4. Market Analysis, Insights and Forecast - by Export Market Analysis (Value & Volume)
- 6.5. Market Analysis, Insights and Forecast - by Price Trend Analysis
- 7. North America Military Robots Industry Analysis, Insights and Forecast, 2020-2032
- 7.1. Market Analysis, Insights and Forecast - by Production Analysis
- 7.2. Market Analysis, Insights and Forecast - by Consumption Analysis
- 7.3. Market Analysis, Insights and Forecast - by Import Market Analysis (Value & Volume)
- 7.4. Market Analysis, Insights and Forecast - by Export Market Analysis (Value & Volume)
- 7.5. Market Analysis, Insights and Forecast - by Price Trend Analysis
- 8. South America Military Robots Industry Analysis, Insights and Forecast, 2020-2032
- 8.1. Market Analysis, Insights and Forecast - by Production Analysis
- 8.2. Market Analysis, Insights and Forecast - by Consumption Analysis
- 8.3. Market Analysis, Insights and Forecast - by Import Market Analysis (Value & Volume)
- 8.4. Market Analysis, Insights and Forecast - by Export Market Analysis (Value & Volume)
- 8.5. Market Analysis, Insights and Forecast - by Price Trend Analysis
- 9. Europe Military Robots Industry Analysis, Insights and Forecast, 2020-2032
- 9.1. Market Analysis, Insights and Forecast - by Production Analysis
- 9.2. Market Analysis, Insights and Forecast - by Consumption Analysis
- 9.3. Market Analysis, Insights and Forecast - by Import Market Analysis (Value & Volume)
- 9.4. Market Analysis, Insights and Forecast - by Export Market Analysis (Value & Volume)
- 9.5. Market Analysis, Insights and Forecast - by Price Trend Analysis
- 10. Middle East & Africa Military Robots Industry Analysis, Insights and Forecast, 2020-2032
- 10.1. Market Analysis, Insights and Forecast - by Production Analysis
- 10.2. Market Analysis, Insights and Forecast - by Consumption Analysis
- 10.3. Market Analysis, Insights and Forecast - by Import Market Analysis (Value & Volume)
- 10.4. Market Analysis, Insights and Forecast - by Export Market Analysis (Value & Volume)
- 10.5. Market Analysis, Insights and Forecast - by Price Trend Analysis
- 11. Asia Pacific Military Robots Industry Analysis, Insights and Forecast, 2020-2032
- 11.1. Market Analysis, Insights and Forecast - by Production Analysis
- 11.2. Market Analysis, Insights and Forecast - by Consumption Analysis
- 11.3. Market Analysis, Insights and Forecast - by Import Market Analysis (Value & Volume)
- 11.4. Market Analysis, Insights and Forecast - by Export Market Analysis (Value & Volume)
- 11.5. Market Analysis, Insights and Forecast - by Price Trend Analysis
- 12. Competitive Analysis
- 12.1. Company Profiles
- 12.1.1 Textron Inc
- 12.1.1.1. Company Overview
- 12.1.1.2. Products
- 12.1.1.3. Company Financials
- 12.1.1.4. SWOT Analysis
- 12.1.2 THALES
- 12.1.2.1. Company Overview
- 12.1.2.2. Products
- 12.1.2.3. Company Financials
- 12.1.2.4. SWOT Analysis
- 12.1.3 General Dynamics Corporation
- 12.1.3.1. Company Overview
- 12.1.3.2. Products
- 12.1.3.3. Company Financials
- 12.1.3.4. SWOT Analysis
- 12.1.4 BAYKAR
- 12.1.4.1. Company Overview
- 12.1.4.2. Products
- 12.1.4.3. Company Financials
- 12.1.4.4. SWOT Analysis
- 12.1.5 Elbit Systems Ltd
- 12.1.5.1. Company Overview
- 12.1.5.2. Products
- 12.1.5.3. Company Financials
- 12.1.5.4. SWOT Analysis
- 12.1.6 Lockheed Martin Corporation
- 12.1.6.1. Company Overview
- 12.1.6.2. Products
- 12.1.6.3. Company Financials
- 12.1.6.4. SWOT Analysis
- 12.1.7 QinetiQ Group PLC
- 12.1.7.1. Company Overview
- 12.1.7.2. Products
- 12.1.7.3. Company Financials
- 12.1.7.4. SWOT Analysis
- 12.1.8 Cobham Ltd
- 12.1.8.1. Company Overview
- 12.1.8.2. Products
- 12.1.8.3. Company Financials
- 12.1.8.4. SWOT Analysis
- 12.1.9 AeroVironment Inc
- 12.1.9.1. Company Overview
- 12.1.9.2. Products
- 12.1.9.3. Company Financials
- 12.1.9.4. SWOT Analysis
- 12.1.10 IAI
- 12.1.10.1. Company Overview
- 12.1.10.2. Products
- 12.1.10.3. Company Financials
- 12.1.10.4. SWOT Analysis
- 12.1.11 Aeronautics Ltd
- 12.1.11.1. Company Overview
- 12.1.11.2. Products
- 12.1.11.3. Company Financials
- 12.1.11.4. SWOT Analysis
- 12.1.12 BAE Systems plc
- 12.1.12.1. Company Overview
- 12.1.12.2. Products
- 12.1.12.3. Company Financials
- 12.1.12.4. SWOT Analysis
- 12.1.13 Northrop Grumman Corporation
- 12.1.13.1. Company Overview
- 12.1.13.2. Products
- 12.1.13.3. Company Financials
- 12.1.13.4. SWOT Analysis
- 12.1.14 Saab AB
- 12.1.14.1. Company Overview
- 12.1.14.2. Products
- 12.1.14.3. Company Financials
- 12.1.14.4. SWOT Analysis
- 12.1.15 Teledyne FLIR LLC
- 12.1.15.1. Company Overview
- 12.1.15.2. Products
- 12.1.15.3. Company Financials
- 12.1.15.4. SWOT Analysis
- 12.1.1 Textron Inc
- 12.2. Market Entropy
- 12.2.1 Company's Key Areas Served
- 12.2.2 Recent Developments
- 12.3. Company Market Share Analysis 2025
- 12.3.1 Top 5 Companies Market Share Analysis
- 12.3.2 Top 3 Companies Market Share Analysis
- 12.4. List of Potential Customers
- 13. Research Methodology
List of Figures
- Figure 1: Global Military Robots Industry Revenue Breakdown (Million, %) by Region 2025 & 2033
- Figure 2: North America Military Robots Industry Revenue (Million), by Production Analysis 2025 & 2033
- Figure 3: North America Military Robots Industry Revenue Share (%), by Production Analysis 2025 & 2033
- Figure 4: North America Military Robots Industry Revenue (Million), by Consumption Analysis 2025 & 2033
- Figure 5: North America Military Robots Industry Revenue Share (%), by Consumption Analysis 2025 & 2033
- Figure 6: North America Military Robots Industry Revenue (Million), by Import Market Analysis (Value & Volume) 2025 & 2033
- Figure 7: North America Military Robots Industry Revenue Share (%), by Import Market Analysis (Value & Volume) 2025 & 2033
- Figure 8: North America Military Robots Industry Revenue (Million), by Export Market Analysis (Value & Volume) 2025 & 2033
- Figure 9: North America Military Robots Industry Revenue Share (%), by Export Market Analysis (Value & Volume) 2025 & 2033
- Figure 10: North America Military Robots Industry Revenue (Million), by Price Trend Analysis 2025 & 2033
- Figure 11: North America Military Robots Industry Revenue Share (%), by Price Trend Analysis 2025 & 2033
- Figure 12: North America Military Robots Industry Revenue (Million), by Country 2025 & 2033
- Figure 13: North America Military Robots Industry Revenue Share (%), by Country 2025 & 2033
- Figure 14: South America Military Robots Industry Revenue (Million), by Production Analysis 2025 & 2033
- Figure 15: South America Military Robots Industry Revenue Share (%), by Production Analysis 2025 & 2033
- Figure 16: South America Military Robots Industry Revenue (Million), by Consumption Analysis 2025 & 2033
- Figure 17: South America Military Robots Industry Revenue Share (%), by Consumption Analysis 2025 & 2033
- Figure 18: South America Military Robots Industry Revenue (Million), by Import Market Analysis (Value & Volume) 2025 & 2033
- Figure 19: South America Military Robots Industry Revenue Share (%), by Import Market Analysis (Value & Volume) 2025 & 2033
- Figure 20: South America Military Robots Industry Revenue (Million), by Export Market Analysis (Value & Volume) 2025 & 2033
- Figure 21: South America Military Robots Industry Revenue Share (%), by Export Market Analysis (Value & Volume) 2025 & 2033
- Figure 22: South America Military Robots Industry Revenue (Million), by Price Trend Analysis 2025 & 2033
- Figure 23: South America Military Robots Industry Revenue Share (%), by Price Trend Analysis 2025 & 2033
- Figure 24: South America Military Robots Industry Revenue (Million), by Country 2025 & 2033
- Figure 25: South America Military Robots Industry Revenue Share (%), by Country 2025 & 2033
- Figure 26: Europe Military Robots Industry Revenue (Million), by Production Analysis 2025 & 2033
- Figure 27: Europe Military Robots Industry Revenue Share (%), by Production Analysis 2025 & 2033
- Figure 28: Europe Military Robots Industry Revenue (Million), by Consumption Analysis 2025 & 2033
- Figure 29: Europe Military Robots Industry Revenue Share (%), by Consumption Analysis 2025 & 2033
- Figure 30: Europe Military Robots Industry Revenue (Million), by Import Market Analysis (Value & Volume) 2025 & 2033
- Figure 31: Europe Military Robots Industry Revenue Share (%), by Import Market Analysis (Value & Volume) 2025 & 2033
- Figure 32: Europe Military Robots Industry Revenue (Million), by Export Market Analysis (Value & Volume) 2025 & 2033
- Figure 33: Europe Military Robots Industry Revenue Share (%), by Export Market Analysis (Value & Volume) 2025 & 2033
- Figure 34: Europe Military Robots Industry Revenue (Million), by Price Trend Analysis 2025 & 2033
- Figure 35: Europe Military Robots Industry Revenue Share (%), by Price Trend Analysis 2025 & 2033
- Figure 36: Europe Military Robots Industry Revenue (Million), by Country 2025 & 2033
- Figure 37: Europe Military Robots Industry Revenue Share (%), by Country 2025 & 2033
- Figure 38: Middle East & Africa Military Robots Industry Revenue (Million), by Production Analysis 2025 & 2033
- Figure 39: Middle East & Africa Military Robots Industry Revenue Share (%), by Production Analysis 2025 & 2033
- Figure 40: Middle East & Africa Military Robots Industry Revenue (Million), by Consumption Analysis 2025 & 2033
- Figure 41: Middle East & Africa Military Robots Industry Revenue Share (%), by Consumption Analysis 2025 & 2033
- Figure 42: Middle East & Africa Military Robots Industry Revenue (Million), by Import Market Analysis (Value & Volume) 2025 & 2033
- Figure 43: Middle East & Africa Military Robots Industry Revenue Share (%), by Import Market Analysis (Value & Volume) 2025 & 2033
- Figure 44: Middle East & Africa Military Robots Industry Revenue (Million), by Export Market Analysis (Value & Volume) 2025 & 2033
- Figure 45: Middle East & Africa Military Robots Industry Revenue Share (%), by Export Market Analysis (Value & Volume) 2025 & 2033
- Figure 46: Middle East & Africa Military Robots Industry Revenue (Million), by Price Trend Analysis 2025 & 2033
- Figure 47: Middle East & Africa Military Robots Industry Revenue Share (%), by Price Trend Analysis 2025 & 2033
- Figure 48: Middle East & Africa Military Robots Industry Revenue (Million), by Country 2025 & 2033
- Figure 49: Middle East & Africa Military Robots Industry Revenue Share (%), by Country 2025 & 2033
- Figure 50: Asia Pacific Military Robots Industry Revenue (Million), by Production Analysis 2025 & 2033
- Figure 51: Asia Pacific Military Robots Industry Revenue Share (%), by Production Analysis 2025 & 2033
- Figure 52: Asia Pacific Military Robots Industry Revenue (Million), by Consumption Analysis 2025 & 2033
- Figure 53: Asia Pacific Military Robots Industry Revenue Share (%), by Consumption Analysis 2025 & 2033
- Figure 54: Asia Pacific Military Robots Industry Revenue (Million), by Import Market Analysis (Value & Volume) 2025 & 2033
- Figure 55: Asia Pacific Military Robots Industry Revenue Share (%), by Import Market Analysis (Value & Volume) 2025 & 2033
- Figure 56: Asia Pacific Military Robots Industry Revenue (Million), by Export Market Analysis (Value & Volume) 2025 & 2033
- Figure 57: Asia Pacific Military Robots Industry Revenue Share (%), by Export Market Analysis (Value & Volume) 2025 & 2033
- Figure 58: Asia Pacific Military Robots Industry Revenue (Million), by Price Trend Analysis 2025 & 2033
- Figure 59: Asia Pacific Military Robots Industry Revenue Share (%), by Price Trend Analysis 2025 & 2033
- Figure 60: Asia Pacific Military Robots Industry Revenue (Million), by Country 2025 & 2033
- Figure 61: Asia Pacific Military Robots Industry Revenue Share (%), by Country 2025 & 2033
List of Tables
- Table 1: Global Military Robots Industry Revenue Million Forecast, by Production Analysis 2020 & 2033
- Table 2: Global Military Robots Industry Revenue Million Forecast, by Consumption Analysis 2020 & 2033
- Table 3: Global Military Robots Industry Revenue Million Forecast, by Import Market Analysis (Value & Volume) 2020 & 2033
- Table 4: Global Military Robots Industry Revenue Million Forecast, by Export Market Analysis (Value & Volume) 2020 & 2033
- Table 5: Global Military Robots Industry Revenue Million Forecast, by Price Trend Analysis 2020 & 2033
- Table 6: Global Military Robots Industry Revenue Million Forecast, by Region 2020 & 2033
- Table 7: Global Military Robots Industry Revenue Million Forecast, by Production Analysis 2020 & 2033
- Table 8: Global Military Robots Industry Revenue Million Forecast, by Consumption Analysis 2020 & 2033
- Table 9: Global Military Robots Industry Revenue Million Forecast, by Import Market Analysis (Value & Volume) 2020 & 2033
- Table 10: Global Military Robots Industry Revenue Million Forecast, by Export Market Analysis (Value & Volume) 2020 & 2033
- Table 11: Global Military Robots Industry Revenue Million Forecast, by Price Trend Analysis 2020 & 2033
- Table 12: Global Military Robots Industry Revenue Million Forecast, by Country 2020 & 2033
- Table 13: United States Military Robots Industry Revenue (Million) Forecast, by Application 2020 & 2033
- Table 14: Canada Military Robots Industry Revenue (Million) Forecast, by Application 2020 & 2033
- Table 15: Mexico Military Robots Industry Revenue (Million) Forecast, by Application 2020 & 2033
- Table 16: Global Military Robots Industry Revenue Million Forecast, by Production Analysis 2020 & 2033
- Table 17: Global Military Robots Industry Revenue Million Forecast, by Consumption Analysis 2020 & 2033
- Table 18: Global Military Robots Industry Revenue Million Forecast, by Import Market Analysis (Value & Volume) 2020 & 2033
- Table 19: Global Military Robots Industry Revenue Million Forecast, by Export Market Analysis (Value & Volume) 2020 & 2033
- Table 20: Global Military Robots Industry Revenue Million Forecast, by Price Trend Analysis 2020 & 2033
- Table 21: Global Military Robots Industry Revenue Million Forecast, by Country 2020 & 2033
- Table 22: Brazil Military Robots Industry Revenue (Million) Forecast, by Application 2020 & 2033
- Table 23: Argentina Military Robots Industry Revenue (Million) Forecast, by Application 2020 & 2033
- Table 24: Rest of South America Military Robots Industry Revenue (Million) Forecast, by Application 2020 & 2033
- Table 25: Global Military Robots Industry Revenue Million Forecast, by Production Analysis 2020 & 2033
- Table 26: Global Military Robots Industry Revenue Million Forecast, by Consumption Analysis 2020 & 2033
- Table 27: Global Military Robots Industry Revenue Million Forecast, by Import Market Analysis (Value & Volume) 2020 & 2033
- Table 28: Global Military Robots Industry Revenue Million Forecast, by Export Market Analysis (Value & Volume) 2020 & 2033
- Table 29: Global Military Robots Industry Revenue Million Forecast, by Price Trend Analysis 2020 & 2033
- Table 30: Global Military Robots Industry Revenue Million Forecast, by Country 2020 & 2033
- Table 31: United Kingdom Military Robots Industry Revenue (Million) Forecast, by Application 2020 & 2033
- Table 32: Germany Military Robots Industry Revenue (Million) Forecast, by Application 2020 & 2033
- Table 33: France Military Robots Industry Revenue (Million) Forecast, by Application 2020 & 2033
- Table 34: Italy Military Robots Industry Revenue (Million) Forecast, by Application 2020 & 2033
- Table 35: Spain Military Robots Industry Revenue (Million) Forecast, by Application 2020 & 2033
- Table 36: Russia Military Robots Industry Revenue (Million) Forecast, by Application 2020 & 2033
- Table 37: Benelux Military Robots Industry Revenue (Million) Forecast, by Application 2020 & 2033
- Table 38: Nordics Military Robots Industry Revenue (Million) Forecast, by Application 2020 & 2033
- Table 39: Rest of Europe Military Robots Industry Revenue (Million) Forecast, by Application 2020 & 2033
- Table 40: Global Military Robots Industry Revenue Million Forecast, by Production Analysis 2020 & 2033
- Table 41: Global Military Robots Industry Revenue Million Forecast, by Consumption Analysis 2020 & 2033
- Table 42: Global Military Robots Industry Revenue Million Forecast, by Import Market Analysis (Value & Volume) 2020 & 2033
- Table 43: Global Military Robots Industry Revenue Million Forecast, by Export Market Analysis (Value & Volume) 2020 & 2033
- Table 44: Global Military Robots Industry Revenue Million Forecast, by Price Trend Analysis 2020 & 2033
- Table 45: Global Military Robots Industry Revenue Million Forecast, by Country 2020 & 2033
- Table 46: Turkey Military Robots Industry Revenue (Million) Forecast, by Application 2020 & 2033
- Table 47: Israel Military Robots Industry Revenue (Million) Forecast, by Application 2020 & 2033
- Table 48: GCC Military Robots Industry Revenue (Million) Forecast, by Application 2020 & 2033
- Table 49: North Africa Military Robots Industry Revenue (Million) Forecast, by Application 2020 & 2033
- Table 50: South Africa Military Robots Industry Revenue (Million) Forecast, by Application 2020 & 2033
- Table 51: Rest of Middle East & Africa Military Robots Industry Revenue (Million) Forecast, by Application 2020 & 2033
- Table 52: Global Military Robots Industry Revenue Million Forecast, by Production Analysis 2020 & 2033
- Table 53: Global Military Robots Industry Revenue Million Forecast, by Consumption Analysis 2020 & 2033
- Table 54: Global Military Robots Industry Revenue Million Forecast, by Import Market Analysis (Value & Volume) 2020 & 2033
- Table 55: Global Military Robots Industry Revenue Million Forecast, by Export Market Analysis (Value & Volume) 2020 & 2033
- Table 56: Global Military Robots Industry Revenue Million Forecast, by Price Trend Analysis 2020 & 2033
- Table 57: Global Military Robots Industry Revenue Million Forecast, by Country 2020 & 2033
- Table 58: China Military Robots Industry Revenue (Million) Forecast, by Application 2020 & 2033
- Table 59: India Military Robots Industry Revenue (Million) Forecast, by Application 2020 & 2033
- Table 60: Japan Military Robots Industry Revenue (Million) Forecast, by Application 2020 & 2033
- Table 61: South Korea Military Robots Industry Revenue (Million) Forecast, by Application 2020 & 2033
- Table 62: ASEAN Military Robots Industry Revenue (Million) Forecast, by Application 2020 & 2033
- Table 63: Oceania Military Robots Industry Revenue (Million) Forecast, by Application 2020 & 2033
- Table 64: Rest of Asia Pacific Military Robots Industry Revenue (Million) Forecast, by Application 2020 & 2033
Frequently Asked Questions
1. What is the projected Compound Annual Growth Rate (CAGR) of the Military Robots Industry?
The projected CAGR is approximately 6.97%.
2. Which companies are prominent players in the Military Robots Industry?
Key companies in the market include Textron Inc, THALES, General Dynamics Corporation, BAYKAR, Elbit Systems Ltd, Lockheed Martin Corporation, QinetiQ Group PLC, Cobham Ltd, AeroVironment Inc, IAI, Aeronautics Ltd, BAE Systems plc, Northrop Grumman Corporation, Saab AB, Teledyne FLIR LLC.
3. What are the main segments of the Military Robots Industry?
The market segments include Production Analysis, Consumption Analysis, Import Market Analysis (Value & Volume), Export Market Analysis (Value & Volume), Price Trend Analysis.
4. Can you provide details about the market size?
The market size is estimated to be USD 24.37 Million as of 2022.
5. What are some drivers contributing to market growth?
; Increasing Number Of Air Passengers; Use Of Portable Electronic Devices.
6. What are the notable trends driving market growth?
Land Segment Anticipated to Generate Highest Growth During the Forecast Period.
7. Are there any restraints impacting market growth?
; High Cost Of Connectivity Equipments.
8. Can you provide examples of recent developments in the market?
October 2023: The US Army is reportedly developing integrated formations of robots and human operators as part of the modernization efforts. The US Army’s Rapid Capabilities and Critical Technologies Office (RCCTO) plans to use existing science and technology as well as information from fielded programs to figure out how to combine capabilities to maximize coordination on the battlefield.
9. What pricing options are available for accessing the report?
Pricing options include single-user, multi-user, and enterprise licenses priced at USD 4750, USD 5250, and USD 8750 respectively.
10. Is the market size provided in terms of value or volume?
The market size is provided in terms of value, measured in Million.
11. Are there any specific market keywords associated with the report?
Yes, the market keyword associated with the report is "Military Robots Industry," which aids in identifying and referencing the specific market segment covered.
12. How do I determine which pricing option suits my needs best?
The pricing options vary based on user requirements and access needs. Individual users may opt for single-user licenses, while businesses requiring broader access may choose multi-user or enterprise licenses for cost-effective access to the report.
13. Are there any additional resources or data provided in the Military Robots Industry report?
While the report offers comprehensive insights, it's advisable to review the specific contents or supplementary materials provided to ascertain if additional resources or data are available.
14. How can I stay updated on further developments or reports in the Military Robots Industry?
To stay informed about further developments, trends, and reports in the Military Robots Industry, consider subscribing to industry newsletters, following relevant companies and organizations, or regularly checking reputable industry news sources and publications.
Methodology
Step 1 - Identification of Relevant Samples Size from Population Database


Step 2 - Approaches for Defining Global Market Size (Value, Volume* & Price*)

Note*: In applicable scenarios
Step 3 - Data Sources
Primary Research
- Web Analytics
- Survey Reports
- Research Institute
- Latest Research Reports
- Opinion Leaders
Secondary Research
- Annual Reports
- White Paper
- Latest Press Release
- Industry Association
- Paid Database
- Investor Presentations

Step 4 - Data Triangulation
Involves using different sources of information in order to increase the validity of a study
These sources are likely to be stakeholders in a program - participants, other researchers, program staff, other community members, and so on.
Then we put all data in single framework & apply various statistical tools to find out the dynamic on the market.
During the analysis stage, feedback from the stakeholder groups would be compared to determine areas of agreement as well as areas of divergence