

Key Insights
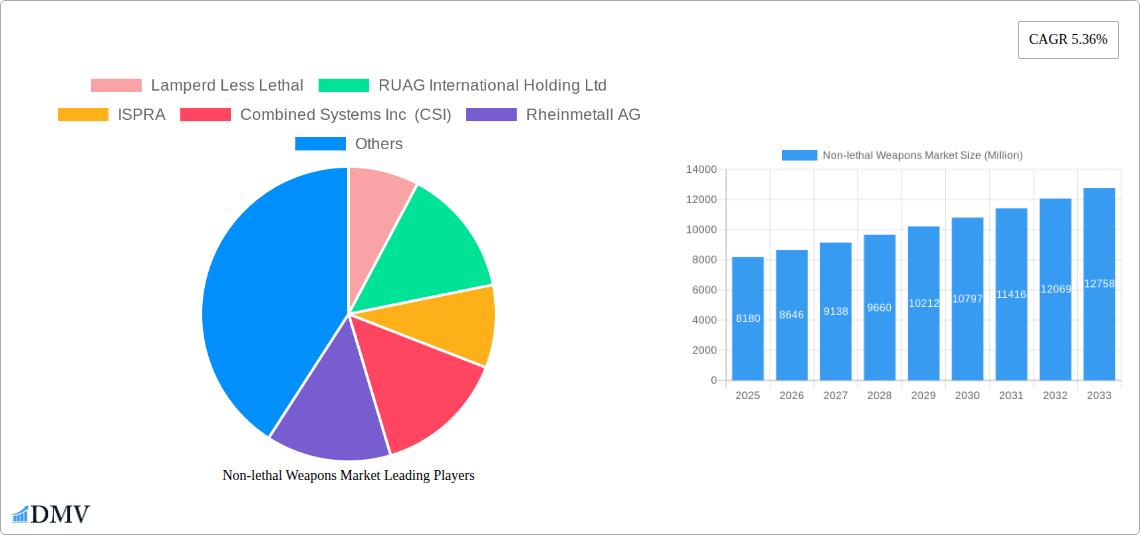
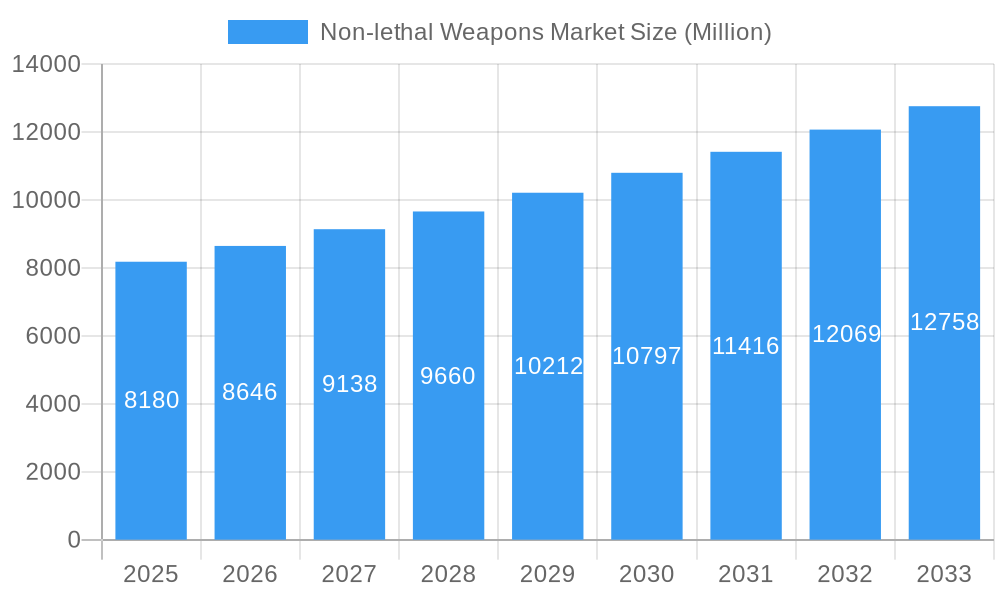
The non-lethal weapons market, valued at $8.18 billion in 2025, is projected to experience robust growth, driven by a Compound Annual Growth Rate (CAGR) of 5.36% from 2025 to 2033. This expansion is fueled by several key factors. Increasing global concerns about civil unrest and terrorism are prompting law enforcement and military agencies to adopt non-lethal alternatives to minimize casualties and collateral damage. Technological advancements are also playing a crucial role, with the development of more effective and precise non-lethal weapons such as improved directed energy weapons and enhanced chemical agents. The growing adoption of less-lethal options in crowd control and riot management further contributes to market growth. Furthermore, stringent regulations surrounding the use of lethal force in various regions are indirectly driving demand for non-lethal alternatives. Segment-wise, the anti-personnel ammunition segment is likely to dominate due to its wide application in various scenarios. Geographically, North America and Europe currently hold significant market share, owing to higher defense budgets and advanced technological capabilities. However, the Asia-Pacific region is anticipated to witness substantial growth in the coming years, driven by rising demand from developing economies experiencing rapid urbanization and increasing internal security concerns.
Non-lethal Weapons Market Market Size (In Billion)
The competitive landscape of the non-lethal weapons market is characterized by a mix of established players and emerging companies. Key players like Axon Enterprise, Rheinmetall AG, and RUAG International are leveraging their technological expertise and extensive distribution networks to maintain their market positions. Meanwhile, smaller companies are focusing on innovation and niche applications to carve out market share. The market’s growth trajectory is likely to be influenced by factors such as government spending on defense and security, technological breakthroughs in non-lethal weaponry, and evolving global political dynamics. The market’s expansion will be further influenced by the continuous development and refinement of less-lethal technologies, along with ongoing research into even more humane and effective methods of crowd control and riot management. Strategic partnerships and acquisitions are expected to remain prevalent, as companies seek to enhance their product portfolios and expand their geographical reach.
Non-lethal Weapons Market Company Market Share
Non-lethal Weapons Market: A Comprehensive Report (2019-2033)
This insightful report provides a detailed analysis of the Non-lethal Weapons Market, offering invaluable insights for stakeholders seeking to understand market dynamics, growth trajectories, and future opportunities. Covering the period from 2019 to 2033, with a base year of 2025, this comprehensive study unveils the key trends shaping this rapidly evolving sector. The market is expected to reach xx Million by 2033, growing at a CAGR of xx% during the forecast period (2025-2033).
Non-lethal Weapons Market Market Composition & Trends
This section delves into the current market structure, examining key trends impacting growth. We analyze market concentration, revealing the share held by major players like Axon Enterprise Inc and RUAG International Holding Ltd, and explore the impact of mergers and acquisitions (M&A) activity. The report also assesses innovation catalysts, such as advancements in directed energy weapons and electroshock technologies, alongside regulatory landscapes and the emergence of substitute products. End-user profiles (Law Enforcement, Military) are thoroughly examined, highlighting their specific needs and purchasing patterns.
- Market Share Distribution: Axon Enterprise Inc holds an estimated xx% market share, followed by RUAG International Holding Ltd with xx%. Smaller players collectively account for xx%.
- M&A Activity: The report analyzes xx Million worth of M&A deals in the past five years, highlighting their impact on market consolidation and competitive dynamics.
- Regulatory Landscape: A detailed examination of international and regional regulations governing the development, production, and deployment of non-lethal weapons.
- Substitute Products: Analysis of alternative technologies and their potential impact on market growth.
Non-lethal Weapons Market Industry Evolution
This section provides a comprehensive overview of the non-lethal weapons market's evolution, encompassing historical growth trends (2019-2024) and projected future growth (2025-2033). Technological advancements, such as the development of more precise and less harmful weapons, and shifting consumer demands towards safer and more effective solutions are discussed in detail. The impact of emerging technologies like directed energy weapons and their adoption rate within law enforcement and military applications are analyzed. We provide specific data points on market growth rates and adoption metrics across various segments, helping stakeholders understand the market's trajectory. The shift towards less-lethal options, driven by ethical considerations and public pressure, is a prominent theme. The rise of personal defense products and the impact of innovative solutions like KWESST Micro Systems Inc.'s Para Ops system are also explored.
Leading Regions, Countries, or Segments in Non-lethal Weapons Market
This section identifies the dominant regions, countries, and segments within the non-lethal weapons market. We analyze the key drivers for dominance across different segments – Type (Area Denial, Anti-personnel Ammunition, Sponge Grenades, Sting Grenades, Pepper Spray, Directed Energy Weapons, Electroshock Weapons) and Application (Law Enforcement, Military). A detailed analysis of market share, growth rates, and future potential within each segment is included.
- Dominant Region: North America is projected to maintain its dominance, driven by robust defense spending and technological advancements.
- Key Drivers (North America):
- High defense expenditure.
- Strong government support for R&D.
- Presence of major manufacturers.
- Dominant Segment (Type): Anti-personnel Ammunition is currently the largest segment, although Directed Energy Weapons are projected to show significant future growth.
- Dominant Segment (Application): Law Enforcement currently holds the largest market share due to increasing demand for crowd control and riot control solutions.
Non-lethal Weapons Market Product Innovations
Recent years have witnessed significant innovations in non-lethal weapons technology. This section highlights key product developments, focusing on improved accuracy, reduced collateral damage, and enhanced effectiveness. We examine the unique selling propositions (USPs) of new products, analyzing their performance metrics and technological advancements. The integration of advanced technologies, such as smart sensors and improved targeting systems, are analyzed. The emergence of less-lethal alternatives to traditional firearms, and the increasing focus on minimizing unintended harm, are also discussed.
Propelling Factors for Non-lethal Weapons Market Growth
Several key factors are driving the growth of the non-lethal weapons market. Increasing demand for enhanced security and safety measures, particularly in urban environments, is a significant driver. The rising adoption of non-lethal weapons by law enforcement agencies and military forces globally, motivated by a need to reduce casualties and collateral damage during operations, significantly impacts market expansion. Furthermore, technological advancements in non-lethal weaponry, leading to increased effectiveness and reduced risk, are propelling market growth. Government regulations and policies promoting the use of non-lethal solutions also contribute.
Obstacles in the Non-lethal Weapons Market Market
Despite the growth potential, several challenges hinder the expansion of the non-lethal weapons market. Strict regulatory frameworks, along with concerns about the ethical implications of certain technologies, create barriers to entry and market expansion. Supply chain disruptions, particularly concerning specific components and materials, have impacted production timelines and costs. The market also faces competitive pressures from numerous established and emerging companies. These factors contribute to price fluctuations and constrain the overall market growth.
Future Opportunities in Non-lethal Weapons Market
Future opportunities in the non-lethal weapons market are abundant. The expansion into new markets, particularly in developing economies experiencing increased internal security concerns, presents a significant avenue for growth. Advancements in directed energy weapons and other non-lethal technologies offer considerable potential. Emerging trends, such as the increasing demand for personal safety and defense products, also promise to fuel market expansion in the coming years. Focus on improved training and operational protocols for safer usage is a significant growth opportunity.
Major Players in the Non-lethal Weapons Market Ecosystem
- Lamperd Less Lethal
- RUAG International Holding Ltd
- ISPRA
- Combined Systems Inc (CSI)
- Rheinmetall AG
- Byrna Technologies Inc
- CONDOR TECNOLOGIAS Não LETALIS
- AMTEC Less-Lethal Systems Inc
- NonLethal Technologies Inc
- RTX Corporation
- Fiocchi Munizioni S p A
- Zarc International Inc
- Axon Enterprise Inc
- UTS United Tactical Systems LLC (Pepperball)
- Herstal Group
- Safariland LLC
Key Developments in Non-lethal Weapons Market Industry
- May 2023: The Republic of Singapore Navy equips its Sentinel-class vessels with Sitep Italia's MASS, showcasing the adoption of advanced non-lethal systems in maritime security.
- January 2022: KWESST Micro Systems Inc. launches the Para Ops Low Energy Cartridge System, marking a significant advancement in personal defense and law enforcement technologies.
Strategic Non-lethal Weapons Market Market Forecast
The non-lethal weapons market is poised for continued growth, driven by technological innovation and increased demand from both the military and law enforcement sectors. Emerging markets, combined with the development of more effective and less harmful technologies, will drive significant expansion. The ongoing focus on enhancing security and minimizing civilian casualties will further fuel this growth, making it a lucrative and impactful sector for years to come.
Non-lethal Weapons Market Segmentation
-
1. Type
-
1.1. Area Denial
- 1.1.1. Anti-vehicle
- 1.1.2. Anti-personnel
-
1.2. Ammunition
- 1.2.1. Rubber Bullets
- 1.2.2. Wax Bullets
- 1.2.3. Plastic Bullets
- 1.2.4. Bean Bag Rounds
- 1.2.5. Sponge Grenade
-
1.3. Explosives
- 1.3.1. Flash Bang Grenades
- 1.3.2. Sting Grenades
-
1.4. Gases and Sprays
- 1.4.1. Water Cannons
- 1.4.2. Scent-based Weapons
- 1.4.3. Teargas
- 1.4.4. Pepper Spray
- 1.5. Directed Energy Weapons
- 1.6. Electroshock Weapons
-
1.1. Area Denial
-
2. Application
- 2.1. Law Enforcement
- 2.2. Military
Non-lethal Weapons Market Segmentation By Geography
-
1. North America
- 1.1. United States
- 1.2. Canada
-
2. Europe
- 2.1. United Kingdom
- 2.2. Germany
- 2.3. France
- 2.4. Rest of Europe
-
3. Asia Pacific
- 3.1. China
- 3.2. India
- 3.3. Japan
- 3.4. South Korea
- 3.5. Rest of Asia Pacific
-
4. Latin America
- 4.1. Brazil
- 4.2. Mexico
- 4.3. Rest of Latin America
-
5. Middle East and Africa
- 5.1. United Arab Emirates
- 5.2. Saudi Arabia
- 5.3. Egypt
- 5.4. Qatar
- 5.5. Rest of Middle East and Africa
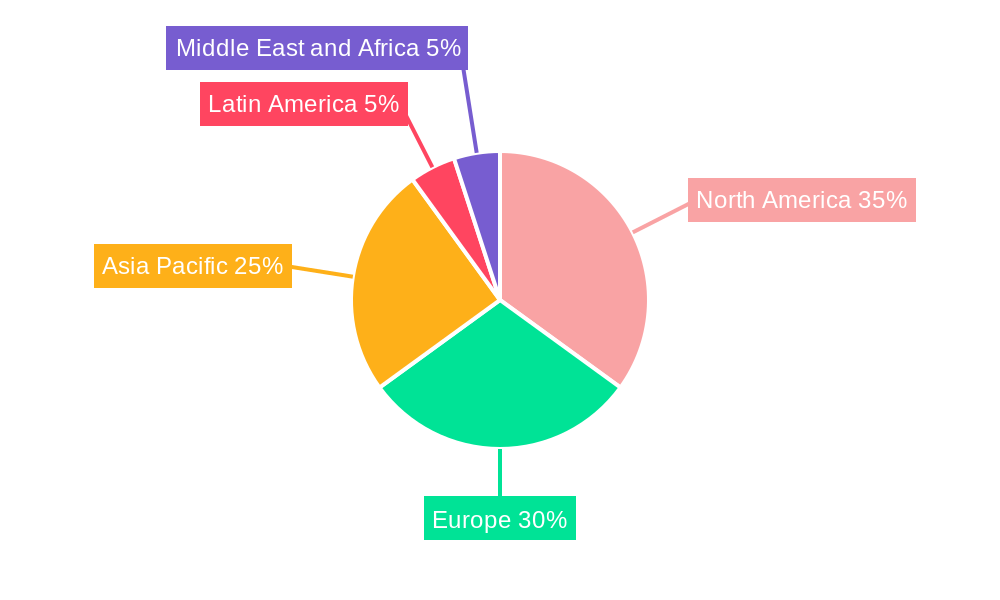
Non-lethal Weapons Market Regional Market Share
Geographic Coverage of Non-lethal Weapons Market
Non-lethal Weapons Market REPORT HIGHLIGHTS
| Aspects | Details |
|---|---|
| Study Period | 2020-2034 |
| Base Year | 2025 |
| Estimated Year | 2026 |
| Forecast Period | 2026-2034 |
| Historical Period | 2020-2025 |
| Growth Rate | CAGR of 5.36% from 2020-2034 |
| Segmentation |
|
Table of Contents
- 1. Introduction
- 1.1. Research Scope
- 1.2. Market Segmentation
- 1.3. Research Objective
- 1.4. Definitions and Assumptions
- 2. Executive Summary
- 2.1. Market Snapshot
- 3. Market Dynamics
- 3.1. Market Drivers
- 3.2. Market Restrains
- 3.3. Market Trends
- 3.4. Market Opportunities
- 4. Market Factor Analysis
- 4.1. Porters Five Forces
- 4.1.1. Bargaining Power of Suppliers
- 4.1.2. Bargaining Power of Buyers
- 4.1.3. Threat of New Entrants
- 4.1.4. Threat of Substitutes
- 4.1.5. Competitive Rivalry
- 4.2. PESTEL analysis
- 4.3. BCG Analysis
- 4.3.1. Stars (High Growth, High Market Share)
- 4.3.2. Cash Cows (Low Growth, High Market Share)
- 4.3.3. Question Mark (High Growth, Low Market Share)
- 4.3.4. Dogs (Low Growth, Low Market Share)
- 4.4. Ansoff Matrix Analysis
- 4.5. Supply Chain Analysis
- 4.6. Regulatory Landscape
- 4.7. Current Market Potential and Opportunity Assessment (TAM–SAM–SOM Framework)
- 4.8. DMV Analyst Note
- 4.1. Porters Five Forces
- 5. Market Analysis, Insights and Forecast 2021-2033
- 5.1. Market Analysis, Insights and Forecast - by Type
- 5.1.1. Area Denial
- 5.1.1.1. Anti-vehicle
- 5.1.1.2. Anti-personnel
- 5.1.2. Ammunition
- 5.1.2.1. Rubber Bullets
- 5.1.2.2. Wax Bullets
- 5.1.2.3. Plastic Bullets
- 5.1.2.4. Bean Bag Rounds
- 5.1.2.5. Sponge Grenade
- 5.1.3. Explosives
- 5.1.3.1. Flash Bang Grenades
- 5.1.3.2. Sting Grenades
- 5.1.4. Gases and Sprays
- 5.1.4.1. Water Cannons
- 5.1.4.2. Scent-based Weapons
- 5.1.4.3. Teargas
- 5.1.4.4. Pepper Spray
- 5.1.5. Directed Energy Weapons
- 5.1.6. Electroshock Weapons
- 5.1.1. Area Denial
- 5.2. Market Analysis, Insights and Forecast - by Application
- 5.2.1. Law Enforcement
- 5.2.2. Military
- 5.3. Market Analysis, Insights and Forecast - by Region
- 5.3.1. North America
- 5.3.2. Europe
- 5.3.3. Asia Pacific
- 5.3.4. Latin America
- 5.3.5. Middle East and Africa
- 5.1. Market Analysis, Insights and Forecast - by Type
- 6. Global Non-lethal Weapons Market Analysis, Insights and Forecast, 2021-2033
- 6.1. Market Analysis, Insights and Forecast - by Type
- 6.1.1. Area Denial
- 6.1.1.1. Anti-vehicle
- 6.1.1.2. Anti-personnel
- 6.1.2. Ammunition
- 6.1.2.1. Rubber Bullets
- 6.1.2.2. Wax Bullets
- 6.1.2.3. Plastic Bullets
- 6.1.2.4. Bean Bag Rounds
- 6.1.2.5. Sponge Grenade
- 6.1.3. Explosives
- 6.1.3.1. Flash Bang Grenades
- 6.1.3.2. Sting Grenades
- 6.1.4. Gases and Sprays
- 6.1.4.1. Water Cannons
- 6.1.4.2. Scent-based Weapons
- 6.1.4.3. Teargas
- 6.1.4.4. Pepper Spray
- 6.1.5. Directed Energy Weapons
- 6.1.6. Electroshock Weapons
- 6.1.1. Area Denial
- 6.2. Market Analysis, Insights and Forecast - by Application
- 6.2.1. Law Enforcement
- 6.2.2. Military
- 6.1. Market Analysis, Insights and Forecast - by Type
- 7. North America Non-lethal Weapons Market Analysis, Insights and Forecast, 2020-2032
- 7.1. Market Analysis, Insights and Forecast - by Type
- 7.1.1. Area Denial
- 7.1.1.1. Anti-vehicle
- 7.1.1.2. Anti-personnel
- 7.1.2. Ammunition
- 7.1.2.1. Rubber Bullets
- 7.1.2.2. Wax Bullets
- 7.1.2.3. Plastic Bullets
- 7.1.2.4. Bean Bag Rounds
- 7.1.2.5. Sponge Grenade
- 7.1.3. Explosives
- 7.1.3.1. Flash Bang Grenades
- 7.1.3.2. Sting Grenades
- 7.1.4. Gases and Sprays
- 7.1.4.1. Water Cannons
- 7.1.4.2. Scent-based Weapons
- 7.1.4.3. Teargas
- 7.1.4.4. Pepper Spray
- 7.1.5. Directed Energy Weapons
- 7.1.6. Electroshock Weapons
- 7.1.1. Area Denial
- 7.2. Market Analysis, Insights and Forecast - by Application
- 7.2.1. Law Enforcement
- 7.2.2. Military
- 7.1. Market Analysis, Insights and Forecast - by Type
- 8. Europe Non-lethal Weapons Market Analysis, Insights and Forecast, 2020-2032
- 8.1. Market Analysis, Insights and Forecast - by Type
- 8.1.1. Area Denial
- 8.1.1.1. Anti-vehicle
- 8.1.1.2. Anti-personnel
- 8.1.2. Ammunition
- 8.1.2.1. Rubber Bullets
- 8.1.2.2. Wax Bullets
- 8.1.2.3. Plastic Bullets
- 8.1.2.4. Bean Bag Rounds
- 8.1.2.5. Sponge Grenade
- 8.1.3. Explosives
- 8.1.3.1. Flash Bang Grenades
- 8.1.3.2. Sting Grenades
- 8.1.4. Gases and Sprays
- 8.1.4.1. Water Cannons
- 8.1.4.2. Scent-based Weapons
- 8.1.4.3. Teargas
- 8.1.4.4. Pepper Spray
- 8.1.5. Directed Energy Weapons
- 8.1.6. Electroshock Weapons
- 8.1.1. Area Denial
- 8.2. Market Analysis, Insights and Forecast - by Application
- 8.2.1. Law Enforcement
- 8.2.2. Military
- 8.1. Market Analysis, Insights and Forecast - by Type
- 9. Asia Pacific Non-lethal Weapons Market Analysis, Insights and Forecast, 2020-2032
- 9.1. Market Analysis, Insights and Forecast - by Type
- 9.1.1. Area Denial
- 9.1.1.1. Anti-vehicle
- 9.1.1.2. Anti-personnel
- 9.1.2. Ammunition
- 9.1.2.1. Rubber Bullets
- 9.1.2.2. Wax Bullets
- 9.1.2.3. Plastic Bullets
- 9.1.2.4. Bean Bag Rounds
- 9.1.2.5. Sponge Grenade
- 9.1.3. Explosives
- 9.1.3.1. Flash Bang Grenades
- 9.1.3.2. Sting Grenades
- 9.1.4. Gases and Sprays
- 9.1.4.1. Water Cannons
- 9.1.4.2. Scent-based Weapons
- 9.1.4.3. Teargas
- 9.1.4.4. Pepper Spray
- 9.1.5. Directed Energy Weapons
- 9.1.6. Electroshock Weapons
- 9.1.1. Area Denial
- 9.2. Market Analysis, Insights and Forecast - by Application
- 9.2.1. Law Enforcement
- 9.2.2. Military
- 9.1. Market Analysis, Insights and Forecast - by Type
- 10. Latin America Non-lethal Weapons Market Analysis, Insights and Forecast, 2020-2032
- 10.1. Market Analysis, Insights and Forecast - by Type
- 10.1.1. Area Denial
- 10.1.1.1. Anti-vehicle
- 10.1.1.2. Anti-personnel
- 10.1.2. Ammunition
- 10.1.2.1. Rubber Bullets
- 10.1.2.2. Wax Bullets
- 10.1.2.3. Plastic Bullets
- 10.1.2.4. Bean Bag Rounds
- 10.1.2.5. Sponge Grenade
- 10.1.3. Explosives
- 10.1.3.1. Flash Bang Grenades
- 10.1.3.2. Sting Grenades
- 10.1.4. Gases and Sprays
- 10.1.4.1. Water Cannons
- 10.1.4.2. Scent-based Weapons
- 10.1.4.3. Teargas
- 10.1.4.4. Pepper Spray
- 10.1.5. Directed Energy Weapons
- 10.1.6. Electroshock Weapons
- 10.1.1. Area Denial
- 10.2. Market Analysis, Insights and Forecast - by Application
- 10.2.1. Law Enforcement
- 10.2.2. Military
- 10.1. Market Analysis, Insights and Forecast - by Type
- 11. Middle East and Africa Non-lethal Weapons Market Analysis, Insights and Forecast, 2020-2032
- 11.1. Market Analysis, Insights and Forecast - by Type
- 11.1.1. Area Denial
- 11.1.1.1. Anti-vehicle
- 11.1.1.2. Anti-personnel
- 11.1.2. Ammunition
- 11.1.2.1. Rubber Bullets
- 11.1.2.2. Wax Bullets
- 11.1.2.3. Plastic Bullets
- 11.1.2.4. Bean Bag Rounds
- 11.1.2.5. Sponge Grenade
- 11.1.3. Explosives
- 11.1.3.1. Flash Bang Grenades
- 11.1.3.2. Sting Grenades
- 11.1.4. Gases and Sprays
- 11.1.4.1. Water Cannons
- 11.1.4.2. Scent-based Weapons
- 11.1.4.3. Teargas
- 11.1.4.4. Pepper Spray
- 11.1.5. Directed Energy Weapons
- 11.1.6. Electroshock Weapons
- 11.1.1. Area Denial
- 11.2. Market Analysis, Insights and Forecast - by Application
- 11.2.1. Law Enforcement
- 11.2.2. Military
- 11.1. Market Analysis, Insights and Forecast - by Type
- 12. Competitive Analysis
- 12.1. Company Profiles
- 12.1.1 Lamperd Less Lethal
- 12.1.1.1. Company Overview
- 12.1.1.2. Products
- 12.1.1.3. Company Financials
- 12.1.1.4. SWOT Analysis
- 12.1.2 RUAG International Holding Ltd
- 12.1.2.1. Company Overview
- 12.1.2.2. Products
- 12.1.2.3. Company Financials
- 12.1.2.4. SWOT Analysis
- 12.1.3 ISPRA
- 12.1.3.1. Company Overview
- 12.1.3.2. Products
- 12.1.3.3. Company Financials
- 12.1.3.4. SWOT Analysis
- 12.1.4 Combined Systems Inc (CSI)
- 12.1.4.1. Company Overview
- 12.1.4.2. Products
- 12.1.4.3. Company Financials
- 12.1.4.4. SWOT Analysis
- 12.1.5 Rheinmetall AG
- 12.1.5.1. Company Overview
- 12.1.5.2. Products
- 12.1.5.3. Company Financials
- 12.1.5.4. SWOT Analysis
- 12.1.6 Byrna Technologies Inc
- 12.1.6.1. Company Overview
- 12.1.6.2. Products
- 12.1.6.3. Company Financials
- 12.1.6.4. SWOT Analysis
- 12.1.7 CONDOR TECNOLOGIAS Não LETALIS
- 12.1.7.1. Company Overview
- 12.1.7.2. Products
- 12.1.7.3. Company Financials
- 12.1.7.4. SWOT Analysis
- 12.1.8 AMTEC Less-Lethal Systems Inc
- 12.1.8.1. Company Overview
- 12.1.8.2. Products
- 12.1.8.3. Company Financials
- 12.1.8.4. SWOT Analysis
- 12.1.9 NonLethal Technologies Inc
- 12.1.9.1. Company Overview
- 12.1.9.2. Products
- 12.1.9.3. Company Financials
- 12.1.9.4. SWOT Analysis
- 12.1.10 RTX Corporation
- 12.1.10.1. Company Overview
- 12.1.10.2. Products
- 12.1.10.3. Company Financials
- 12.1.10.4. SWOT Analysis
- 12.1.11 Fiocchi Munizioni S p A
- 12.1.11.1. Company Overview
- 12.1.11.2. Products
- 12.1.11.3. Company Financials
- 12.1.11.4. SWOT Analysis
- 12.1.12 Zarc International Inc
- 12.1.12.1. Company Overview
- 12.1.12.2. Products
- 12.1.12.3. Company Financials
- 12.1.12.4. SWOT Analysis
- 12.1.13 Axon Enterprise Inc
- 12.1.13.1. Company Overview
- 12.1.13.2. Products
- 12.1.13.3. Company Financials
- 12.1.13.4. SWOT Analysis
- 12.1.14 UTS United Tactical Systems LLC (Pepperball)
- 12.1.14.1. Company Overview
- 12.1.14.2. Products
- 12.1.14.3. Company Financials
- 12.1.14.4. SWOT Analysis
- 12.1.15 Herstal Group
- 12.1.15.1. Company Overview
- 12.1.15.2. Products
- 12.1.15.3. Company Financials
- 12.1.15.4. SWOT Analysis
- 12.1.16 Safariland LLC
- 12.1.16.1. Company Overview
- 12.1.16.2. Products
- 12.1.16.3. Company Financials
- 12.1.16.4. SWOT Analysis
- 12.1.1 Lamperd Less Lethal
- 12.2. Market Entropy
- 12.2.1 Company's Key Areas Served
- 12.2.2 Recent Developments
- 12.3. Company Market Share Analysis 2025
- 12.3.1 Top 5 Companies Market Share Analysis
- 12.3.2 Top 3 Companies Market Share Analysis
- 12.4. List of Potential Customers
- 13. Research Methodology
List of Figures
- Figure 1: Global Non-lethal Weapons Market Revenue Breakdown (Million, %) by Region 2025 & 2033
- Figure 2: North America Non-lethal Weapons Market Revenue (Million), by Type 2025 & 2033
- Figure 3: North America Non-lethal Weapons Market Revenue Share (%), by Type 2025 & 2033
- Figure 4: North America Non-lethal Weapons Market Revenue (Million), by Application 2025 & 2033
- Figure 5: North America Non-lethal Weapons Market Revenue Share (%), by Application 2025 & 2033
- Figure 6: North America Non-lethal Weapons Market Revenue (Million), by Country 2025 & 2033
- Figure 7: North America Non-lethal Weapons Market Revenue Share (%), by Country 2025 & 2033
- Figure 8: Europe Non-lethal Weapons Market Revenue (Million), by Type 2025 & 2033
- Figure 9: Europe Non-lethal Weapons Market Revenue Share (%), by Type 2025 & 2033
- Figure 10: Europe Non-lethal Weapons Market Revenue (Million), by Application 2025 & 2033
- Figure 11: Europe Non-lethal Weapons Market Revenue Share (%), by Application 2025 & 2033
- Figure 12: Europe Non-lethal Weapons Market Revenue (Million), by Country 2025 & 2033
- Figure 13: Europe Non-lethal Weapons Market Revenue Share (%), by Country 2025 & 2033
- Figure 14: Asia Pacific Non-lethal Weapons Market Revenue (Million), by Type 2025 & 2033
- Figure 15: Asia Pacific Non-lethal Weapons Market Revenue Share (%), by Type 2025 & 2033
- Figure 16: Asia Pacific Non-lethal Weapons Market Revenue (Million), by Application 2025 & 2033
- Figure 17: Asia Pacific Non-lethal Weapons Market Revenue Share (%), by Application 2025 & 2033
- Figure 18: Asia Pacific Non-lethal Weapons Market Revenue (Million), by Country 2025 & 2033
- Figure 19: Asia Pacific Non-lethal Weapons Market Revenue Share (%), by Country 2025 & 2033
- Figure 20: Latin America Non-lethal Weapons Market Revenue (Million), by Type 2025 & 2033
- Figure 21: Latin America Non-lethal Weapons Market Revenue Share (%), by Type 2025 & 2033
- Figure 22: Latin America Non-lethal Weapons Market Revenue (Million), by Application 2025 & 2033
- Figure 23: Latin America Non-lethal Weapons Market Revenue Share (%), by Application 2025 & 2033
- Figure 24: Latin America Non-lethal Weapons Market Revenue (Million), by Country 2025 & 2033
- Figure 25: Latin America Non-lethal Weapons Market Revenue Share (%), by Country 2025 & 2033
- Figure 26: Middle East and Africa Non-lethal Weapons Market Revenue (Million), by Type 2025 & 2033
- Figure 27: Middle East and Africa Non-lethal Weapons Market Revenue Share (%), by Type 2025 & 2033
- Figure 28: Middle East and Africa Non-lethal Weapons Market Revenue (Million), by Application 2025 & 2033
- Figure 29: Middle East and Africa Non-lethal Weapons Market Revenue Share (%), by Application 2025 & 2033
- Figure 30: Middle East and Africa Non-lethal Weapons Market Revenue (Million), by Country 2025 & 2033
- Figure 31: Middle East and Africa Non-lethal Weapons Market Revenue Share (%), by Country 2025 & 2033
List of Tables
- Table 1: Global Non-lethal Weapons Market Revenue Million Forecast, by Type 2020 & 2033
- Table 2: Global Non-lethal Weapons Market Revenue Million Forecast, by Application 2020 & 2033
- Table 3: Global Non-lethal Weapons Market Revenue Million Forecast, by Region 2020 & 2033
- Table 4: Global Non-lethal Weapons Market Revenue Million Forecast, by Type 2020 & 2033
- Table 5: Global Non-lethal Weapons Market Revenue Million Forecast, by Application 2020 & 2033
- Table 6: Global Non-lethal Weapons Market Revenue Million Forecast, by Country 2020 & 2033
- Table 7: United States Non-lethal Weapons Market Revenue (Million) Forecast, by Application 2020 & 2033
- Table 8: Canada Non-lethal Weapons Market Revenue (Million) Forecast, by Application 2020 & 2033
- Table 9: Global Non-lethal Weapons Market Revenue Million Forecast, by Type 2020 & 2033
- Table 10: Global Non-lethal Weapons Market Revenue Million Forecast, by Application 2020 & 2033
- Table 11: Global Non-lethal Weapons Market Revenue Million Forecast, by Country 2020 & 2033
- Table 12: United Kingdom Non-lethal Weapons Market Revenue (Million) Forecast, by Application 2020 & 2033
- Table 13: Germany Non-lethal Weapons Market Revenue (Million) Forecast, by Application 2020 & 2033
- Table 14: France Non-lethal Weapons Market Revenue (Million) Forecast, by Application 2020 & 2033
- Table 15: Rest of Europe Non-lethal Weapons Market Revenue (Million) Forecast, by Application 2020 & 2033
- Table 16: Global Non-lethal Weapons Market Revenue Million Forecast, by Type 2020 & 2033
- Table 17: Global Non-lethal Weapons Market Revenue Million Forecast, by Application 2020 & 2033
- Table 18: Global Non-lethal Weapons Market Revenue Million Forecast, by Country 2020 & 2033
- Table 19: China Non-lethal Weapons Market Revenue (Million) Forecast, by Application 2020 & 2033
- Table 20: India Non-lethal Weapons Market Revenue (Million) Forecast, by Application 2020 & 2033
- Table 21: Japan Non-lethal Weapons Market Revenue (Million) Forecast, by Application 2020 & 2033
- Table 22: South Korea Non-lethal Weapons Market Revenue (Million) Forecast, by Application 2020 & 2033
- Table 23: Rest of Asia Pacific Non-lethal Weapons Market Revenue (Million) Forecast, by Application 2020 & 2033
- Table 24: Global Non-lethal Weapons Market Revenue Million Forecast, by Type 2020 & 2033
- Table 25: Global Non-lethal Weapons Market Revenue Million Forecast, by Application 2020 & 2033
- Table 26: Global Non-lethal Weapons Market Revenue Million Forecast, by Country 2020 & 2033
- Table 27: Brazil Non-lethal Weapons Market Revenue (Million) Forecast, by Application 2020 & 2033
- Table 28: Mexico Non-lethal Weapons Market Revenue (Million) Forecast, by Application 2020 & 2033
- Table 29: Rest of Latin America Non-lethal Weapons Market Revenue (Million) Forecast, by Application 2020 & 2033
- Table 30: Global Non-lethal Weapons Market Revenue Million Forecast, by Type 2020 & 2033
- Table 31: Global Non-lethal Weapons Market Revenue Million Forecast, by Application 2020 & 2033
- Table 32: Global Non-lethal Weapons Market Revenue Million Forecast, by Country 2020 & 2033
- Table 33: United Arab Emirates Non-lethal Weapons Market Revenue (Million) Forecast, by Application 2020 & 2033
- Table 34: Saudi Arabia Non-lethal Weapons Market Revenue (Million) Forecast, by Application 2020 & 2033
- Table 35: Egypt Non-lethal Weapons Market Revenue (Million) Forecast, by Application 2020 & 2033
- Table 36: Qatar Non-lethal Weapons Market Revenue (Million) Forecast, by Application 2020 & 2033
- Table 37: Rest of Middle East and Africa Non-lethal Weapons Market Revenue (Million) Forecast, by Application 2020 & 2033
Frequently Asked Questions
1. What is the projected Compound Annual Growth Rate (CAGR) of the Non-lethal Weapons Market?
The projected CAGR is approximately 5.36%.
2. Which companies are prominent players in the Non-lethal Weapons Market?
Key companies in the market include Lamperd Less Lethal, RUAG International Holding Ltd, ISPRA, Combined Systems Inc (CSI), Rheinmetall AG, Byrna Technologies Inc, CONDOR TECNOLOGIAS Não LETALIS, AMTEC Less-Lethal Systems Inc, NonLethal Technologies Inc, RTX Corporation, Fiocchi Munizioni S p A, Zarc International Inc, Axon Enterprise Inc, UTS United Tactical Systems LLC (Pepperball), Herstal Group, Safariland LLC.
3. What are the main segments of the Non-lethal Weapons Market?
The market segments include Type, Application.
4. Can you provide details about the market size?
The market size is estimated to be USD 8.18 Million as of 2022.
5. What are some drivers contributing to market growth?
N/A
6. What are the notable trends driving market growth?
Military Segment is Anticipated to Grow with the Highest CAGR During the Forecast Period.
7. Are there any restraints impacting market growth?
N/A
8. Can you provide examples of recent developments in the market?
May 2023: The Republic of Singapore Navy's (RSN's) Sentinel-class maritime security and response vessels (MSRVs) announced that they are being equipped with Sitep Italia's multirole acoustic stabilized system (MASS). Moreover, the system will be installed across all four vessels in the Sentinel class.
9. What pricing options are available for accessing the report?
Pricing options include single-user, multi-user, and enterprise licenses priced at USD 4750, USD 5250, and USD 8750 respectively.
10. Is the market size provided in terms of value or volume?
The market size is provided in terms of value, measured in Million.
11. Are there any specific market keywords associated with the report?
Yes, the market keyword associated with the report is "Non-lethal Weapons Market," which aids in identifying and referencing the specific market segment covered.
12. How do I determine which pricing option suits my needs best?
The pricing options vary based on user requirements and access needs. Individual users may opt for single-user licenses, while businesses requiring broader access may choose multi-user or enterprise licenses for cost-effective access to the report.
13. Are there any additional resources or data provided in the Non-lethal Weapons Market report?
While the report offers comprehensive insights, it's advisable to review the specific contents or supplementary materials provided to ascertain if additional resources or data are available.
14. How can I stay updated on further developments or reports in the Non-lethal Weapons Market?
To stay informed about further developments, trends, and reports in the Non-lethal Weapons Market, consider subscribing to industry newsletters, following relevant companies and organizations, or regularly checking reputable industry news sources and publications.
Methodology
Step 1 - Identification of Relevant Samples Size from Population Database


Step 2 - Approaches for Defining Global Market Size (Value, Volume* & Price*)

Note*: In applicable scenarios
Step 3 - Data Sources
Primary Research
- Web Analytics
- Survey Reports
- Research Institute
- Latest Research Reports
- Opinion Leaders
Secondary Research
- Annual Reports
- White Paper
- Latest Press Release
- Industry Association
- Paid Database
- Investor Presentations

Step 4 - Data Triangulation
Involves using different sources of information in order to increase the validity of a study
These sources are likely to be stakeholders in a program - participants, other researchers, program staff, other community members, and so on.
Then we put all data in single framework & apply various statistical tools to find out the dynamic on the market.
During the analysis stage, feedback from the stakeholder groups would be compared to determine areas of agreement as well as areas of divergence