

Key Insights
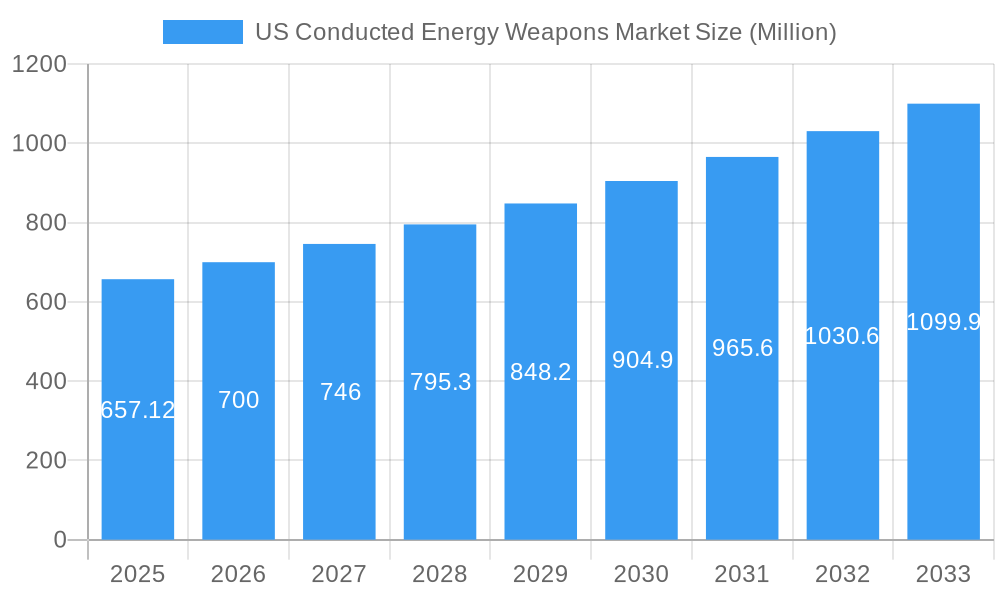
The US Conducted Energy Weapons (CEW) market, valued at $657.12 million in 2025, is projected to experience robust growth, driven by increasing demand from law enforcement agencies and a rising personal safety consciousness among consumers. The market's Compound Annual Growth Rate (CAGR) of 6.21% from 2025 to 2033 indicates a significant expansion over the forecast period. Key drivers include the proven effectiveness of CEWs in subduing suspects with minimal lethal force, stringent regulations promoting non-lethal alternatives to firearms, and advancements in CEW technology leading to improved safety features and performance. The market is segmented by weapon type (stun guns, tasers, stun batons), equipment type (weapons, cartridges), and end-user (law enforcement, personal use). Law enforcement agencies represent a substantial portion of the market, fueled by budget allocations for upgrading equipment and training programs. The personal use segment is expanding due to increased awareness of self-defense options, particularly among women and elderly individuals. Geographic distribution reveals strong demand across all US regions, with potential for varied growth rates based on factors like population density, crime rates, and legislative environments. Competition is evident among established players like Axon Enterprise, SABRE, and Vipertek, alongside smaller manufacturers catering to specialized niches.
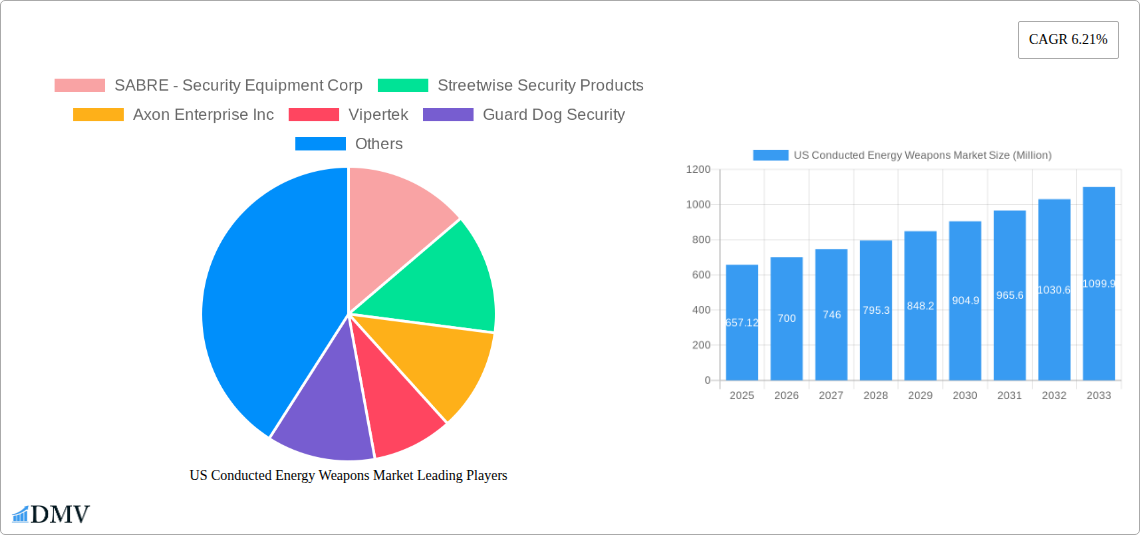
US Conducted Energy Weapons Market Market Size (In Million)
Growth in the US CEW market will be influenced by factors such as technological innovation (e.g., development of smarter, more effective devices with improved safety features), evolving law enforcement policies on the use of force, and public perception of CEWs. Regulatory changes concerning the sale and use of CEWs will also play a key role. Potential restraints include concerns regarding the potential for misuse and the need for comprehensive training programs for users. Furthermore, the market may face challenges from emerging non-lethal technologies and the potential for cost sensitivity in budget-constrained environments. However, the overall trajectory suggests a positive outlook, with sustained growth driven by the persistent need for effective and safer alternatives to traditional firearms in both law enforcement and civilian applications. Market penetration into new segments and continued technological advancements are likely to further propel market expansion.
US Conducted Energy Weapons Market Company Market Share
US Conducted Energy Weapons Market: A Comprehensive Report (2019-2033)
This insightful report provides a detailed analysis of the US Conducted Energy Weapons (CEW) market, offering a comprehensive overview of its current state, future trajectory, and key players. Covering the period from 2019 to 2033, with 2025 as the base and estimated year, this report is essential for stakeholders seeking to understand this dynamic market. The market size is estimated at $XX Million in 2025 and is projected to reach $XX Million by 2033, exhibiting a CAGR of XX%.
US Conducted Energy Weapons Market Market Composition & Trends
This section delves into the intricate dynamics of the US CEW market, examining market concentration, innovation, regulation, and competitive activity. We analyze the market share distribution among key players like Axon Enterprise Inc, SABRE - Security Equipment Corp, and Vipertek, revealing a moderately concentrated market with opportunities for both established players and new entrants. The report further explores the impact of regulatory landscapes, particularly concerning the use of CEWs by law enforcement and civilians. The substitution effect of alternative non-lethal weaponry and the increasing adoption of advanced technologies are also comprehensively analyzed. Furthermore, the report meticulously documents recent mergers and acquisitions (M&A) within the industry, including deal values and their impact on market consolidation.
- Market Concentration: High concentration with top 5 players holding XX% market share in 2025.
- Innovation Catalysts: Advancements in battery technology, smart targeting systems, and data analytics are driving innovation.
- Regulatory Landscape: Stringent regulations regarding CEW usage and sale vary across states, impacting market growth.
- Substitute Products: Pepper spray, batons, and other less-lethal options pose competitive threats.
- End-User Profiles: Detailed analysis of law enforcement agencies' adoption and personal use trends.
- M&A Activities: Review of recent M&A deals with estimated values exceeding $XX Million in the last five years.
US Conducted Energy Weapons Market Industry Evolution
This in-depth analysis traces the evolution of the US CEW market from 2019 to 2024, projecting its trajectory through 2033. We examine the historical growth rates, technological breakthroughs, shifting consumer preferences (towards more user-friendly and safer devices), and the impact of external factors like increased public awareness of police brutality and the rise of body cameras. The report identifies key technological advancements such as improved energy efficiency, smaller form factors, and advanced safety features. The analysis showcases the increasing demand for CEWs from law enforcement agencies due to their effectiveness in non-lethal apprehension and the growing personal safety concerns among civilians driving the consumer segment. Adoption metrics across various end-user segments are included, along with projections for future adoption.
- Growth Rate (2019-2024): XX% CAGR
- Projected Growth Rate (2025-2033): XX% CAGR
- Adoption Rate in Law Enforcement: XX% in 2025, projected to reach XX% by 2033.
- Adoption Rate in Personal Use: XX% in 2025, projected to reach XX% by 2033.
Leading Regions, Countries, or Segments in US Conducted Energy Weapons Market
This section identifies the leading segments and regions within the US CEW market. The analysis focuses on market share, growth drivers, and key factors influencing dominance. We dissect performance across different CEW types (Stun Guns, Tasers, Stun Batons), equipment types (Weapons, Cartridges), and end-user segments (Law Enforcement Agencies, Personal Use). For instance, the report highlights the leading region based on market value and volume and dives into the contributing factors for that dominance.
- Key Drivers (Law Enforcement Segment): Increased budgetary allocations for non-lethal equipment, mandatory training programs for officers, and improved public perception of CEWs in reducing use-of-force incidents.
- Key Drivers (Personal Use Segment): Rising awareness of personal safety concerns, particularly among women, and increased affordability of consumer-grade CEWs.
- Dominant Segment (Type): Tasers, driven by their superior stopping power and widespread adoption by law enforcement agencies.
- Dominant Segment (Equipment Type): Weapons, as they constitute the core product within the market.
- Dominant Region: [Specific State/Region] - due to factors such as [specific reason, e.g., higher crime rates, stringent regulations requiring CEW usage].
US Conducted Energy Weapons Market Product Innovations
Recent years have witnessed significant innovations in CEW technology. Manufacturers are focusing on enhanced safety features to minimize the risk of unintended harm, improved ergonomics for enhanced usability, and more effective incapacitation mechanisms. These advancements include smaller, lighter devices with improved battery life and smart features like integrated cameras or data logging capabilities. This has led to unique selling propositions emphasizing user safety and effectiveness, boosting market appeal across both law enforcement and consumer segments.
Propelling Factors for US Conducted Energy Weapons Market Growth
The US CEW market is driven by several key factors. The rising crime rates and concerns over public safety are leading to increased demand from law enforcement agencies. Furthermore, technological advancements resulting in safer and more effective CEWs are driving adoption in both the law enforcement and consumer markets. Finally, supportive regulatory frameworks in certain regions are also fostering market growth.
Obstacles in the US Conducted Energy Weapons Market Market
Despite its growth potential, the US CEW market faces several challenges. Stricter regulations and liability concerns surrounding CEW use can hinder market expansion. Supply chain disruptions related to raw materials or component sourcing can impact production and delivery. Moreover, increasing competition from established players and new entrants creates price pressures and necessitates continuous innovation to maintain market share.
Future Opportunities in US Conducted Energy Weapons Market
Emerging opportunities abound in the CEW market. The development of more sophisticated non-lethal technologies, integration with body cameras and data analytics platforms, and expanding into new market segments (such as security personnel or private security firms) offer substantial growth potential. Moreover, the increasing adoption of CEWs by civilian security personnel and private citizens, driven by increasing public safety concerns, presents a major untapped market.
Major Players in the US Conducted Energy Weapons Market Ecosystem
- SABRE - Security Equipment Corp
- Streetwise Security Products
- Axon Enterprise Inc
- Vipertek
- Guard Dog Security
- PhaZZer LL
- Foxfend
Key Developments in US Conducted Energy Weapons Market Industry
- [Month, Year]: Axon Enterprise Inc. launched a new Taser model with improved safety features.
- [Month, Year]: SABRE - Security Equipment Corp. announced a partnership with a major distributor expanding its reach in the law enforcement segment.
- [Month, Year]: New regulations regarding CEW use were implemented in [State].
- [Month, Year]: A significant M&A transaction occurred in the industry, consolidating market share.
Strategic US Conducted Energy Weapons Market Market Forecast
The US CEW market is poised for continued growth, driven by ongoing technological advancements, increasing demand from both law enforcement and civilian markets, and the potential for expansion into new application areas. The market's trajectory will be significantly impacted by regulatory changes, technological innovations, and competition dynamics. However, the overall outlook remains positive, with significant opportunities for growth and innovation in the forecast period.
US Conducted Energy Weapons Market Segmentation
- 1. Production Analysis
- 2. Consumption Analysis
- 3. Import Market Analysis (Value & Volume)
- 4. Export Market Analysis (Value & Volume)
- 5. Price Trend Analysis
US Conducted Energy Weapons Market Segmentation By Geography
-
1. North America
- 1.1. United States
- 1.2. Canada
- 1.3. Mexico
-
2. South America
- 2.1. Brazil
- 2.2. Argentina
- 2.3. Rest of South America
-
3. Europe
- 3.1. United Kingdom
- 3.2. Germany
- 3.3. France
- 3.4. Italy
- 3.5. Spain
- 3.6. Russia
- 3.7. Benelux
- 3.8. Nordics
- 3.9. Rest of Europe
-
4. Middle East & Africa
- 4.1. Turkey
- 4.2. Israel
- 4.3. GCC
- 4.4. North Africa
- 4.5. South Africa
- 4.6. Rest of Middle East & Africa
-
5. Asia Pacific
- 5.1. China
- 5.2. India
- 5.3. Japan
- 5.4. South Korea
- 5.5. ASEAN
- 5.6. Oceania
- 5.7. Rest of Asia Pacific
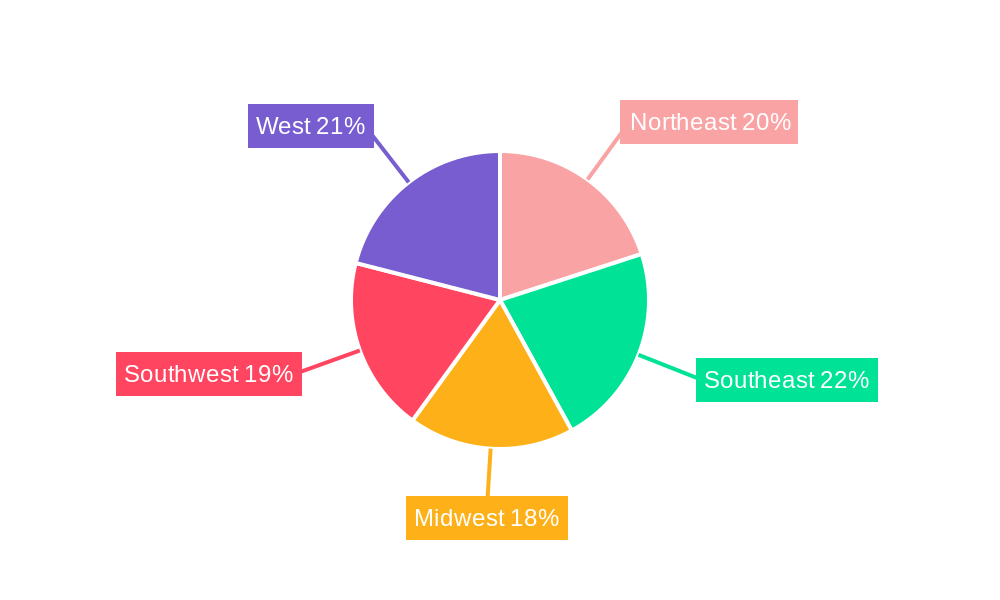
US Conducted Energy Weapons Market Regional Market Share
Geographic Coverage of US Conducted Energy Weapons Market
US Conducted Energy Weapons Market REPORT HIGHLIGHTS
| Aspects | Details |
|---|---|
| Study Period | 2020-2034 |
| Base Year | 2025 |
| Estimated Year | 2026 |
| Forecast Period | 2026-2034 |
| Historical Period | 2020-2025 |
| Growth Rate | CAGR of 6.21% from 2020-2034 |
| Segmentation |
|
Table of Contents
- 1. Introduction
- 1.1. Research Scope
- 1.2. Market Segmentation
- 1.3. Research Objective
- 1.4. Definitions and Assumptions
- 2. Executive Summary
- 2.1. Market Snapshot
- 3. Market Dynamics
- 3.1. Market Drivers
- 3.2. Market Restrains
- 3.3. Market Trends
- 3.4. Market Opportunities
- 4. Market Factor Analysis
- 4.1. Porters Five Forces
- 4.1.1. Bargaining Power of Suppliers
- 4.1.2. Bargaining Power of Buyers
- 4.1.3. Threat of New Entrants
- 4.1.4. Threat of Substitutes
- 4.1.5. Competitive Rivalry
- 4.2. PESTEL analysis
- 4.3. BCG Analysis
- 4.3.1. Stars (High Growth, High Market Share)
- 4.3.2. Cash Cows (Low Growth, High Market Share)
- 4.3.3. Question Mark (High Growth, Low Market Share)
- 4.3.4. Dogs (Low Growth, Low Market Share)
- 4.4. Ansoff Matrix Analysis
- 4.5. Supply Chain Analysis
- 4.6. Regulatory Landscape
- 4.7. Current Market Potential and Opportunity Assessment (TAM–SAM–SOM Framework)
- 4.8. DMV Analyst Note
- 4.1. Porters Five Forces
- 5. Market Analysis, Insights and Forecast 2021-2033
- 5.1. Market Analysis, Insights and Forecast - by Production Analysis
- 5.2. Market Analysis, Insights and Forecast - by Consumption Analysis
- 5.3. Market Analysis, Insights and Forecast - by Import Market Analysis (Value & Volume)
- 5.4. Market Analysis, Insights and Forecast - by Export Market Analysis (Value & Volume)
- 5.5. Market Analysis, Insights and Forecast - by Price Trend Analysis
- 5.6. Market Analysis, Insights and Forecast - by Region
- 5.6.1. North America
- 5.6.2. South America
- 5.6.3. Europe
- 5.6.4. Middle East & Africa
- 5.6.5. Asia Pacific
- 6. Global US Conducted Energy Weapons Market Analysis, Insights and Forecast, 2021-2033
- 6.1. Market Analysis, Insights and Forecast - by Production Analysis
- 6.2. Market Analysis, Insights and Forecast - by Consumption Analysis
- 6.3. Market Analysis, Insights and Forecast - by Import Market Analysis (Value & Volume)
- 6.4. Market Analysis, Insights and Forecast - by Export Market Analysis (Value & Volume)
- 6.5. Market Analysis, Insights and Forecast - by Price Trend Analysis
- 7. North America US Conducted Energy Weapons Market Analysis, Insights and Forecast, 2020-2032
- 7.1. Market Analysis, Insights and Forecast - by Production Analysis
- 7.2. Market Analysis, Insights and Forecast - by Consumption Analysis
- 7.3. Market Analysis, Insights and Forecast - by Import Market Analysis (Value & Volume)
- 7.4. Market Analysis, Insights and Forecast - by Export Market Analysis (Value & Volume)
- 7.5. Market Analysis, Insights and Forecast - by Price Trend Analysis
- 8. South America US Conducted Energy Weapons Market Analysis, Insights and Forecast, 2020-2032
- 8.1. Market Analysis, Insights and Forecast - by Production Analysis
- 8.2. Market Analysis, Insights and Forecast - by Consumption Analysis
- 8.3. Market Analysis, Insights and Forecast - by Import Market Analysis (Value & Volume)
- 8.4. Market Analysis, Insights and Forecast - by Export Market Analysis (Value & Volume)
- 8.5. Market Analysis, Insights and Forecast - by Price Trend Analysis
- 9. Europe US Conducted Energy Weapons Market Analysis, Insights and Forecast, 2020-2032
- 9.1. Market Analysis, Insights and Forecast - by Production Analysis
- 9.2. Market Analysis, Insights and Forecast - by Consumption Analysis
- 9.3. Market Analysis, Insights and Forecast - by Import Market Analysis (Value & Volume)
- 9.4. Market Analysis, Insights and Forecast - by Export Market Analysis (Value & Volume)
- 9.5. Market Analysis, Insights and Forecast - by Price Trend Analysis
- 10. Middle East & Africa US Conducted Energy Weapons Market Analysis, Insights and Forecast, 2020-2032
- 10.1. Market Analysis, Insights and Forecast - by Production Analysis
- 10.2. Market Analysis, Insights and Forecast - by Consumption Analysis
- 10.3. Market Analysis, Insights and Forecast - by Import Market Analysis (Value & Volume)
- 10.4. Market Analysis, Insights and Forecast - by Export Market Analysis (Value & Volume)
- 10.5. Market Analysis, Insights and Forecast - by Price Trend Analysis
- 11. Asia Pacific US Conducted Energy Weapons Market Analysis, Insights and Forecast, 2020-2032
- 11.1. Market Analysis, Insights and Forecast - by Production Analysis
- 11.2. Market Analysis, Insights and Forecast - by Consumption Analysis
- 11.3. Market Analysis, Insights and Forecast - by Import Market Analysis (Value & Volume)
- 11.4. Market Analysis, Insights and Forecast - by Export Market Analysis (Value & Volume)
- 11.5. Market Analysis, Insights and Forecast - by Price Trend Analysis
- 12. Competitive Analysis
- 12.1. Company Profiles
- 12.1.1 SABRE - Security Equipment Corp
- 12.1.1.1. Company Overview
- 12.1.1.2. Products
- 12.1.1.3. Company Financials
- 12.1.1.4. SWOT Analysis
- 12.1.2 Streetwise Security Products
- 12.1.2.1. Company Overview
- 12.1.2.2. Products
- 12.1.2.3. Company Financials
- 12.1.2.4. SWOT Analysis
- 12.1.3 Axon Enterprise Inc
- 12.1.3.1. Company Overview
- 12.1.3.2. Products
- 12.1.3.3. Company Financials
- 12.1.3.4. SWOT Analysis
- 12.1.4 Vipertek
- 12.1.4.1. Company Overview
- 12.1.4.2. Products
- 12.1.4.3. Company Financials
- 12.1.4.4. SWOT Analysis
- 12.1.5 Guard Dog Security
- 12.1.5.1. Company Overview
- 12.1.5.2. Products
- 12.1.5.3. Company Financials
- 12.1.5.4. SWOT Analysis
- 12.1.6 PhaZZer LL
- 12.1.6.1. Company Overview
- 12.1.6.2. Products
- 12.1.6.3. Company Financials
- 12.1.6.4. SWOT Analysis
- 12.1.7 Foxfend
- 12.1.7.1. Company Overview
- 12.1.7.2. Products
- 12.1.7.3. Company Financials
- 12.1.7.4. SWOT Analysis
- 12.1.1 SABRE - Security Equipment Corp
- 12.2. Market Entropy
- 12.2.1 Company's Key Areas Served
- 12.2.2 Recent Developments
- 12.3. Company Market Share Analysis 2025
- 12.3.1 Top 5 Companies Market Share Analysis
- 12.3.2 Top 3 Companies Market Share Analysis
- 12.4. List of Potential Customers
- 13. Research Methodology
List of Figures
- Figure 1: Global US Conducted Energy Weapons Market Revenue Breakdown (Million, %) by Region 2025 & 2033
- Figure 2: North America US Conducted Energy Weapons Market Revenue (Million), by Production Analysis 2025 & 2033
- Figure 3: North America US Conducted Energy Weapons Market Revenue Share (%), by Production Analysis 2025 & 2033
- Figure 4: North America US Conducted Energy Weapons Market Revenue (Million), by Consumption Analysis 2025 & 2033
- Figure 5: North America US Conducted Energy Weapons Market Revenue Share (%), by Consumption Analysis 2025 & 2033
- Figure 6: North America US Conducted Energy Weapons Market Revenue (Million), by Import Market Analysis (Value & Volume) 2025 & 2033
- Figure 7: North America US Conducted Energy Weapons Market Revenue Share (%), by Import Market Analysis (Value & Volume) 2025 & 2033
- Figure 8: North America US Conducted Energy Weapons Market Revenue (Million), by Export Market Analysis (Value & Volume) 2025 & 2033
- Figure 9: North America US Conducted Energy Weapons Market Revenue Share (%), by Export Market Analysis (Value & Volume) 2025 & 2033
- Figure 10: North America US Conducted Energy Weapons Market Revenue (Million), by Price Trend Analysis 2025 & 2033
- Figure 11: North America US Conducted Energy Weapons Market Revenue Share (%), by Price Trend Analysis 2025 & 2033
- Figure 12: North America US Conducted Energy Weapons Market Revenue (Million), by Country 2025 & 2033
- Figure 13: North America US Conducted Energy Weapons Market Revenue Share (%), by Country 2025 & 2033
- Figure 14: South America US Conducted Energy Weapons Market Revenue (Million), by Production Analysis 2025 & 2033
- Figure 15: South America US Conducted Energy Weapons Market Revenue Share (%), by Production Analysis 2025 & 2033
- Figure 16: South America US Conducted Energy Weapons Market Revenue (Million), by Consumption Analysis 2025 & 2033
- Figure 17: South America US Conducted Energy Weapons Market Revenue Share (%), by Consumption Analysis 2025 & 2033
- Figure 18: South America US Conducted Energy Weapons Market Revenue (Million), by Import Market Analysis (Value & Volume) 2025 & 2033
- Figure 19: South America US Conducted Energy Weapons Market Revenue Share (%), by Import Market Analysis (Value & Volume) 2025 & 2033
- Figure 20: South America US Conducted Energy Weapons Market Revenue (Million), by Export Market Analysis (Value & Volume) 2025 & 2033
- Figure 21: South America US Conducted Energy Weapons Market Revenue Share (%), by Export Market Analysis (Value & Volume) 2025 & 2033
- Figure 22: South America US Conducted Energy Weapons Market Revenue (Million), by Price Trend Analysis 2025 & 2033
- Figure 23: South America US Conducted Energy Weapons Market Revenue Share (%), by Price Trend Analysis 2025 & 2033
- Figure 24: South America US Conducted Energy Weapons Market Revenue (Million), by Country 2025 & 2033
- Figure 25: South America US Conducted Energy Weapons Market Revenue Share (%), by Country 2025 & 2033
- Figure 26: Europe US Conducted Energy Weapons Market Revenue (Million), by Production Analysis 2025 & 2033
- Figure 27: Europe US Conducted Energy Weapons Market Revenue Share (%), by Production Analysis 2025 & 2033
- Figure 28: Europe US Conducted Energy Weapons Market Revenue (Million), by Consumption Analysis 2025 & 2033
- Figure 29: Europe US Conducted Energy Weapons Market Revenue Share (%), by Consumption Analysis 2025 & 2033
- Figure 30: Europe US Conducted Energy Weapons Market Revenue (Million), by Import Market Analysis (Value & Volume) 2025 & 2033
- Figure 31: Europe US Conducted Energy Weapons Market Revenue Share (%), by Import Market Analysis (Value & Volume) 2025 & 2033
- Figure 32: Europe US Conducted Energy Weapons Market Revenue (Million), by Export Market Analysis (Value & Volume) 2025 & 2033
- Figure 33: Europe US Conducted Energy Weapons Market Revenue Share (%), by Export Market Analysis (Value & Volume) 2025 & 2033
- Figure 34: Europe US Conducted Energy Weapons Market Revenue (Million), by Price Trend Analysis 2025 & 2033
- Figure 35: Europe US Conducted Energy Weapons Market Revenue Share (%), by Price Trend Analysis 2025 & 2033
- Figure 36: Europe US Conducted Energy Weapons Market Revenue (Million), by Country 2025 & 2033
- Figure 37: Europe US Conducted Energy Weapons Market Revenue Share (%), by Country 2025 & 2033
- Figure 38: Middle East & Africa US Conducted Energy Weapons Market Revenue (Million), by Production Analysis 2025 & 2033
- Figure 39: Middle East & Africa US Conducted Energy Weapons Market Revenue Share (%), by Production Analysis 2025 & 2033
- Figure 40: Middle East & Africa US Conducted Energy Weapons Market Revenue (Million), by Consumption Analysis 2025 & 2033
- Figure 41: Middle East & Africa US Conducted Energy Weapons Market Revenue Share (%), by Consumption Analysis 2025 & 2033
- Figure 42: Middle East & Africa US Conducted Energy Weapons Market Revenue (Million), by Import Market Analysis (Value & Volume) 2025 & 2033
- Figure 43: Middle East & Africa US Conducted Energy Weapons Market Revenue Share (%), by Import Market Analysis (Value & Volume) 2025 & 2033
- Figure 44: Middle East & Africa US Conducted Energy Weapons Market Revenue (Million), by Export Market Analysis (Value & Volume) 2025 & 2033
- Figure 45: Middle East & Africa US Conducted Energy Weapons Market Revenue Share (%), by Export Market Analysis (Value & Volume) 2025 & 2033
- Figure 46: Middle East & Africa US Conducted Energy Weapons Market Revenue (Million), by Price Trend Analysis 2025 & 2033
- Figure 47: Middle East & Africa US Conducted Energy Weapons Market Revenue Share (%), by Price Trend Analysis 2025 & 2033
- Figure 48: Middle East & Africa US Conducted Energy Weapons Market Revenue (Million), by Country 2025 & 2033
- Figure 49: Middle East & Africa US Conducted Energy Weapons Market Revenue Share (%), by Country 2025 & 2033
- Figure 50: Asia Pacific US Conducted Energy Weapons Market Revenue (Million), by Production Analysis 2025 & 2033
- Figure 51: Asia Pacific US Conducted Energy Weapons Market Revenue Share (%), by Production Analysis 2025 & 2033
- Figure 52: Asia Pacific US Conducted Energy Weapons Market Revenue (Million), by Consumption Analysis 2025 & 2033
- Figure 53: Asia Pacific US Conducted Energy Weapons Market Revenue Share (%), by Consumption Analysis 2025 & 2033
- Figure 54: Asia Pacific US Conducted Energy Weapons Market Revenue (Million), by Import Market Analysis (Value & Volume) 2025 & 2033
- Figure 55: Asia Pacific US Conducted Energy Weapons Market Revenue Share (%), by Import Market Analysis (Value & Volume) 2025 & 2033
- Figure 56: Asia Pacific US Conducted Energy Weapons Market Revenue (Million), by Export Market Analysis (Value & Volume) 2025 & 2033
- Figure 57: Asia Pacific US Conducted Energy Weapons Market Revenue Share (%), by Export Market Analysis (Value & Volume) 2025 & 2033
- Figure 58: Asia Pacific US Conducted Energy Weapons Market Revenue (Million), by Price Trend Analysis 2025 & 2033
- Figure 59: Asia Pacific US Conducted Energy Weapons Market Revenue Share (%), by Price Trend Analysis 2025 & 2033
- Figure 60: Asia Pacific US Conducted Energy Weapons Market Revenue (Million), by Country 2025 & 2033
- Figure 61: Asia Pacific US Conducted Energy Weapons Market Revenue Share (%), by Country 2025 & 2033
List of Tables
- Table 1: Global US Conducted Energy Weapons Market Revenue Million Forecast, by Production Analysis 2020 & 2033
- Table 2: Global US Conducted Energy Weapons Market Revenue Million Forecast, by Consumption Analysis 2020 & 2033
- Table 3: Global US Conducted Energy Weapons Market Revenue Million Forecast, by Import Market Analysis (Value & Volume) 2020 & 2033
- Table 4: Global US Conducted Energy Weapons Market Revenue Million Forecast, by Export Market Analysis (Value & Volume) 2020 & 2033
- Table 5: Global US Conducted Energy Weapons Market Revenue Million Forecast, by Price Trend Analysis 2020 & 2033
- Table 6: Global US Conducted Energy Weapons Market Revenue Million Forecast, by Region 2020 & 2033
- Table 7: Global US Conducted Energy Weapons Market Revenue Million Forecast, by Production Analysis 2020 & 2033
- Table 8: Global US Conducted Energy Weapons Market Revenue Million Forecast, by Consumption Analysis 2020 & 2033
- Table 9: Global US Conducted Energy Weapons Market Revenue Million Forecast, by Import Market Analysis (Value & Volume) 2020 & 2033
- Table 10: Global US Conducted Energy Weapons Market Revenue Million Forecast, by Export Market Analysis (Value & Volume) 2020 & 2033
- Table 11: Global US Conducted Energy Weapons Market Revenue Million Forecast, by Price Trend Analysis 2020 & 2033
- Table 12: Global US Conducted Energy Weapons Market Revenue Million Forecast, by Country 2020 & 2033
- Table 13: United States US Conducted Energy Weapons Market Revenue (Million) Forecast, by Application 2020 & 2033
- Table 14: Canada US Conducted Energy Weapons Market Revenue (Million) Forecast, by Application 2020 & 2033
- Table 15: Mexico US Conducted Energy Weapons Market Revenue (Million) Forecast, by Application 2020 & 2033
- Table 16: Global US Conducted Energy Weapons Market Revenue Million Forecast, by Production Analysis 2020 & 2033
- Table 17: Global US Conducted Energy Weapons Market Revenue Million Forecast, by Consumption Analysis 2020 & 2033
- Table 18: Global US Conducted Energy Weapons Market Revenue Million Forecast, by Import Market Analysis (Value & Volume) 2020 & 2033
- Table 19: Global US Conducted Energy Weapons Market Revenue Million Forecast, by Export Market Analysis (Value & Volume) 2020 & 2033
- Table 20: Global US Conducted Energy Weapons Market Revenue Million Forecast, by Price Trend Analysis 2020 & 2033
- Table 21: Global US Conducted Energy Weapons Market Revenue Million Forecast, by Country 2020 & 2033
- Table 22: Brazil US Conducted Energy Weapons Market Revenue (Million) Forecast, by Application 2020 & 2033
- Table 23: Argentina US Conducted Energy Weapons Market Revenue (Million) Forecast, by Application 2020 & 2033
- Table 24: Rest of South America US Conducted Energy Weapons Market Revenue (Million) Forecast, by Application 2020 & 2033
- Table 25: Global US Conducted Energy Weapons Market Revenue Million Forecast, by Production Analysis 2020 & 2033
- Table 26: Global US Conducted Energy Weapons Market Revenue Million Forecast, by Consumption Analysis 2020 & 2033
- Table 27: Global US Conducted Energy Weapons Market Revenue Million Forecast, by Import Market Analysis (Value & Volume) 2020 & 2033
- Table 28: Global US Conducted Energy Weapons Market Revenue Million Forecast, by Export Market Analysis (Value & Volume) 2020 & 2033
- Table 29: Global US Conducted Energy Weapons Market Revenue Million Forecast, by Price Trend Analysis 2020 & 2033
- Table 30: Global US Conducted Energy Weapons Market Revenue Million Forecast, by Country 2020 & 2033
- Table 31: United Kingdom US Conducted Energy Weapons Market Revenue (Million) Forecast, by Application 2020 & 2033
- Table 32: Germany US Conducted Energy Weapons Market Revenue (Million) Forecast, by Application 2020 & 2033
- Table 33: France US Conducted Energy Weapons Market Revenue (Million) Forecast, by Application 2020 & 2033
- Table 34: Italy US Conducted Energy Weapons Market Revenue (Million) Forecast, by Application 2020 & 2033
- Table 35: Spain US Conducted Energy Weapons Market Revenue (Million) Forecast, by Application 2020 & 2033
- Table 36: Russia US Conducted Energy Weapons Market Revenue (Million) Forecast, by Application 2020 & 2033
- Table 37: Benelux US Conducted Energy Weapons Market Revenue (Million) Forecast, by Application 2020 & 2033
- Table 38: Nordics US Conducted Energy Weapons Market Revenue (Million) Forecast, by Application 2020 & 2033
- Table 39: Rest of Europe US Conducted Energy Weapons Market Revenue (Million) Forecast, by Application 2020 & 2033
- Table 40: Global US Conducted Energy Weapons Market Revenue Million Forecast, by Production Analysis 2020 & 2033
- Table 41: Global US Conducted Energy Weapons Market Revenue Million Forecast, by Consumption Analysis 2020 & 2033
- Table 42: Global US Conducted Energy Weapons Market Revenue Million Forecast, by Import Market Analysis (Value & Volume) 2020 & 2033
- Table 43: Global US Conducted Energy Weapons Market Revenue Million Forecast, by Export Market Analysis (Value & Volume) 2020 & 2033
- Table 44: Global US Conducted Energy Weapons Market Revenue Million Forecast, by Price Trend Analysis 2020 & 2033
- Table 45: Global US Conducted Energy Weapons Market Revenue Million Forecast, by Country 2020 & 2033
- Table 46: Turkey US Conducted Energy Weapons Market Revenue (Million) Forecast, by Application 2020 & 2033
- Table 47: Israel US Conducted Energy Weapons Market Revenue (Million) Forecast, by Application 2020 & 2033
- Table 48: GCC US Conducted Energy Weapons Market Revenue (Million) Forecast, by Application 2020 & 2033
- Table 49: North Africa US Conducted Energy Weapons Market Revenue (Million) Forecast, by Application 2020 & 2033
- Table 50: South Africa US Conducted Energy Weapons Market Revenue (Million) Forecast, by Application 2020 & 2033
- Table 51: Rest of Middle East & Africa US Conducted Energy Weapons Market Revenue (Million) Forecast, by Application 2020 & 2033
- Table 52: Global US Conducted Energy Weapons Market Revenue Million Forecast, by Production Analysis 2020 & 2033
- Table 53: Global US Conducted Energy Weapons Market Revenue Million Forecast, by Consumption Analysis 2020 & 2033
- Table 54: Global US Conducted Energy Weapons Market Revenue Million Forecast, by Import Market Analysis (Value & Volume) 2020 & 2033
- Table 55: Global US Conducted Energy Weapons Market Revenue Million Forecast, by Export Market Analysis (Value & Volume) 2020 & 2033
- Table 56: Global US Conducted Energy Weapons Market Revenue Million Forecast, by Price Trend Analysis 2020 & 2033
- Table 57: Global US Conducted Energy Weapons Market Revenue Million Forecast, by Country 2020 & 2033
- Table 58: China US Conducted Energy Weapons Market Revenue (Million) Forecast, by Application 2020 & 2033
- Table 59: India US Conducted Energy Weapons Market Revenue (Million) Forecast, by Application 2020 & 2033
- Table 60: Japan US Conducted Energy Weapons Market Revenue (Million) Forecast, by Application 2020 & 2033
- Table 61: South Korea US Conducted Energy Weapons Market Revenue (Million) Forecast, by Application 2020 & 2033
- Table 62: ASEAN US Conducted Energy Weapons Market Revenue (Million) Forecast, by Application 2020 & 2033
- Table 63: Oceania US Conducted Energy Weapons Market Revenue (Million) Forecast, by Application 2020 & 2033
- Table 64: Rest of Asia Pacific US Conducted Energy Weapons Market Revenue (Million) Forecast, by Application 2020 & 2033
Frequently Asked Questions
1. What is the projected Compound Annual Growth Rate (CAGR) of the US Conducted Energy Weapons Market?
The projected CAGR is approximately 6.21%.
2. Which companies are prominent players in the US Conducted Energy Weapons Market?
Key companies in the market include SABRE - Security Equipment Corp, Streetwise Security Products, Axon Enterprise Inc, Vipertek, Guard Dog Security, PhaZZer LL, Foxfend.
3. What are the main segments of the US Conducted Energy Weapons Market?
The market segments include Production Analysis, Consumption Analysis, Import Market Analysis (Value & Volume), Export Market Analysis (Value & Volume), Price Trend Analysis.
4. Can you provide details about the market size?
The market size is estimated to be USD 657.12 Million as of 2022.
5. What are some drivers contributing to market growth?
; Increased Seaborne Threats And Ambiguous Maritime Security Policies; Increasing Adoption Of Security Technologies In Bric Countries.
6. What are the notable trends driving market growth?
Increasing Incidents of Civil Unrest Driving Procurement.
7. Are there any restraints impacting market growth?
; High Risk Rate In Ungoverned Zones; Unstructured Security Standards And Technologies.
8. Can you provide examples of recent developments in the market?
N/A
9. What pricing options are available for accessing the report?
Pricing options include single-user, multi-user, and enterprise licenses priced at USD 3800, USD 4500, and USD 5800 respectively.
10. Is the market size provided in terms of value or volume?
The market size is provided in terms of value, measured in Million.
11. Are there any specific market keywords associated with the report?
Yes, the market keyword associated with the report is "US Conducted Energy Weapons Market," which aids in identifying and referencing the specific market segment covered.
12. How do I determine which pricing option suits my needs best?
The pricing options vary based on user requirements and access needs. Individual users may opt for single-user licenses, while businesses requiring broader access may choose multi-user or enterprise licenses for cost-effective access to the report.
13. Are there any additional resources or data provided in the US Conducted Energy Weapons Market report?
While the report offers comprehensive insights, it's advisable to review the specific contents or supplementary materials provided to ascertain if additional resources or data are available.
14. How can I stay updated on further developments or reports in the US Conducted Energy Weapons Market?
To stay informed about further developments, trends, and reports in the US Conducted Energy Weapons Market, consider subscribing to industry newsletters, following relevant companies and organizations, or regularly checking reputable industry news sources and publications.
Methodology
Step 1 - Identification of Relevant Samples Size from Population Database


Step 2 - Approaches for Defining Global Market Size (Value, Volume* & Price*)

Note*: In applicable scenarios
Step 3 - Data Sources
Primary Research
- Web Analytics
- Survey Reports
- Research Institute
- Latest Research Reports
- Opinion Leaders
Secondary Research
- Annual Reports
- White Paper
- Latest Press Release
- Industry Association
- Paid Database
- Investor Presentations

Step 4 - Data Triangulation
Involves using different sources of information in order to increase the validity of a study
These sources are likely to be stakeholders in a program - participants, other researchers, program staff, other community members, and so on.
Then we put all data in single framework & apply various statistical tools to find out the dynamic on the market.
During the analysis stage, feedback from the stakeholder groups would be compared to determine areas of agreement as well as areas of divergence