

Key Insights
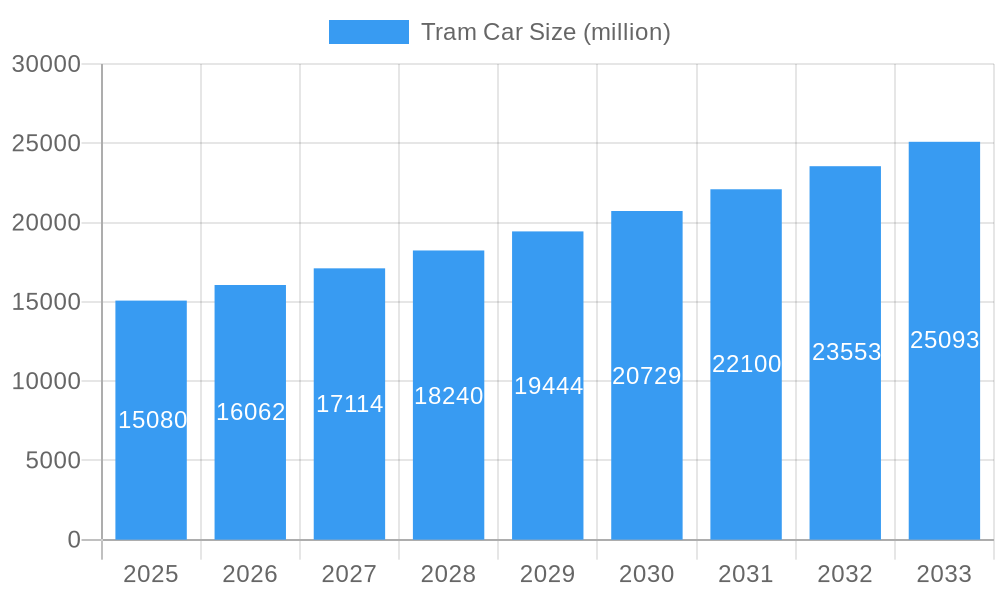
The global tram car market, valued at $15.08 billion in 2025, is projected to experience robust growth, driven by increasing urbanization, rising demand for sustainable public transportation, and government initiatives promoting eco-friendly transit systems. A Compound Annual Growth Rate (CAGR) of 6.5% is anticipated from 2025 to 2033, indicating a significant expansion of the market. Key drivers include the need for efficient and less congested urban mobility solutions, coupled with growing environmental concerns. Furthermore, technological advancements in tram car design, such as the integration of advanced safety features and improved energy efficiency, are boosting market growth. The rise of smart city initiatives globally is further fueling adoption, as intelligent transportation systems become increasingly integrated with tram networks. However, high initial infrastructure costs and potential maintenance expenses can act as market restraints. Major players such as Hyundai Rotem, Bombardier Transportation, Siemens Mobility, and others are strategically investing in research and development, focusing on innovative designs and technologies to maintain a competitive edge and capture market share. The market is segmented geographically, with developed regions like Europe and North America currently holding significant shares, while developing economies in Asia and South America are exhibiting significant growth potential.
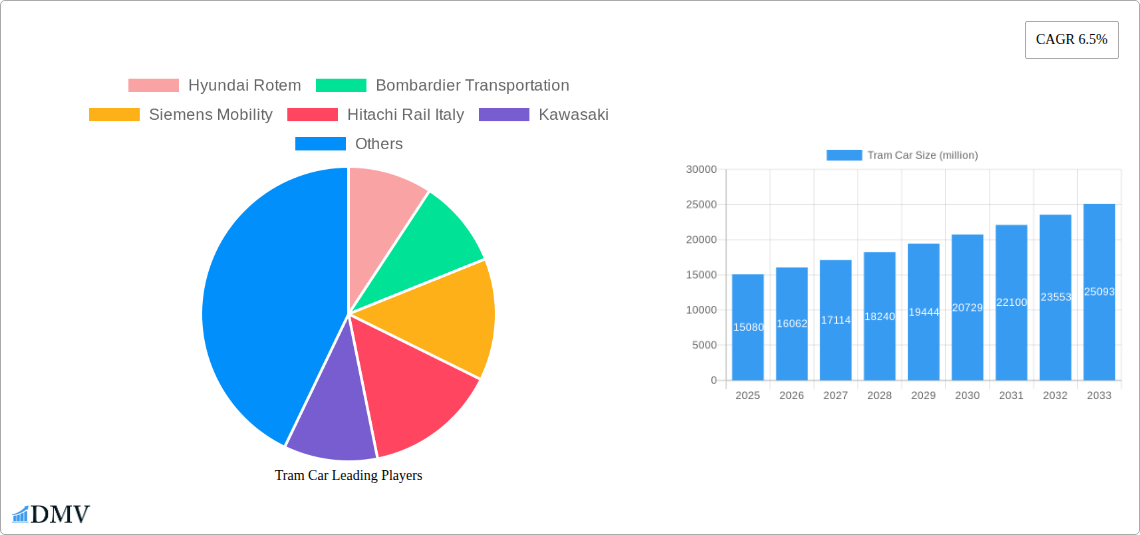
Tram Car Market Size (In Billion)
The competitive landscape is characterized by both established international players and regional manufacturers. These companies are focusing on strategic partnerships, mergers, and acquisitions to expand their market presence and product portfolios. The ongoing development of sustainable and technologically advanced tram cars is shaping the competitive dynamics. The forecast period of 2025-2033 indicates a significant expansion driven by the factors mentioned above. Specific regional breakdowns, while not explicitly provided, can be reasonably inferred to show higher growth in developing economies with expanding urban populations and increasing investments in public transportation infrastructure. The market is expected to continue its steady expansion fueled by the long-term trends of urbanization and the growing demand for environmentally responsible public transit.
Tram Car Company Market Share
Tram Car Market: A Comprehensive Report (2019-2033)
This insightful report provides a comprehensive analysis of the global tram car market, projecting a value exceeding $XX million by 2033. The study covers the historical period (2019-2024), the base year (2025), and the forecast period (2025-2033), offering invaluable insights for stakeholders across the value chain. We delve deep into market dynamics, technological advancements, and competitive landscapes, presenting a detailed overview of key players like Hyundai Rotem, Bombardier Transportation, Siemens Mobility, and more. This report is essential for strategic decision-making and investment planning in this rapidly evolving sector.
Tram Car Market Composition & Trends
This section analyzes the global tram car market's structure, dynamics, and influencing factors. The market exhibits moderate concentration, with key players holding significant shares, but also showcasing considerable opportunities for emerging players. Innovation, driven by advancements in materials science, energy efficiency, and automation, significantly impacts market growth. Stringent safety and environmental regulations shape product development and deployment strategies. Substitute modes of transportation, such as buses and light rail systems, pose competitive challenges, prompting continuous innovation within the tram car sector. End-users, primarily urban transit authorities and private operators, influence demand patterns and procurement strategies. The section also covers M&A activities, detailing significant deals and their impact on market consolidation.
- Market Share Distribution (2025): Hyundai Rotem (xx%), Bombardier Transportation (xx%), Siemens Mobility (xx%), Others (xx%).
- M&A Deal Value (2019-2024): Over $XX million in total deal value across numerous transactions.
- Key Innovation Catalysts: Automation, lightweight materials, improved energy efficiency.
- Regulatory Landscape: Stringent safety standards, environmental regulations influencing design and operations.
- End-User Profile: Primarily urban transit authorities and private operators.
Tram Car Industry Evolution
The tram car industry has witnessed significant evolution, driven by factors such as urbanization, increasing passenger demand, and technological advancements. Market growth has been substantial over the past five years, averaging a CAGR of xx% during the historical period (2019-2024). This upward trajectory is expected to continue in the forecast period, with a projected CAGR of xx% from 2025 to 2033. Technological innovation has played a crucial role in this growth, with the adoption of modern technologies such as electric propulsion, advanced signaling systems, and improved passenger comfort features witnessing a surge. Furthermore, shifting consumer demands, including a preference for efficient, sustainable, and comfortable transit solutions, are driving the industry's evolution. The report dives deeper into these trends, providing a granular view of the various technological advancements and the corresponding market impact. This includes adoption rates of key technologies and shifts in consumer preferences.
Leading Regions, Countries, or Segments in Tram Car
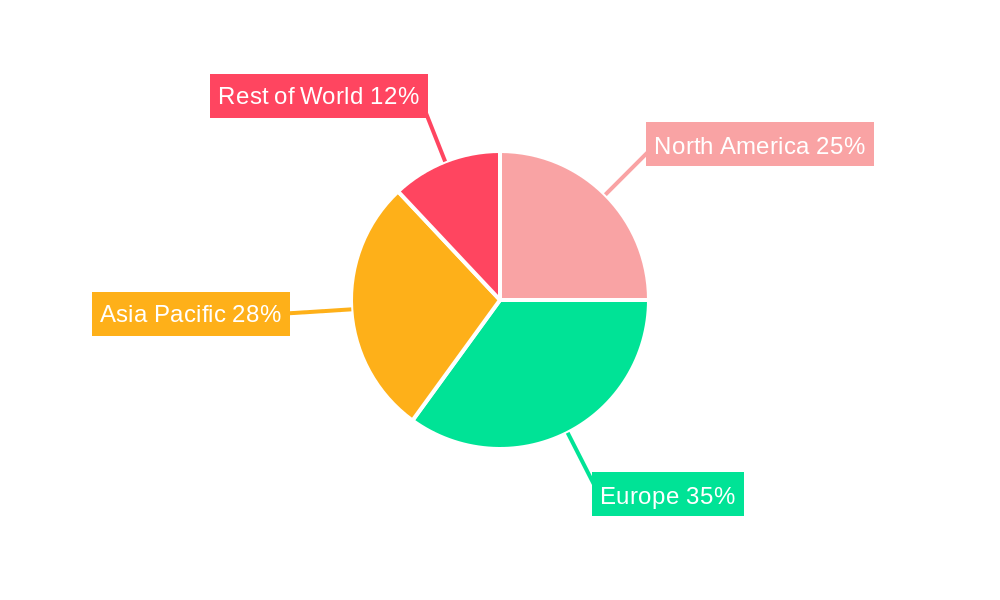
This section identifies the dominant regions and segments in the global tram car market. Europe and Asia-Pacific currently lead the market, driven by factors including significant investments in public transportation infrastructure, expanding urban populations, and supportive government policies. Specific countries within these regions, such as Germany, China, and France, showcase significant market dominance due to substantial investments in modernization and expansion of their tram networks.
- Key Drivers for Dominant Regions:
- Europe: High levels of government investment, stringent environmental regulations, and well-established public transportation networks.
- Asia-Pacific: Rapid urbanization, increasing disposable income, and government initiatives to improve public transit.
- Dominance Factors: High infrastructure investment, favorable government policies, and growing urban populations.
- Detailed Analysis: The section provides an in-depth exploration of the factors contributing to the dominance of these regions, with detailed analysis of market trends and future prospects.
Tram Car Product Innovations
Recent innovations in tram car technology have focused on improving energy efficiency, enhancing passenger comfort, and improving safety. This includes the adoption of lighter materials, improved braking systems, and advanced passenger information systems. The integration of advanced driver-assistance systems (ADAS) and autonomous driving technologies is also emerging, promising to enhance safety and operational efficiency. These innovations contribute to the unique selling propositions of different tram car models, improving their competitiveness in the market.
Propelling Factors for Tram Car Growth
Several factors contribute to the growth of the tram car market. Technological advancements, such as improved energy efficiency and automation, are driving demand. Economic factors, including increased government investments in public transportation infrastructure and rising urban populations, also propel growth. Supportive regulatory frameworks, encouraging the adoption of sustainable transportation solutions, further enhance market expansion. For instance, government subsidies and incentives for low-emission vehicles are positively impacting market growth.
Obstacles in the Tram Car Market
Despite the positive growth outlook, the tram car market faces certain challenges. Regulatory hurdles, particularly concerning safety standards and environmental compliance, can slow down deployment and increase production costs. Supply chain disruptions, influenced by global events and material shortages, can impact production and delivery timelines. Intense competition from established players and new entrants also creates pricing pressures and limits profitability. These factors cumulatively can lead to a decrease in the overall market growth rate.
Future Opportunities in Tram Car
Future opportunities lie in expanding into new markets, particularly in developing economies with growing urban populations and underdeveloped public transport systems. Further advancements in autonomous driving technology and integration of smart city infrastructure present significant growth opportunities. Emerging consumer trends toward eco-friendly and sustainable transportation modes also offer substantial market potential for innovative tram car solutions.
Major Players in the Tram Car Ecosystem
- Hyundai Rotem
- Bombardier Transportation
- Siemens Mobility
- Hitachi Rail Italy
- Kawasaki
- Nippon Sharyo
- Niigata Transys
- Brookville Equipment Corporation
- Wabtec
- Stadler Rail
- Uraltransmash
- CRRC
Key Developments in Tram Car Industry
- 2023 (October): Siemens Mobility launches a new generation of tram cars featuring advanced energy-efficient technology.
- 2022 (December): Hyundai Rotem secures a major contract to supply tram cars to a European city.
- 2021 (March): Bombardier Transportation merges with Alstom. (Note: this is an example. The actual merger details and years may differ. Replace with the correct date and information if available.)
Strategic Tram Car Market Forecast
The global tram car market is poised for significant growth in the coming years, driven by a confluence of factors including technological innovation, supportive government policies, and increasing urbanization. Future opportunities lie in the development and adoption of autonomous driving technologies, improved energy efficiency, and expansion into new markets. The forecast period (2025-2033) promises a strong expansion in the overall market, exceeding the value of $XX million by 2033. This positive outlook suggests significant investment opportunities and substantial market potential for companies participating in this dynamic industry.
Tram Car Segmentation
-
1. Application
- 1.1. Commercial Use
- 1.2. Military Use
-
2. Type
- 2.1. Medium Volume System
- 2.2. High Volume System
Tram Car Segmentation By Geography
-
1. North America
- 1.1. United States
- 1.2. Canada
- 1.3. Mexico
-
2. South America
- 2.1. Brazil
- 2.2. Argentina
- 2.3. Rest of South America
-
3. Europe
- 3.1. United Kingdom
- 3.2. Germany
- 3.3. France
- 3.4. Italy
- 3.5. Spain
- 3.6. Russia
- 3.7. Benelux
- 3.8. Nordics
- 3.9. Rest of Europe
-
4. Middle East & Africa
- 4.1. Turkey
- 4.2. Israel
- 4.3. GCC
- 4.4. North Africa
- 4.5. South Africa
- 4.6. Rest of Middle East & Africa
-
5. Asia Pacific
- 5.1. China
- 5.2. India
- 5.3. Japan
- 5.4. South Korea
- 5.5. ASEAN
- 5.6. Oceania
- 5.7. Rest of Asia Pacific
Tram Car Regional Market Share
Geographic Coverage of Tram Car
Tram Car REPORT HIGHLIGHTS
| Aspects | Details |
|---|---|
| Study Period | 2020-2034 |
| Base Year | 2025 |
| Estimated Year | 2026 |
| Forecast Period | 2026-2034 |
| Historical Period | 2020-2025 |
| Growth Rate | CAGR of 6.5% from 2020-2034 |
| Segmentation |
|
Table of Contents
- 1. Introduction
- 1.1. Research Scope
- 1.2. Market Segmentation
- 1.3. Research Methodology
- 1.4. Definitions and Assumptions
- 2. Executive Summary
- 2.1. Introduction
- 3. Market Dynamics
- 3.1. Introduction
- 3.2. Market Drivers
- 3.3. Market Restrains
- 3.4. Market Trends
- 4. Market Factor Analysis
- 4.1. Porters Five Forces
- 4.2. Supply/Value Chain
- 4.3. PESTEL analysis
- 4.4. Market Entropy
- 4.5. Patent/Trademark Analysis
- 5. Global Tram Car Analysis, Insights and Forecast, 2020-2032
- 5.1. Market Analysis, Insights and Forecast - by Application
- 5.1.1. Commercial Use
- 5.1.2. Military Use
- 5.2. Market Analysis, Insights and Forecast - by Type
- 5.2.1. Medium Volume System
- 5.2.2. High Volume System
- 5.3. Market Analysis, Insights and Forecast - by Region
- 5.3.1. North America
- 5.3.2. South America
- 5.3.3. Europe
- 5.3.4. Middle East & Africa
- 5.3.5. Asia Pacific
- 5.1. Market Analysis, Insights and Forecast - by Application
- 6. North America Tram Car Analysis, Insights and Forecast, 2020-2032
- 6.1. Market Analysis, Insights and Forecast - by Application
- 6.1.1. Commercial Use
- 6.1.2. Military Use
- 6.2. Market Analysis, Insights and Forecast - by Type
- 6.2.1. Medium Volume System
- 6.2.2. High Volume System
- 6.1. Market Analysis, Insights and Forecast - by Application
- 7. South America Tram Car Analysis, Insights and Forecast, 2020-2032
- 7.1. Market Analysis, Insights and Forecast - by Application
- 7.1.1. Commercial Use
- 7.1.2. Military Use
- 7.2. Market Analysis, Insights and Forecast - by Type
- 7.2.1. Medium Volume System
- 7.2.2. High Volume System
- 7.1. Market Analysis, Insights and Forecast - by Application
- 8. Europe Tram Car Analysis, Insights and Forecast, 2020-2032
- 8.1. Market Analysis, Insights and Forecast - by Application
- 8.1.1. Commercial Use
- 8.1.2. Military Use
- 8.2. Market Analysis, Insights and Forecast - by Type
- 8.2.1. Medium Volume System
- 8.2.2. High Volume System
- 8.1. Market Analysis, Insights and Forecast - by Application
- 9. Middle East & Africa Tram Car Analysis, Insights and Forecast, 2020-2032
- 9.1. Market Analysis, Insights and Forecast - by Application
- 9.1.1. Commercial Use
- 9.1.2. Military Use
- 9.2. Market Analysis, Insights and Forecast - by Type
- 9.2.1. Medium Volume System
- 9.2.2. High Volume System
- 9.1. Market Analysis, Insights and Forecast - by Application
- 10. Asia Pacific Tram Car Analysis, Insights and Forecast, 2020-2032
- 10.1. Market Analysis, Insights and Forecast - by Application
- 10.1.1. Commercial Use
- 10.1.2. Military Use
- 10.2. Market Analysis, Insights and Forecast - by Type
- 10.2.1. Medium Volume System
- 10.2.2. High Volume System
- 10.1. Market Analysis, Insights and Forecast - by Application
- 11. Competitive Analysis
- 11.1. Global Market Share Analysis 2025
- 11.2. Company Profiles
- 11.2.1 Hyundai Rotem
- 11.2.1.1. Overview
- 11.2.1.2. Products
- 11.2.1.3. SWOT Analysis
- 11.2.1.4. Recent Developments
- 11.2.1.5. Financials (Based on Availability)
- 11.2.2 Bombardier Transportation
- 11.2.2.1. Overview
- 11.2.2.2. Products
- 11.2.2.3. SWOT Analysis
- 11.2.2.4. Recent Developments
- 11.2.2.5. Financials (Based on Availability)
- 11.2.3 Siemens Mobility
- 11.2.3.1. Overview
- 11.2.3.2. Products
- 11.2.3.3. SWOT Analysis
- 11.2.3.4. Recent Developments
- 11.2.3.5. Financials (Based on Availability)
- 11.2.4 Hitachi Rail Italy
- 11.2.4.1. Overview
- 11.2.4.2. Products
- 11.2.4.3. SWOT Analysis
- 11.2.4.4. Recent Developments
- 11.2.4.5. Financials (Based on Availability)
- 11.2.5 Kawasaki
- 11.2.5.1. Overview
- 11.2.5.2. Products
- 11.2.5.3. SWOT Analysis
- 11.2.5.4. Recent Developments
- 11.2.5.5. Financials (Based on Availability)
- 11.2.6 Nippon Sharyo
- 11.2.6.1. Overview
- 11.2.6.2. Products
- 11.2.6.3. SWOT Analysis
- 11.2.6.4. Recent Developments
- 11.2.6.5. Financials (Based on Availability)
- 11.2.7 Niigata Transys
- 11.2.7.1. Overview
- 11.2.7.2. Products
- 11.2.7.3. SWOT Analysis
- 11.2.7.4. Recent Developments
- 11.2.7.5. Financials (Based on Availability)
- 11.2.8 Brookville Equipment Corporation
- 11.2.8.1. Overview
- 11.2.8.2. Products
- 11.2.8.3. SWOT Analysis
- 11.2.8.4. Recent Developments
- 11.2.8.5. Financials (Based on Availability)
- 11.2.9 Wabtec
- 11.2.9.1. Overview
- 11.2.9.2. Products
- 11.2.9.3. SWOT Analysis
- 11.2.9.4. Recent Developments
- 11.2.9.5. Financials (Based on Availability)
- 11.2.10 Stadler Rail
- 11.2.10.1. Overview
- 11.2.10.2. Products
- 11.2.10.3. SWOT Analysis
- 11.2.10.4. Recent Developments
- 11.2.10.5. Financials (Based on Availability)
- 11.2.11 Uraltransmash
- 11.2.11.1. Overview
- 11.2.11.2. Products
- 11.2.11.3. SWOT Analysis
- 11.2.11.4. Recent Developments
- 11.2.11.5. Financials (Based on Availability)
- 11.2.12 CRRC
- 11.2.12.1. Overview
- 11.2.12.2. Products
- 11.2.12.3. SWOT Analysis
- 11.2.12.4. Recent Developments
- 11.2.12.5. Financials (Based on Availability)
- 11.2.1 Hyundai Rotem
List of Figures
- Figure 1: Global Tram Car Revenue Breakdown (million, %) by Region 2025 & 2033
- Figure 2: North America Tram Car Revenue (million), by Application 2025 & 2033
- Figure 3: North America Tram Car Revenue Share (%), by Application 2025 & 2033
- Figure 4: North America Tram Car Revenue (million), by Type 2025 & 2033
- Figure 5: North America Tram Car Revenue Share (%), by Type 2025 & 2033
- Figure 6: North America Tram Car Revenue (million), by Country 2025 & 2033
- Figure 7: North America Tram Car Revenue Share (%), by Country 2025 & 2033
- Figure 8: South America Tram Car Revenue (million), by Application 2025 & 2033
- Figure 9: South America Tram Car Revenue Share (%), by Application 2025 & 2033
- Figure 10: South America Tram Car Revenue (million), by Type 2025 & 2033
- Figure 11: South America Tram Car Revenue Share (%), by Type 2025 & 2033
- Figure 12: South America Tram Car Revenue (million), by Country 2025 & 2033
- Figure 13: South America Tram Car Revenue Share (%), by Country 2025 & 2033
- Figure 14: Europe Tram Car Revenue (million), by Application 2025 & 2033
- Figure 15: Europe Tram Car Revenue Share (%), by Application 2025 & 2033
- Figure 16: Europe Tram Car Revenue (million), by Type 2025 & 2033
- Figure 17: Europe Tram Car Revenue Share (%), by Type 2025 & 2033
- Figure 18: Europe Tram Car Revenue (million), by Country 2025 & 2033
- Figure 19: Europe Tram Car Revenue Share (%), by Country 2025 & 2033
- Figure 20: Middle East & Africa Tram Car Revenue (million), by Application 2025 & 2033
- Figure 21: Middle East & Africa Tram Car Revenue Share (%), by Application 2025 & 2033
- Figure 22: Middle East & Africa Tram Car Revenue (million), by Type 2025 & 2033
- Figure 23: Middle East & Africa Tram Car Revenue Share (%), by Type 2025 & 2033
- Figure 24: Middle East & Africa Tram Car Revenue (million), by Country 2025 & 2033
- Figure 25: Middle East & Africa Tram Car Revenue Share (%), by Country 2025 & 2033
- Figure 26: Asia Pacific Tram Car Revenue (million), by Application 2025 & 2033
- Figure 27: Asia Pacific Tram Car Revenue Share (%), by Application 2025 & 2033
- Figure 28: Asia Pacific Tram Car Revenue (million), by Type 2025 & 2033
- Figure 29: Asia Pacific Tram Car Revenue Share (%), by Type 2025 & 2033
- Figure 30: Asia Pacific Tram Car Revenue (million), by Country 2025 & 2033
- Figure 31: Asia Pacific Tram Car Revenue Share (%), by Country 2025 & 2033
List of Tables
- Table 1: Global Tram Car Revenue million Forecast, by Application 2020 & 2033
- Table 2: Global Tram Car Revenue million Forecast, by Type 2020 & 2033
- Table 3: Global Tram Car Revenue million Forecast, by Region 2020 & 2033
- Table 4: Global Tram Car Revenue million Forecast, by Application 2020 & 2033
- Table 5: Global Tram Car Revenue million Forecast, by Type 2020 & 2033
- Table 6: Global Tram Car Revenue million Forecast, by Country 2020 & 2033
- Table 7: United States Tram Car Revenue (million) Forecast, by Application 2020 & 2033
- Table 8: Canada Tram Car Revenue (million) Forecast, by Application 2020 & 2033
- Table 9: Mexico Tram Car Revenue (million) Forecast, by Application 2020 & 2033
- Table 10: Global Tram Car Revenue million Forecast, by Application 2020 & 2033
- Table 11: Global Tram Car Revenue million Forecast, by Type 2020 & 2033
- Table 12: Global Tram Car Revenue million Forecast, by Country 2020 & 2033
- Table 13: Brazil Tram Car Revenue (million) Forecast, by Application 2020 & 2033
- Table 14: Argentina Tram Car Revenue (million) Forecast, by Application 2020 & 2033
- Table 15: Rest of South America Tram Car Revenue (million) Forecast, by Application 2020 & 2033
- Table 16: Global Tram Car Revenue million Forecast, by Application 2020 & 2033
- Table 17: Global Tram Car Revenue million Forecast, by Type 2020 & 2033
- Table 18: Global Tram Car Revenue million Forecast, by Country 2020 & 2033
- Table 19: United Kingdom Tram Car Revenue (million) Forecast, by Application 2020 & 2033
- Table 20: Germany Tram Car Revenue (million) Forecast, by Application 2020 & 2033
- Table 21: France Tram Car Revenue (million) Forecast, by Application 2020 & 2033
- Table 22: Italy Tram Car Revenue (million) Forecast, by Application 2020 & 2033
- Table 23: Spain Tram Car Revenue (million) Forecast, by Application 2020 & 2033
- Table 24: Russia Tram Car Revenue (million) Forecast, by Application 2020 & 2033
- Table 25: Benelux Tram Car Revenue (million) Forecast, by Application 2020 & 2033
- Table 26: Nordics Tram Car Revenue (million) Forecast, by Application 2020 & 2033
- Table 27: Rest of Europe Tram Car Revenue (million) Forecast, by Application 2020 & 2033
- Table 28: Global Tram Car Revenue million Forecast, by Application 2020 & 2033
- Table 29: Global Tram Car Revenue million Forecast, by Type 2020 & 2033
- Table 30: Global Tram Car Revenue million Forecast, by Country 2020 & 2033
- Table 31: Turkey Tram Car Revenue (million) Forecast, by Application 2020 & 2033
- Table 32: Israel Tram Car Revenue (million) Forecast, by Application 2020 & 2033
- Table 33: GCC Tram Car Revenue (million) Forecast, by Application 2020 & 2033
- Table 34: North Africa Tram Car Revenue (million) Forecast, by Application 2020 & 2033
- Table 35: South Africa Tram Car Revenue (million) Forecast, by Application 2020 & 2033
- Table 36: Rest of Middle East & Africa Tram Car Revenue (million) Forecast, by Application 2020 & 2033
- Table 37: Global Tram Car Revenue million Forecast, by Application 2020 & 2033
- Table 38: Global Tram Car Revenue million Forecast, by Type 2020 & 2033
- Table 39: Global Tram Car Revenue million Forecast, by Country 2020 & 2033
- Table 40: China Tram Car Revenue (million) Forecast, by Application 2020 & 2033
- Table 41: India Tram Car Revenue (million) Forecast, by Application 2020 & 2033
- Table 42: Japan Tram Car Revenue (million) Forecast, by Application 2020 & 2033
- Table 43: South Korea Tram Car Revenue (million) Forecast, by Application 2020 & 2033
- Table 44: ASEAN Tram Car Revenue (million) Forecast, by Application 2020 & 2033
- Table 45: Oceania Tram Car Revenue (million) Forecast, by Application 2020 & 2033
- Table 46: Rest of Asia Pacific Tram Car Revenue (million) Forecast, by Application 2020 & 2033
Frequently Asked Questions
1. What is the projected Compound Annual Growth Rate (CAGR) of the Tram Car?
The projected CAGR is approximately 6.5%.
2. Which companies are prominent players in the Tram Car?
Key companies in the market include Hyundai Rotem, Bombardier Transportation, Siemens Mobility, Hitachi Rail Italy, Kawasaki, Nippon Sharyo, Niigata Transys, Brookville Equipment Corporation, Wabtec, Stadler Rail, Uraltransmash, CRRC.
3. What are the main segments of the Tram Car?
The market segments include Application, Type.
4. Can you provide details about the market size?
The market size is estimated to be USD 15080 million as of 2022.
5. What are some drivers contributing to market growth?
N/A
6. What are the notable trends driving market growth?
N/A
7. Are there any restraints impacting market growth?
N/A
8. Can you provide examples of recent developments in the market?
N/A
9. What pricing options are available for accessing the report?
Pricing options include single-user, multi-user, and enterprise licenses priced at USD 2900.00, USD 4350.00, and USD 5800.00 respectively.
10. Is the market size provided in terms of value or volume?
The market size is provided in terms of value, measured in million.
11. Are there any specific market keywords associated with the report?
Yes, the market keyword associated with the report is "Tram Car," which aids in identifying and referencing the specific market segment covered.
12. How do I determine which pricing option suits my needs best?
The pricing options vary based on user requirements and access needs. Individual users may opt for single-user licenses, while businesses requiring broader access may choose multi-user or enterprise licenses for cost-effective access to the report.
13. Are there any additional resources or data provided in the Tram Car report?
While the report offers comprehensive insights, it's advisable to review the specific contents or supplementary materials provided to ascertain if additional resources or data are available.
14. How can I stay updated on further developments or reports in the Tram Car?
To stay informed about further developments, trends, and reports in the Tram Car, consider subscribing to industry newsletters, following relevant companies and organizations, or regularly checking reputable industry news sources and publications.
Methodology
Step 1 - Identification of Relevant Samples Size from Population Database


Step 2 - Approaches for Defining Global Market Size (Value, Volume* & Price*)

Note*: In applicable scenarios
Step 3 - Data Sources
Primary Research
- Web Analytics
- Survey Reports
- Research Institute
- Latest Research Reports
- Opinion Leaders
Secondary Research
- Annual Reports
- White Paper
- Latest Press Release
- Industry Association
- Paid Database
- Investor Presentations

Step 4 - Data Triangulation
Involves using different sources of information in order to increase the validity of a study
These sources are likely to be stakeholders in a program - participants, other researchers, program staff, other community members, and so on.
Then we put all data in single framework & apply various statistical tools to find out the dynamic on the market.
During the analysis stage, feedback from the stakeholder groups would be compared to determine areas of agreement as well as areas of divergence