

Key Insights
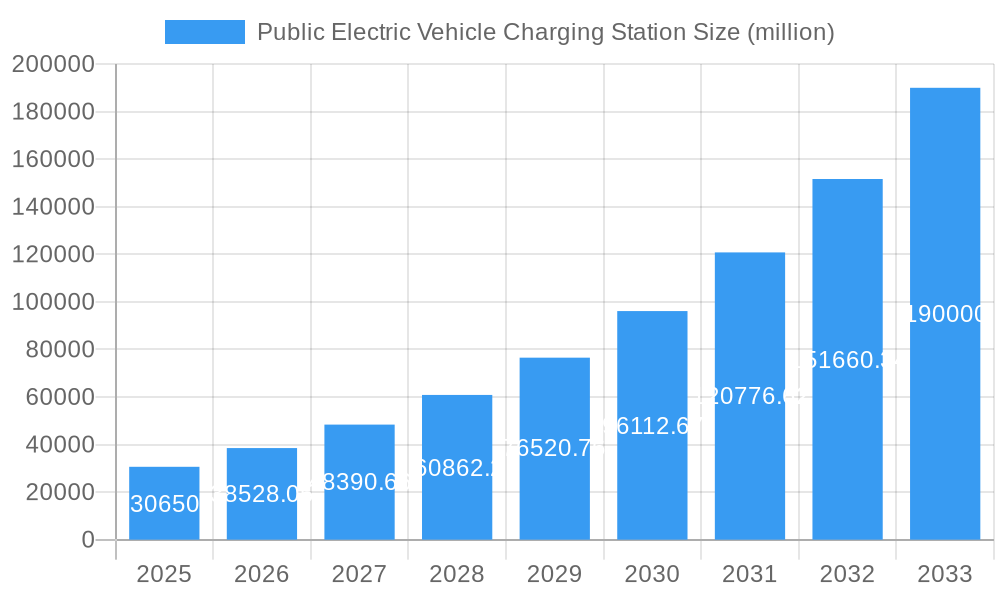
The global public electric vehicle (EV) charging station market is experiencing rapid growth, projected to reach $30.65 billion in 2025 and exhibiting a robust Compound Annual Growth Rate (CAGR) of 25.7% from 2025 to 2033. This expansion is fueled by several key drivers. Governments worldwide are actively promoting EV adoption through supportive policies like tax incentives and subsidies, alongside substantial investments in charging infrastructure. The increasing affordability and range of electric vehicles are also significant factors, making them a more attractive option for consumers. Furthermore, technological advancements leading to faster charging speeds and improved charging station reliability are enhancing user experience and driving market growth. The market is witnessing a shift towards smart charging technologies, enabling better grid management and optimizing energy consumption. However, challenges such as uneven geographical distribution of charging stations, particularly in rural areas, and high upfront capital costs for installing charging infrastructure remain constraints.
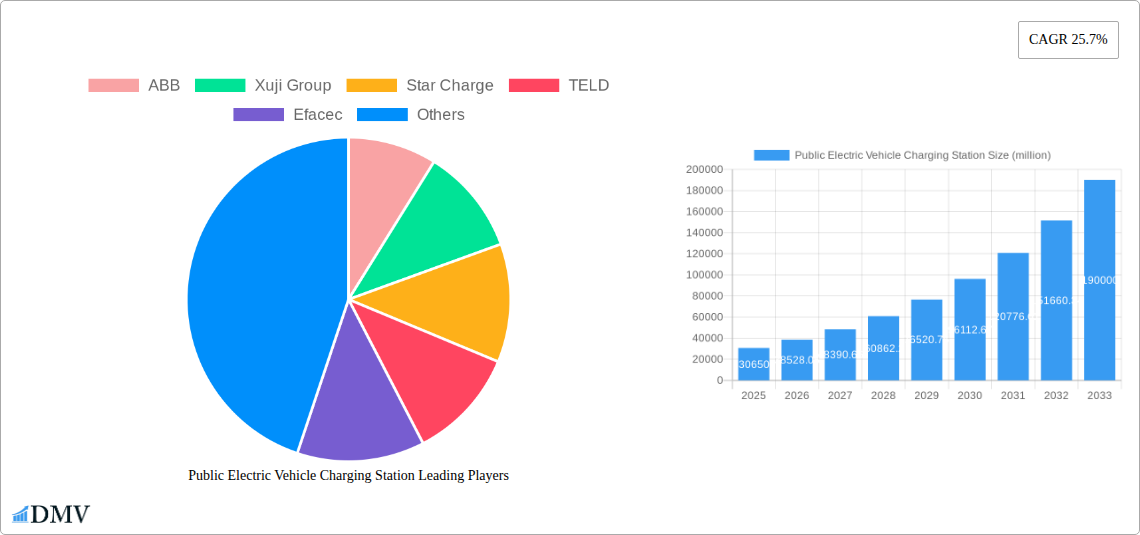
Public Electric Vehicle Charging Station Market Size (In Billion)
Major players in the market, including ABB, Xuji Group, Star Charge, TELD, Efacec, Chargepoint, IES Synergy, DBT-CEV, Auto Electric Power Plant, EV Box, Aplitronic (Hypercharger), CirControl, and Pod Point, are actively competing to capture market share through technological innovation, strategic partnerships, and expansion into new geographical markets. The market is segmented geographically, with regions like North America and Europe currently dominating due to established EV adoption rates and supportive government policies. However, emerging economies in Asia and other regions are poised for significant growth as EV adoption accelerates. The forecast period of 2025-2033 indicates continued strong growth driven by an expanding EV fleet, improved charging technology, and a greater focus on sustainable transportation solutions. This robust growth trajectory is expected to attract further investments and innovation in the public EV charging station sector.
Public Electric Vehicle Charging Station Company Market Share
Public Electric Vehicle Charging Station Market Report: 2019-2033
This comprehensive report provides an in-depth analysis of the global Public Electric Vehicle Charging Station market, projecting a market value exceeding $XX million by 2033. The study period spans from 2019 to 2033, with 2025 serving as both the base and estimated year. This report is essential for stakeholders seeking to understand market dynamics, identify key players, and capitalize on future growth opportunities within this rapidly expanding sector.
Public Electric Vehicle Charging Station Market Composition & Trends
This section dissects the market's competitive landscape, technological advancements, and regulatory influences. We examine market concentration, revealing the market share distribution among key players like ABB, ChargePoint, and Xuji Group. The report analyzes innovation drivers, such as the development of hyperchargers by companies like Aplitronic, and the impact of evolving regulatory landscapes on market growth. Furthermore, we explore the role of substitute products and the profiles of end-users, including individual consumers, businesses, and government entities. The analysis also encompasses mergers and acquisitions (M&A) activities, including the valuation of significant deals within the industry, exceeding $XX million in the historical period (2019-2024).
- Market Share Distribution: ABB holds approximately XX%, ChargePoint holds approximately XX%, Xuji Group holds approximately XX%, and other players comprise the remaining XX%.
- M&A Deal Values: Total M&A deal values exceeding $XX million were recorded between 2019 and 2024.
- Key Innovation Catalysts: Development of faster charging technologies (e.g., hyperchargers), improved battery technology, and smart charging solutions.
- Regulatory Landscape: Government incentives, emission reduction targets, and grid infrastructure development significantly influence market growth.
Public Electric Vehicle Charging Station Industry Evolution
This section examines the market's evolutionary trajectory from 2019 to 2033. We analyze the growth trajectories, charting a Compound Annual Growth Rate (CAGR) of XX% from 2025 to 2033, driven by factors such as rising EV adoption rates, government initiatives, and expanding charging infrastructure. Technological advancements, like the integration of AI and IoT in charging solutions, are explored in detail, alongside shifting consumer preferences towards convenient and fast-charging options. The report also quantifies the adoption rate of public charging stations, projecting an increase of XX million units by 2033.
Leading Regions, Countries, or Segments in Public Electric Vehicle Charging Station
This section pinpoints the leading regions and countries driving the market's growth, identifying specific factors contributing to their dominance. Detailed analysis is provided for each key area to highlight the unique market characteristics.
- Dominant Region/Country: [Specify dominant region/country, e.g., North America/China]
- Key Drivers:
- High EV adoption rates
- Stringent emission regulations
- Government subsidies and incentives
- Extensive investment in charging infrastructure
- Developed grid infrastructure
Public Electric Vehicle Charging Station Product Innovations
Recent innovations have centered around faster charging speeds (e.g., Aplitronic's hyperchargers), increased charging capacity, improved reliability and smart grid integration. These advancements enhance user experience and optimize energy efficiency, differentiating offerings from various providers. Performance metrics such as charging time, power output, and network connectivity are included in the analysis.
Propelling Factors for Public Electric Vehicle Charging Station Growth
Several factors drive market expansion, including increasing electric vehicle sales, supportive government policies promoting EV adoption and charging infrastructure development (e.g., tax credits, subsidies), and advancements in battery technology enabling faster charging capabilities. Economic factors, such as decreasing battery costs, also contribute to increased demand for public charging stations.
Obstacles in the Public Electric Vehicle Charging Station Market
Challenges include the high initial investment costs for infrastructure development, the need for robust grid infrastructure to support increased electricity demand, potential supply chain disruptions affecting component availability, and interoperability issues among different charging networks. Furthermore, intense competition among numerous charging station providers can put downward pressure on pricing.
Future Opportunities in Public Electric Vehicle Charging Station
Emerging opportunities include expanding into underserved markets, developing innovative charging technologies like wireless charging and battery swapping, integrating smart charging solutions with renewable energy sources, and creating integrated mobility solutions combining charging with other services. The market is also expected to benefit from the growth of autonomous vehicles and ride-sharing services.
Major Players in the Public Electric Vehicle Charging Station Ecosystem
- ABB
- Xuji Group
- Star Charge
- TELD
- Efacec
- Chargepoint
- IES Synergy
- DBT-CEV
- Auto Electric Power Plant
- EV Box
- Aplitronic (Hypercharger)
- CirControl
- Pod Point
Key Developments in Public Electric Vehicle Charging Station Industry
- [Insert key developments with year/month and brief description of their impact] For example: "January 2023: ABB launched a new fast-charging station, increasing market competition and improving charging speeds." Repeat as needed with multiple entries.
Strategic Public Electric Vehicle Charging Station Market Forecast
The public electric vehicle charging station market is poised for significant growth, fueled by increasing EV adoption, government support, and technological advancements. The forecast indicates a strong upward trajectory, with substantial market expansion predicted throughout the forecast period (2025-2033). Continued investment in infrastructure and innovation will be critical to achieving this potential.
Public Electric Vehicle Charging Station Segmentation
-
1. Application
- 1.1. Public Place
- 1.2. Commercial Place
-
2. Type
- 2.1. AC Charger
- 2.2. DC Charger
Public Electric Vehicle Charging Station Segmentation By Geography
-
1. North America
- 1.1. United States
- 1.2. Canada
- 1.3. Mexico
-
2. South America
- 2.1. Brazil
- 2.2. Argentina
- 2.3. Rest of South America
-
3. Europe
- 3.1. United Kingdom
- 3.2. Germany
- 3.3. France
- 3.4. Italy
- 3.5. Spain
- 3.6. Russia
- 3.7. Benelux
- 3.8. Nordics
- 3.9. Rest of Europe
-
4. Middle East & Africa
- 4.1. Turkey
- 4.2. Israel
- 4.3. GCC
- 4.4. North Africa
- 4.5. South Africa
- 4.6. Rest of Middle East & Africa
-
5. Asia Pacific
- 5.1. China
- 5.2. India
- 5.3. Japan
- 5.4. South Korea
- 5.5. ASEAN
- 5.6. Oceania
- 5.7. Rest of Asia Pacific

Public Electric Vehicle Charging Station Regional Market Share
Geographic Coverage of Public Electric Vehicle Charging Station
Public Electric Vehicle Charging Station REPORT HIGHLIGHTS
| Aspects | Details |
|---|---|
| Study Period | 2020-2034 |
| Base Year | 2025 |
| Estimated Year | 2026 |
| Forecast Period | 2026-2034 |
| Historical Period | 2020-2025 |
| Growth Rate | CAGR of 25.7% from 2020-2034 |
| Segmentation |
|
Table of Contents
- 1. Introduction
- 1.1. Research Scope
- 1.2. Market Segmentation
- 1.3. Research Methodology
- 1.4. Definitions and Assumptions
- 2. Executive Summary
- 2.1. Introduction
- 3. Market Dynamics
- 3.1. Introduction
- 3.2. Market Drivers
- 3.3. Market Restrains
- 3.4. Market Trends
- 4. Market Factor Analysis
- 4.1. Porters Five Forces
- 4.2. Supply/Value Chain
- 4.3. PESTEL analysis
- 4.4. Market Entropy
- 4.5. Patent/Trademark Analysis
- 5. Global Public Electric Vehicle Charging Station Analysis, Insights and Forecast, 2020-2032
- 5.1. Market Analysis, Insights and Forecast - by Application
- 5.1.1. Public Place
- 5.1.2. Commercial Place
- 5.2. Market Analysis, Insights and Forecast - by Type
- 5.2.1. AC Charger
- 5.2.2. DC Charger
- 5.3. Market Analysis, Insights and Forecast - by Region
- 5.3.1. North America
- 5.3.2. South America
- 5.3.3. Europe
- 5.3.4. Middle East & Africa
- 5.3.5. Asia Pacific
- 5.1. Market Analysis, Insights and Forecast - by Application
- 6. North America Public Electric Vehicle Charging Station Analysis, Insights and Forecast, 2020-2032
- 6.1. Market Analysis, Insights and Forecast - by Application
- 6.1.1. Public Place
- 6.1.2. Commercial Place
- 6.2. Market Analysis, Insights and Forecast - by Type
- 6.2.1. AC Charger
- 6.2.2. DC Charger
- 6.1. Market Analysis, Insights and Forecast - by Application
- 7. South America Public Electric Vehicle Charging Station Analysis, Insights and Forecast, 2020-2032
- 7.1. Market Analysis, Insights and Forecast - by Application
- 7.1.1. Public Place
- 7.1.2. Commercial Place
- 7.2. Market Analysis, Insights and Forecast - by Type
- 7.2.1. AC Charger
- 7.2.2. DC Charger
- 7.1. Market Analysis, Insights and Forecast - by Application
- 8. Europe Public Electric Vehicle Charging Station Analysis, Insights and Forecast, 2020-2032
- 8.1. Market Analysis, Insights and Forecast - by Application
- 8.1.1. Public Place
- 8.1.2. Commercial Place
- 8.2. Market Analysis, Insights and Forecast - by Type
- 8.2.1. AC Charger
- 8.2.2. DC Charger
- 8.1. Market Analysis, Insights and Forecast - by Application
- 9. Middle East & Africa Public Electric Vehicle Charging Station Analysis, Insights and Forecast, 2020-2032
- 9.1. Market Analysis, Insights and Forecast - by Application
- 9.1.1. Public Place
- 9.1.2. Commercial Place
- 9.2. Market Analysis, Insights and Forecast - by Type
- 9.2.1. AC Charger
- 9.2.2. DC Charger
- 9.1. Market Analysis, Insights and Forecast - by Application
- 10. Asia Pacific Public Electric Vehicle Charging Station Analysis, Insights and Forecast, 2020-2032
- 10.1. Market Analysis, Insights and Forecast - by Application
- 10.1.1. Public Place
- 10.1.2. Commercial Place
- 10.2. Market Analysis, Insights and Forecast - by Type
- 10.2.1. AC Charger
- 10.2.2. DC Charger
- 10.1. Market Analysis, Insights and Forecast - by Application
- 11. Competitive Analysis
- 11.1. Global Market Share Analysis 2025
- 11.2. Company Profiles
- 11.2.1 ABB
- 11.2.1.1. Overview
- 11.2.1.2. Products
- 11.2.1.3. SWOT Analysis
- 11.2.1.4. Recent Developments
- 11.2.1.5. Financials (Based on Availability)
- 11.2.2 Xuji Group
- 11.2.2.1. Overview
- 11.2.2.2. Products
- 11.2.2.3. SWOT Analysis
- 11.2.2.4. Recent Developments
- 11.2.2.5. Financials (Based on Availability)
- 11.2.3 Star Charge
- 11.2.3.1. Overview
- 11.2.3.2. Products
- 11.2.3.3. SWOT Analysis
- 11.2.3.4. Recent Developments
- 11.2.3.5. Financials (Based on Availability)
- 11.2.4 TELD
- 11.2.4.1. Overview
- 11.2.4.2. Products
- 11.2.4.3. SWOT Analysis
- 11.2.4.4. Recent Developments
- 11.2.4.5. Financials (Based on Availability)
- 11.2.5 Efacec
- 11.2.5.1. Overview
- 11.2.5.2. Products
- 11.2.5.3. SWOT Analysis
- 11.2.5.4. Recent Developments
- 11.2.5.5. Financials (Based on Availability)
- 11.2.6 Chargepoint
- 11.2.6.1. Overview
- 11.2.6.2. Products
- 11.2.6.3. SWOT Analysis
- 11.2.6.4. Recent Developments
- 11.2.6.5. Financials (Based on Availability)
- 11.2.7 IES Synergy
- 11.2.7.1. Overview
- 11.2.7.2. Products
- 11.2.7.3. SWOT Analysis
- 11.2.7.4. Recent Developments
- 11.2.7.5. Financials (Based on Availability)
- 11.2.8 DBT-CEV
- 11.2.8.1. Overview
- 11.2.8.2. Products
- 11.2.8.3. SWOT Analysis
- 11.2.8.4. Recent Developments
- 11.2.8.5. Financials (Based on Availability)
- 11.2.9 Auto Electric Power Plant
- 11.2.9.1. Overview
- 11.2.9.2. Products
- 11.2.9.3. SWOT Analysis
- 11.2.9.4. Recent Developments
- 11.2.9.5. Financials (Based on Availability)
- 11.2.10 EV Box
- 11.2.10.1. Overview
- 11.2.10.2. Products
- 11.2.10.3. SWOT Analysis
- 11.2.10.4. Recent Developments
- 11.2.10.5. Financials (Based on Availability)
- 11.2.11 Aplitronic (Hypercharger)
- 11.2.11.1. Overview
- 11.2.11.2. Products
- 11.2.11.3. SWOT Analysis
- 11.2.11.4. Recent Developments
- 11.2.11.5. Financials (Based on Availability)
- 11.2.12 CirControl
- 11.2.12.1. Overview
- 11.2.12.2. Products
- 11.2.12.3. SWOT Analysis
- 11.2.12.4. Recent Developments
- 11.2.12.5. Financials (Based on Availability)
- 11.2.13 Pod Point
- 11.2.13.1. Overview
- 11.2.13.2. Products
- 11.2.13.3. SWOT Analysis
- 11.2.13.4. Recent Developments
- 11.2.13.5. Financials (Based on Availability)
- 11.2.1 ABB
List of Figures
- Figure 1: Global Public Electric Vehicle Charging Station Revenue Breakdown (million, %) by Region 2025 & 2033
- Figure 2: North America Public Electric Vehicle Charging Station Revenue (million), by Application 2025 & 2033
- Figure 3: North America Public Electric Vehicle Charging Station Revenue Share (%), by Application 2025 & 2033
- Figure 4: North America Public Electric Vehicle Charging Station Revenue (million), by Type 2025 & 2033
- Figure 5: North America Public Electric Vehicle Charging Station Revenue Share (%), by Type 2025 & 2033
- Figure 6: North America Public Electric Vehicle Charging Station Revenue (million), by Country 2025 & 2033
- Figure 7: North America Public Electric Vehicle Charging Station Revenue Share (%), by Country 2025 & 2033
- Figure 8: South America Public Electric Vehicle Charging Station Revenue (million), by Application 2025 & 2033
- Figure 9: South America Public Electric Vehicle Charging Station Revenue Share (%), by Application 2025 & 2033
- Figure 10: South America Public Electric Vehicle Charging Station Revenue (million), by Type 2025 & 2033
- Figure 11: South America Public Electric Vehicle Charging Station Revenue Share (%), by Type 2025 & 2033
- Figure 12: South America Public Electric Vehicle Charging Station Revenue (million), by Country 2025 & 2033
- Figure 13: South America Public Electric Vehicle Charging Station Revenue Share (%), by Country 2025 & 2033
- Figure 14: Europe Public Electric Vehicle Charging Station Revenue (million), by Application 2025 & 2033
- Figure 15: Europe Public Electric Vehicle Charging Station Revenue Share (%), by Application 2025 & 2033
- Figure 16: Europe Public Electric Vehicle Charging Station Revenue (million), by Type 2025 & 2033
- Figure 17: Europe Public Electric Vehicle Charging Station Revenue Share (%), by Type 2025 & 2033
- Figure 18: Europe Public Electric Vehicle Charging Station Revenue (million), by Country 2025 & 2033
- Figure 19: Europe Public Electric Vehicle Charging Station Revenue Share (%), by Country 2025 & 2033
- Figure 20: Middle East & Africa Public Electric Vehicle Charging Station Revenue (million), by Application 2025 & 2033
- Figure 21: Middle East & Africa Public Electric Vehicle Charging Station Revenue Share (%), by Application 2025 & 2033
- Figure 22: Middle East & Africa Public Electric Vehicle Charging Station Revenue (million), by Type 2025 & 2033
- Figure 23: Middle East & Africa Public Electric Vehicle Charging Station Revenue Share (%), by Type 2025 & 2033
- Figure 24: Middle East & Africa Public Electric Vehicle Charging Station Revenue (million), by Country 2025 & 2033
- Figure 25: Middle East & Africa Public Electric Vehicle Charging Station Revenue Share (%), by Country 2025 & 2033
- Figure 26: Asia Pacific Public Electric Vehicle Charging Station Revenue (million), by Application 2025 & 2033
- Figure 27: Asia Pacific Public Electric Vehicle Charging Station Revenue Share (%), by Application 2025 & 2033
- Figure 28: Asia Pacific Public Electric Vehicle Charging Station Revenue (million), by Type 2025 & 2033
- Figure 29: Asia Pacific Public Electric Vehicle Charging Station Revenue Share (%), by Type 2025 & 2033
- Figure 30: Asia Pacific Public Electric Vehicle Charging Station Revenue (million), by Country 2025 & 2033
- Figure 31: Asia Pacific Public Electric Vehicle Charging Station Revenue Share (%), by Country 2025 & 2033
List of Tables
- Table 1: Global Public Electric Vehicle Charging Station Revenue million Forecast, by Application 2020 & 2033
- Table 2: Global Public Electric Vehicle Charging Station Revenue million Forecast, by Type 2020 & 2033
- Table 3: Global Public Electric Vehicle Charging Station Revenue million Forecast, by Region 2020 & 2033
- Table 4: Global Public Electric Vehicle Charging Station Revenue million Forecast, by Application 2020 & 2033
- Table 5: Global Public Electric Vehicle Charging Station Revenue million Forecast, by Type 2020 & 2033
- Table 6: Global Public Electric Vehicle Charging Station Revenue million Forecast, by Country 2020 & 2033
- Table 7: United States Public Electric Vehicle Charging Station Revenue (million) Forecast, by Application 2020 & 2033
- Table 8: Canada Public Electric Vehicle Charging Station Revenue (million) Forecast, by Application 2020 & 2033
- Table 9: Mexico Public Electric Vehicle Charging Station Revenue (million) Forecast, by Application 2020 & 2033
- Table 10: Global Public Electric Vehicle Charging Station Revenue million Forecast, by Application 2020 & 2033
- Table 11: Global Public Electric Vehicle Charging Station Revenue million Forecast, by Type 2020 & 2033
- Table 12: Global Public Electric Vehicle Charging Station Revenue million Forecast, by Country 2020 & 2033
- Table 13: Brazil Public Electric Vehicle Charging Station Revenue (million) Forecast, by Application 2020 & 2033
- Table 14: Argentina Public Electric Vehicle Charging Station Revenue (million) Forecast, by Application 2020 & 2033
- Table 15: Rest of South America Public Electric Vehicle Charging Station Revenue (million) Forecast, by Application 2020 & 2033
- Table 16: Global Public Electric Vehicle Charging Station Revenue million Forecast, by Application 2020 & 2033
- Table 17: Global Public Electric Vehicle Charging Station Revenue million Forecast, by Type 2020 & 2033
- Table 18: Global Public Electric Vehicle Charging Station Revenue million Forecast, by Country 2020 & 2033
- Table 19: United Kingdom Public Electric Vehicle Charging Station Revenue (million) Forecast, by Application 2020 & 2033
- Table 20: Germany Public Electric Vehicle Charging Station Revenue (million) Forecast, by Application 2020 & 2033
- Table 21: France Public Electric Vehicle Charging Station Revenue (million) Forecast, by Application 2020 & 2033
- Table 22: Italy Public Electric Vehicle Charging Station Revenue (million) Forecast, by Application 2020 & 2033
- Table 23: Spain Public Electric Vehicle Charging Station Revenue (million) Forecast, by Application 2020 & 2033
- Table 24: Russia Public Electric Vehicle Charging Station Revenue (million) Forecast, by Application 2020 & 2033
- Table 25: Benelux Public Electric Vehicle Charging Station Revenue (million) Forecast, by Application 2020 & 2033
- Table 26: Nordics Public Electric Vehicle Charging Station Revenue (million) Forecast, by Application 2020 & 2033
- Table 27: Rest of Europe Public Electric Vehicle Charging Station Revenue (million) Forecast, by Application 2020 & 2033
- Table 28: Global Public Electric Vehicle Charging Station Revenue million Forecast, by Application 2020 & 2033
- Table 29: Global Public Electric Vehicle Charging Station Revenue million Forecast, by Type 2020 & 2033
- Table 30: Global Public Electric Vehicle Charging Station Revenue million Forecast, by Country 2020 & 2033
- Table 31: Turkey Public Electric Vehicle Charging Station Revenue (million) Forecast, by Application 2020 & 2033
- Table 32: Israel Public Electric Vehicle Charging Station Revenue (million) Forecast, by Application 2020 & 2033
- Table 33: GCC Public Electric Vehicle Charging Station Revenue (million) Forecast, by Application 2020 & 2033
- Table 34: North Africa Public Electric Vehicle Charging Station Revenue (million) Forecast, by Application 2020 & 2033
- Table 35: South Africa Public Electric Vehicle Charging Station Revenue (million) Forecast, by Application 2020 & 2033
- Table 36: Rest of Middle East & Africa Public Electric Vehicle Charging Station Revenue (million) Forecast, by Application 2020 & 2033
- Table 37: Global Public Electric Vehicle Charging Station Revenue million Forecast, by Application 2020 & 2033
- Table 38: Global Public Electric Vehicle Charging Station Revenue million Forecast, by Type 2020 & 2033
- Table 39: Global Public Electric Vehicle Charging Station Revenue million Forecast, by Country 2020 & 2033
- Table 40: China Public Electric Vehicle Charging Station Revenue (million) Forecast, by Application 2020 & 2033
- Table 41: India Public Electric Vehicle Charging Station Revenue (million) Forecast, by Application 2020 & 2033
- Table 42: Japan Public Electric Vehicle Charging Station Revenue (million) Forecast, by Application 2020 & 2033
- Table 43: South Korea Public Electric Vehicle Charging Station Revenue (million) Forecast, by Application 2020 & 2033
- Table 44: ASEAN Public Electric Vehicle Charging Station Revenue (million) Forecast, by Application 2020 & 2033
- Table 45: Oceania Public Electric Vehicle Charging Station Revenue (million) Forecast, by Application 2020 & 2033
- Table 46: Rest of Asia Pacific Public Electric Vehicle Charging Station Revenue (million) Forecast, by Application 2020 & 2033
Frequently Asked Questions
1. What is the projected Compound Annual Growth Rate (CAGR) of the Public Electric Vehicle Charging Station?
The projected CAGR is approximately 25.7%.
2. Which companies are prominent players in the Public Electric Vehicle Charging Station?
Key companies in the market include ABB, Xuji Group, Star Charge, TELD, Efacec, Chargepoint, IES Synergy, DBT-CEV, Auto Electric Power Plant, EV Box, Aplitronic (Hypercharger), CirControl, Pod Point.
3. What are the main segments of the Public Electric Vehicle Charging Station?
The market segments include Application, Type.
4. Can you provide details about the market size?
The market size is estimated to be USD 30650 million as of 2022.
5. What are some drivers contributing to market growth?
N/A
6. What are the notable trends driving market growth?
N/A
7. Are there any restraints impacting market growth?
N/A
8. Can you provide examples of recent developments in the market?
N/A
9. What pricing options are available for accessing the report?
Pricing options include single-user, multi-user, and enterprise licenses priced at USD 2900.00, USD 4350.00, and USD 5800.00 respectively.
10. Is the market size provided in terms of value or volume?
The market size is provided in terms of value, measured in million.
11. Are there any specific market keywords associated with the report?
Yes, the market keyword associated with the report is "Public Electric Vehicle Charging Station," which aids in identifying and referencing the specific market segment covered.
12. How do I determine which pricing option suits my needs best?
The pricing options vary based on user requirements and access needs. Individual users may opt for single-user licenses, while businesses requiring broader access may choose multi-user or enterprise licenses for cost-effective access to the report.
13. Are there any additional resources or data provided in the Public Electric Vehicle Charging Station report?
While the report offers comprehensive insights, it's advisable to review the specific contents or supplementary materials provided to ascertain if additional resources or data are available.
14. How can I stay updated on further developments or reports in the Public Electric Vehicle Charging Station?
To stay informed about further developments, trends, and reports in the Public Electric Vehicle Charging Station, consider subscribing to industry newsletters, following relevant companies and organizations, or regularly checking reputable industry news sources and publications.
Methodology
Step 1 - Identification of Relevant Samples Size from Population Database


Step 2 - Approaches for Defining Global Market Size (Value, Volume* & Price*)

Note*: In applicable scenarios
Step 3 - Data Sources
Primary Research
- Web Analytics
- Survey Reports
- Research Institute
- Latest Research Reports
- Opinion Leaders
Secondary Research
- Annual Reports
- White Paper
- Latest Press Release
- Industry Association
- Paid Database
- Investor Presentations

Step 4 - Data Triangulation
Involves using different sources of information in order to increase the validity of a study
These sources are likely to be stakeholders in a program - participants, other researchers, program staff, other community members, and so on.
Then we put all data in single framework & apply various statistical tools to find out the dynamic on the market.
During the analysis stage, feedback from the stakeholder groups would be compared to determine areas of agreement as well as areas of divergence