

Key Insights
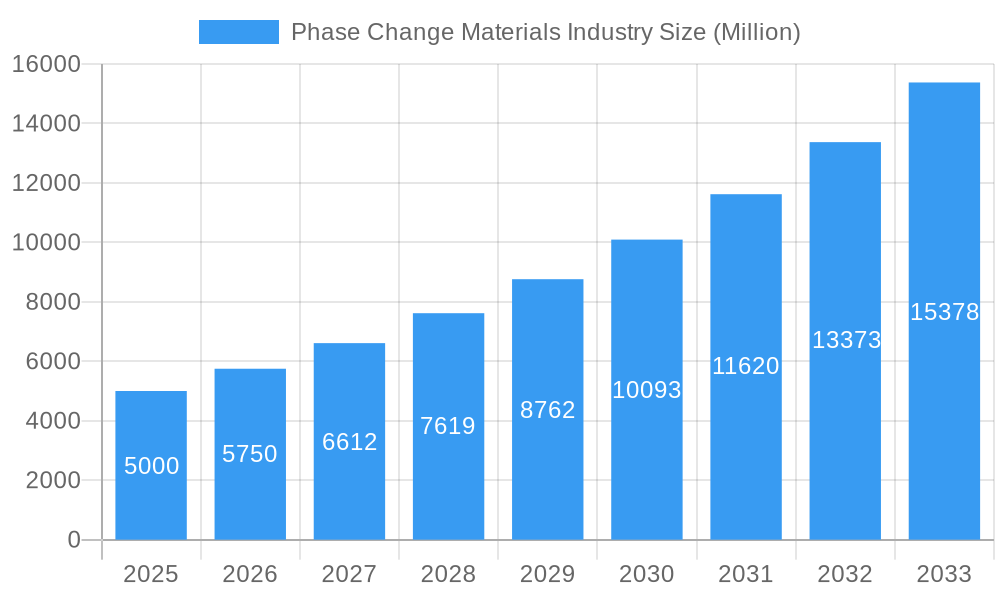
The global Phase Change Materials (PCM) market is demonstrating substantial growth, projected to reach $729.76 million by 2025, with an impressive Compound Annual Growth Rate (CAGR) of 17.58%. This expansion is driven by increasing demand for energy-efficient solutions across various industries, including building and construction, packaging, textiles, electronics, and transportation. The rising imperative for carbon emission reduction and enhanced energy efficiency in building insulation, sustainable packaging, and thermal management for electronics are key market accelerators. Segmentation analysis highlights strong performance across organic, inorganic, and bio-based PCMs, as well as macro, micro, and molecular encapsulation technologies. The building and construction sector is anticipated to lead, leveraging PCMs for superior insulation and temperature regulation. While initial investment costs and manufacturing complexities present minor challenges, ongoing technological advancements in novel PCM development are expected to drive further market expansion and mitigate these restraints. The competitive landscape features established global players and innovative emerging companies vying for market share, with North America and Asia Pacific leading regional growth due to industrialization and governmental support for sustainable technologies.

Phase Change Materials Industry Market Size (In Million)
Further fueling the PCM market's upward trajectory are ongoing advancements in material science, leading to enhanced energy efficiency, product durability, and cost-effectiveness. The development and adoption of sustainable bio-based PCMs are also gaining momentum. Despite potential minor hurdles related to regulatory frameworks and consumer awareness, the long-term market outlook is exceptionally robust. This positivity is primarily attributed to the increasing global emphasis on green building technologies and sustainable practices across a broad spectrum of industrial applications. The PCM market's versatility, combined with its significant environmental benefits, secures its sustained appeal to businesses and consumers alike, promising a trajectory of considerable and enduring growth.
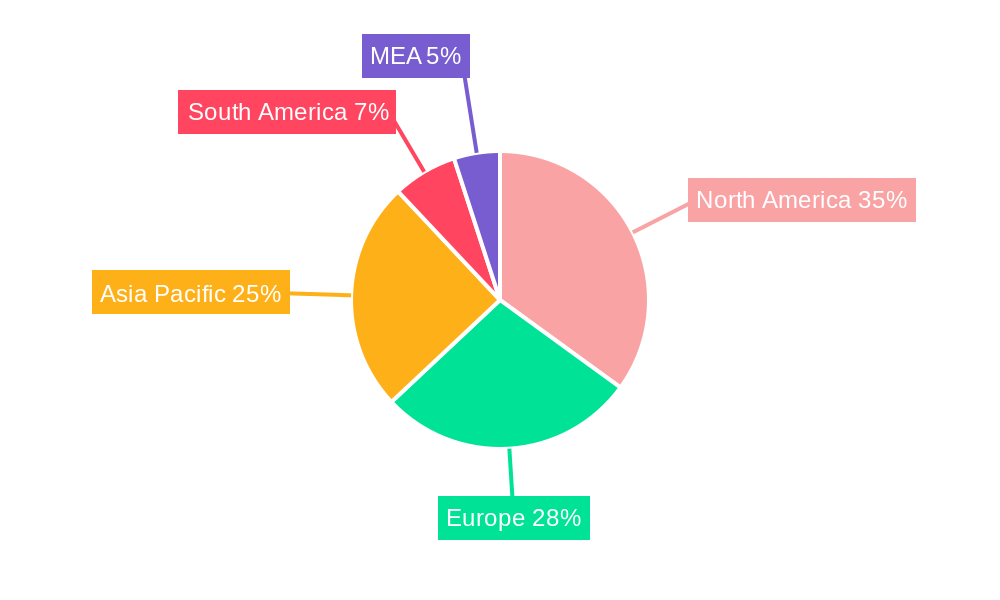
Phase Change Materials Industry Company Market Share
Phase Change Materials (PCM) Industry Market Report: 2019-2033
This comprehensive report provides a detailed analysis of the Phase Change Materials (PCM) industry, offering invaluable insights for stakeholders seeking to understand market dynamics, growth opportunities, and competitive landscapes. The report covers the period 2019-2033, with a focus on the forecast period 2025-2033 and a base year of 2025. The total market size is projected to reach xx Million by 2033.
Phase Change Materials Industry Market Composition & Trends
This section delves into the intricate structure of the PCM market, examining market concentration, innovation drivers, regulatory frameworks, substitute products, end-user profiles, and mergers and acquisitions (M&A) activities. The report analyzes the market share distribution among key players, revealing a moderately concentrated market with several prominent companies holding significant shares. For example, the top five players account for an estimated xx% of the global market.
- Market Concentration: Moderately concentrated, with top 5 players holding xx% market share.
- Innovation Catalysts: Focus on sustainable solutions, energy efficiency, and advanced encapsulation technologies.
- Regulatory Landscape: Varying regional regulations influence adoption rates and material specifications. Stringent environmental regulations are driving demand for bio-based PCMs.
- Substitute Products: Traditional insulation materials and other thermal management technologies pose competition.
- End-User Profiles: Significant demand comes from Building & Construction, Electronics, and Packaging sectors.
- M&A Activities: The report includes an analysis of recent M&A deals, with total transaction values exceeding xx Million in the past five years, indicating industry consolidation and expansion. Examples include [Specific examples of M&A deals if available, otherwise state: Data on specific M&A deal values are limited].
Phase Change Materials Industry Industry Evolution
This section provides a thorough examination of the PCM industry's evolutionary trajectory. It analyzes market growth trajectories, technological advancements, and evolving consumer preferences. From 2019 to 2024, the market experienced a Compound Annual Growth Rate (CAGR) of xx%, driven primarily by increasing demand from the building and construction sector and the electronics industry. This growth is expected to continue, with a projected CAGR of xx% from 2025 to 2033. The adoption of PCMs in new applications, such as textiles and transportation, is also contributing significantly. Technological advancements, particularly in micro and molecular encapsulation, are further propelling market expansion. The increasing focus on sustainability and energy efficiency is shaping consumer demands, favoring bio-based PCMs and other environmentally friendly options. Consumer preference shifts towards energy efficient and sustainable products is driving the demand.
Leading Regions, Countries, or Segments in Phase Change Materials Industry
This analysis identifies the leading regions, countries, and segments within the PCM industry. The report finds that [Region - e.g., North America or Asia-Pacific] currently holds the largest market share, driven by factors including high construction activity, strong technological advancements, and supportive government policies.
- By Product Type: Inorganic PCMs currently dominate the market due to their superior thermal properties and cost-effectiveness; however, bio-based PCMs are experiencing rapid growth fueled by environmental concerns.
- By Encapsulation Technology: Micro-encapsulation is the leading technology due to its versatility and efficiency in various applications.
- By End-user Industry: The Building and Construction sector represents the largest end-use segment, followed by the Electronics industry.
Key Drivers:
- Building & Construction: Strong growth in infrastructure development, energy efficiency standards, and green building initiatives.
- Electronics: Increasing demand for thermal management solutions in portable electronics and data centers.
- Government Policies: Incentives and regulations promoting energy efficiency and sustainability are driving adoption.
Phase Change Materials Industry Product Innovations
Recent innovations in PCM technology focus on enhancing thermal performance, improving durability, and expanding application possibilities. New formulations of bio-based PCMs offer eco-friendly alternatives while maintaining high energy storage capacity. Advancements in micro and molecular encapsulation techniques allow for greater control over PCM properties and integration into diverse materials. The development of novel PCMs with tailored melting points and latent heat capacities expands their applicability in various thermal management applications.
Propelling Factors for Phase Change Materials Industry Growth
Several factors are driving the growth of the PCM industry. These include technological advancements leading to enhanced performance and cost-effectiveness, supportive government policies promoting energy efficiency and sustainable materials, and increasing consumer awareness of the benefits of PCMs in improving thermal comfort and energy conservation. Growing demand from various end-use sectors, particularly building & construction and electronics, is also fueling market expansion.
Obstacles in the Phase Change Materials Industry Market
Despite the promising outlook, the PCM industry faces certain challenges. These include the relatively high initial cost of PCM integration compared to traditional thermal management solutions, potential supply chain disruptions affecting the availability of raw materials, and competitive pressures from established insulation and thermal management technologies. Furthermore, the lack of standardization in PCM specifications and testing protocols can hinder market growth. The high cost of production is a hindrance and it will need to be addressed to compete with the existing technologies.
Future Opportunities in Phase Change Materials Industry
Future opportunities lie in exploring new applications for PCMs in emerging sectors like smart textiles and advanced battery technologies. Further innovation in material science and encapsulation methods will lead to enhanced PCM properties and expanded market reach. The development of novel bio-based PCMs offers a significant opportunity for sustainable growth. Continued investment in research and development will be essential to unlock the full potential of PCM technology.
Major Players in the Phase Change Materials Industry Ecosystem
- Appvion Inc
- Henkel AG & Co KGaA
- Shin-Etsu Chemical Co Ltd
- Rubitherm Technologies GmbH
- Cryopak
- Microtek Laboratories Inc
- Croda International Plc
- Outlast Technologies LLC
- Entropy Solution
- Shenzhen Aochuan Technology Co Ltd
- Laird Technologies
- National Gypsum Services Company
- Parker Hannifin Corp
Key Developments in Phase Change Materials Industry Industry
- September 2022: Sinomax USA launched Bio Frost, the first bio-based phase change material in foam bedding, offering a more sustainable and affordable cooling solution.
- October 2022: Shanghai Polytechnic University researchers developed highly efficient phase change microcapsules for solar energy storage, showcasing enhanced heat transfer and storage properties.
Strategic Phase Change Materials Industry Market Forecast
The PCM market is poised for significant growth driven by increasing demand for energy-efficient and sustainable thermal management solutions. Technological innovations, expanding applications, and supportive government policies will continue to drive market expansion. The focus on sustainability and the development of bio-based PCMs will further enhance market prospects. The market is expected to witness strong growth in the coming years, driven by continued technological advancements and increasing demand from various sectors.
Phase Change Materials Industry Segmentation
-
1. Product Type
- 1.1. Organic
- 1.2. Inorganic
- 1.3. Bio-based
-
2. Encapsulation Technology
- 2.1. Macro
- 2.2. Micro
- 2.3. Molecular
-
3. End-user Industry
- 3.1. Building and Construction
- 3.2. Packaging
- 3.3. Textiles
- 3.4. Electronics
- 3.5. Transportation
- 3.6. Other End-user Industries
Phase Change Materials Industry Segmentation By Geography
-
1. Asia Pacific
- 1.1. China
- 1.2. India
- 1.3. Japan
- 1.4. South Korea
- 1.5. Rest of Asia Pacific
-
2. North America
- 2.1. United States
- 2.2. Canada
- 2.3. Mexico
-
3. Europe
- 3.1. Germany
- 3.2. United Kingdom
- 3.3. Italy
- 3.4. France
- 3.5. Rest of Europe
-
4. Rest of the World
- 4.1. Brazil
- 4.2. Saudi Arabia
- 4.3. South Africa
- 4.4. Other Countries
Phase Change Materials Industry Regional Market Share
Geographic Coverage of Phase Change Materials Industry
Phase Change Materials Industry REPORT HIGHLIGHTS
| Aspects | Details |
|---|---|
| Study Period | 2020-2034 |
| Base Year | 2025 |
| Estimated Year | 2026 |
| Forecast Period | 2026-2034 |
| Historical Period | 2020-2025 |
| Growth Rate | CAGR of 17.58% from 2020-2034 |
| Segmentation |
|
Table of Contents
- 1. Introduction
- 1.1. Research Scope
- 1.2. Market Segmentation
- 1.3. Research Methodology
- 1.4. Definitions and Assumptions
- 2. Executive Summary
- 2.1. Introduction
- 3. Market Dynamics
- 3.1. Introduction
- 3.2. Market Drivers
- 3.2.1. Expanding Global Trend Towards Energy Conservation and Sustainable Development; Other Drivers
- 3.3. Market Restrains
- 3.3.1. Hazardous Nature of Phase Change Materials; Other Restraints
- 3.4. Market Trends
- 3.4.1. Building and Construction Industry to Dominate the Market
- 4. Market Factor Analysis
- 4.1. Porters Five Forces
- 4.2. Supply/Value Chain
- 4.3. PESTEL analysis
- 4.4. Market Entropy
- 4.5. Patent/Trademark Analysis
- 5. Global Phase Change Materials Industry Analysis, Insights and Forecast, 2020-2032
- 5.1. Market Analysis, Insights and Forecast - by Product Type
- 5.1.1. Organic
- 5.1.2. Inorganic
- 5.1.3. Bio-based
- 5.2. Market Analysis, Insights and Forecast - by Encapsulation Technology
- 5.2.1. Macro
- 5.2.2. Micro
- 5.2.3. Molecular
- 5.3. Market Analysis, Insights and Forecast - by End-user Industry
- 5.3.1. Building and Construction
- 5.3.2. Packaging
- 5.3.3. Textiles
- 5.3.4. Electronics
- 5.3.5. Transportation
- 5.3.6. Other End-user Industries
- 5.4. Market Analysis, Insights and Forecast - by Region
- 5.4.1. Asia Pacific
- 5.4.2. North America
- 5.4.3. Europe
- 5.4.4. Rest of the World
- 5.1. Market Analysis, Insights and Forecast - by Product Type
- 6. Asia Pacific Phase Change Materials Industry Analysis, Insights and Forecast, 2020-2032
- 6.1. Market Analysis, Insights and Forecast - by Product Type
- 6.1.1. Organic
- 6.1.2. Inorganic
- 6.1.3. Bio-based
- 6.2. Market Analysis, Insights and Forecast - by Encapsulation Technology
- 6.2.1. Macro
- 6.2.2. Micro
- 6.2.3. Molecular
- 6.3. Market Analysis, Insights and Forecast - by End-user Industry
- 6.3.1. Building and Construction
- 6.3.2. Packaging
- 6.3.3. Textiles
- 6.3.4. Electronics
- 6.3.5. Transportation
- 6.3.6. Other End-user Industries
- 6.1. Market Analysis, Insights and Forecast - by Product Type
- 7. North America Phase Change Materials Industry Analysis, Insights and Forecast, 2020-2032
- 7.1. Market Analysis, Insights and Forecast - by Product Type
- 7.1.1. Organic
- 7.1.2. Inorganic
- 7.1.3. Bio-based
- 7.2. Market Analysis, Insights and Forecast - by Encapsulation Technology
- 7.2.1. Macro
- 7.2.2. Micro
- 7.2.3. Molecular
- 7.3. Market Analysis, Insights and Forecast - by End-user Industry
- 7.3.1. Building and Construction
- 7.3.2. Packaging
- 7.3.3. Textiles
- 7.3.4. Electronics
- 7.3.5. Transportation
- 7.3.6. Other End-user Industries
- 7.1. Market Analysis, Insights and Forecast - by Product Type
- 8. Europe Phase Change Materials Industry Analysis, Insights and Forecast, 2020-2032
- 8.1. Market Analysis, Insights and Forecast - by Product Type
- 8.1.1. Organic
- 8.1.2. Inorganic
- 8.1.3. Bio-based
- 8.2. Market Analysis, Insights and Forecast - by Encapsulation Technology
- 8.2.1. Macro
- 8.2.2. Micro
- 8.2.3. Molecular
- 8.3. Market Analysis, Insights and Forecast - by End-user Industry
- 8.3.1. Building and Construction
- 8.3.2. Packaging
- 8.3.3. Textiles
- 8.3.4. Electronics
- 8.3.5. Transportation
- 8.3.6. Other End-user Industries
- 8.1. Market Analysis, Insights and Forecast - by Product Type
- 9. Rest of the World Phase Change Materials Industry Analysis, Insights and Forecast, 2020-2032
- 9.1. Market Analysis, Insights and Forecast - by Product Type
- 9.1.1. Organic
- 9.1.2. Inorganic
- 9.1.3. Bio-based
- 9.2. Market Analysis, Insights and Forecast - by Encapsulation Technology
- 9.2.1. Macro
- 9.2.2. Micro
- 9.2.3. Molecular
- 9.3. Market Analysis, Insights and Forecast - by End-user Industry
- 9.3.1. Building and Construction
- 9.3.2. Packaging
- 9.3.3. Textiles
- 9.3.4. Electronics
- 9.3.5. Transportation
- 9.3.6. Other End-user Industries
- 9.1. Market Analysis, Insights and Forecast - by Product Type
- 10. Competitive Analysis
- 10.1. Global Market Share Analysis 2025
- 10.2. Company Profiles
- 10.2.1 Appvion Inc
- 10.2.1.1. Overview
- 10.2.1.2. Products
- 10.2.1.3. SWOT Analysis
- 10.2.1.4. Recent Developments
- 10.2.1.5. Financials (Based on Availability)
- 10.2.2 Henkel AG & Co KGAA
- 10.2.2.1. Overview
- 10.2.2.2. Products
- 10.2.2.3. SWOT Analysis
- 10.2.2.4. Recent Developments
- 10.2.2.5. Financials (Based on Availability)
- 10.2.3 Shin-Etsu Chemical Co Ltd
- 10.2.3.1. Overview
- 10.2.3.2. Products
- 10.2.3.3. SWOT Analysis
- 10.2.3.4. Recent Developments
- 10.2.3.5. Financials (Based on Availability)
- 10.2.4 Rubitherm Technologies GmbH
- 10.2.4.1. Overview
- 10.2.4.2. Products
- 10.2.4.3. SWOT Analysis
- 10.2.4.4. Recent Developments
- 10.2.4.5. Financials (Based on Availability)
- 10.2.5 Cryopak
- 10.2.5.1. Overview
- 10.2.5.2. Products
- 10.2.5.3. SWOT Analysis
- 10.2.5.4. Recent Developments
- 10.2.5.5. Financials (Based on Availability)
- 10.2.6 Microtek Laboratories Inc
- 10.2.6.1. Overview
- 10.2.6.2. Products
- 10.2.6.3. SWOT Analysis
- 10.2.6.4. Recent Developments
- 10.2.6.5. Financials (Based on Availability)
- 10.2.7 Croda International Plc
- 10.2.7.1. Overview
- 10.2.7.2. Products
- 10.2.7.3. SWOT Analysis
- 10.2.7.4. Recent Developments
- 10.2.7.5. Financials (Based on Availability)
- 10.2.8 Outlast Technologies LLC
- 10.2.8.1. Overview
- 10.2.8.2. Products
- 10.2.8.3. SWOT Analysis
- 10.2.8.4. Recent Developments
- 10.2.8.5. Financials (Based on Availability)
- 10.2.9 Entropy Solution
- 10.2.9.1. Overview
- 10.2.9.2. Products
- 10.2.9.3. SWOT Analysis
- 10.2.9.4. Recent Developments
- 10.2.9.5. Financials (Based on Availability)
- 10.2.10 Shenzhen Aochuan Technology Co Ltd
- 10.2.10.1. Overview
- 10.2.10.2. Products
- 10.2.10.3. SWOT Analysis
- 10.2.10.4. Recent Developments
- 10.2.10.5. Financials (Based on Availability)
- 10.2.11 Laird Technologies
- 10.2.11.1. Overview
- 10.2.11.2. Products
- 10.2.11.3. SWOT Analysis
- 10.2.11.4. Recent Developments
- 10.2.11.5. Financials (Based on Availability)
- 10.2.12 National Gypsum Services Company
- 10.2.12.1. Overview
- 10.2.12.2. Products
- 10.2.12.3. SWOT Analysis
- 10.2.12.4. Recent Developments
- 10.2.12.5. Financials (Based on Availability)
- 10.2.13 Parker Hannifin Corp
- 10.2.13.1. Overview
- 10.2.13.2. Products
- 10.2.13.3. SWOT Analysis
- 10.2.13.4. Recent Developments
- 10.2.13.5. Financials (Based on Availability)
- 10.2.1 Appvion Inc
List of Figures
- Figure 1: Global Phase Change Materials Industry Revenue Breakdown (million, %) by Region 2025 & 2033
- Figure 2: Global Phase Change Materials Industry Volume Breakdown (K Tons, %) by Region 2025 & 2033
- Figure 3: Asia Pacific Phase Change Materials Industry Revenue (million), by Product Type 2025 & 2033
- Figure 4: Asia Pacific Phase Change Materials Industry Volume (K Tons), by Product Type 2025 & 2033
- Figure 5: Asia Pacific Phase Change Materials Industry Revenue Share (%), by Product Type 2025 & 2033
- Figure 6: Asia Pacific Phase Change Materials Industry Volume Share (%), by Product Type 2025 & 2033
- Figure 7: Asia Pacific Phase Change Materials Industry Revenue (million), by Encapsulation Technology 2025 & 2033
- Figure 8: Asia Pacific Phase Change Materials Industry Volume (K Tons), by Encapsulation Technology 2025 & 2033
- Figure 9: Asia Pacific Phase Change Materials Industry Revenue Share (%), by Encapsulation Technology 2025 & 2033
- Figure 10: Asia Pacific Phase Change Materials Industry Volume Share (%), by Encapsulation Technology 2025 & 2033
- Figure 11: Asia Pacific Phase Change Materials Industry Revenue (million), by End-user Industry 2025 & 2033
- Figure 12: Asia Pacific Phase Change Materials Industry Volume (K Tons), by End-user Industry 2025 & 2033
- Figure 13: Asia Pacific Phase Change Materials Industry Revenue Share (%), by End-user Industry 2025 & 2033
- Figure 14: Asia Pacific Phase Change Materials Industry Volume Share (%), by End-user Industry 2025 & 2033
- Figure 15: Asia Pacific Phase Change Materials Industry Revenue (million), by Country 2025 & 2033
- Figure 16: Asia Pacific Phase Change Materials Industry Volume (K Tons), by Country 2025 & 2033
- Figure 17: Asia Pacific Phase Change Materials Industry Revenue Share (%), by Country 2025 & 2033
- Figure 18: Asia Pacific Phase Change Materials Industry Volume Share (%), by Country 2025 & 2033
- Figure 19: North America Phase Change Materials Industry Revenue (million), by Product Type 2025 & 2033
- Figure 20: North America Phase Change Materials Industry Volume (K Tons), by Product Type 2025 & 2033
- Figure 21: North America Phase Change Materials Industry Revenue Share (%), by Product Type 2025 & 2033
- Figure 22: North America Phase Change Materials Industry Volume Share (%), by Product Type 2025 & 2033
- Figure 23: North America Phase Change Materials Industry Revenue (million), by Encapsulation Technology 2025 & 2033
- Figure 24: North America Phase Change Materials Industry Volume (K Tons), by Encapsulation Technology 2025 & 2033
- Figure 25: North America Phase Change Materials Industry Revenue Share (%), by Encapsulation Technology 2025 & 2033
- Figure 26: North America Phase Change Materials Industry Volume Share (%), by Encapsulation Technology 2025 & 2033
- Figure 27: North America Phase Change Materials Industry Revenue (million), by End-user Industry 2025 & 2033
- Figure 28: North America Phase Change Materials Industry Volume (K Tons), by End-user Industry 2025 & 2033
- Figure 29: North America Phase Change Materials Industry Revenue Share (%), by End-user Industry 2025 & 2033
- Figure 30: North America Phase Change Materials Industry Volume Share (%), by End-user Industry 2025 & 2033
- Figure 31: North America Phase Change Materials Industry Revenue (million), by Country 2025 & 2033
- Figure 32: North America Phase Change Materials Industry Volume (K Tons), by Country 2025 & 2033
- Figure 33: North America Phase Change Materials Industry Revenue Share (%), by Country 2025 & 2033
- Figure 34: North America Phase Change Materials Industry Volume Share (%), by Country 2025 & 2033
- Figure 35: Europe Phase Change Materials Industry Revenue (million), by Product Type 2025 & 2033
- Figure 36: Europe Phase Change Materials Industry Volume (K Tons), by Product Type 2025 & 2033
- Figure 37: Europe Phase Change Materials Industry Revenue Share (%), by Product Type 2025 & 2033
- Figure 38: Europe Phase Change Materials Industry Volume Share (%), by Product Type 2025 & 2033
- Figure 39: Europe Phase Change Materials Industry Revenue (million), by Encapsulation Technology 2025 & 2033
- Figure 40: Europe Phase Change Materials Industry Volume (K Tons), by Encapsulation Technology 2025 & 2033
- Figure 41: Europe Phase Change Materials Industry Revenue Share (%), by Encapsulation Technology 2025 & 2033
- Figure 42: Europe Phase Change Materials Industry Volume Share (%), by Encapsulation Technology 2025 & 2033
- Figure 43: Europe Phase Change Materials Industry Revenue (million), by End-user Industry 2025 & 2033
- Figure 44: Europe Phase Change Materials Industry Volume (K Tons), by End-user Industry 2025 & 2033
- Figure 45: Europe Phase Change Materials Industry Revenue Share (%), by End-user Industry 2025 & 2033
- Figure 46: Europe Phase Change Materials Industry Volume Share (%), by End-user Industry 2025 & 2033
- Figure 47: Europe Phase Change Materials Industry Revenue (million), by Country 2025 & 2033
- Figure 48: Europe Phase Change Materials Industry Volume (K Tons), by Country 2025 & 2033
- Figure 49: Europe Phase Change Materials Industry Revenue Share (%), by Country 2025 & 2033
- Figure 50: Europe Phase Change Materials Industry Volume Share (%), by Country 2025 & 2033
- Figure 51: Rest of the World Phase Change Materials Industry Revenue (million), by Product Type 2025 & 2033
- Figure 52: Rest of the World Phase Change Materials Industry Volume (K Tons), by Product Type 2025 & 2033
- Figure 53: Rest of the World Phase Change Materials Industry Revenue Share (%), by Product Type 2025 & 2033
- Figure 54: Rest of the World Phase Change Materials Industry Volume Share (%), by Product Type 2025 & 2033
- Figure 55: Rest of the World Phase Change Materials Industry Revenue (million), by Encapsulation Technology 2025 & 2033
- Figure 56: Rest of the World Phase Change Materials Industry Volume (K Tons), by Encapsulation Technology 2025 & 2033
- Figure 57: Rest of the World Phase Change Materials Industry Revenue Share (%), by Encapsulation Technology 2025 & 2033
- Figure 58: Rest of the World Phase Change Materials Industry Volume Share (%), by Encapsulation Technology 2025 & 2033
- Figure 59: Rest of the World Phase Change Materials Industry Revenue (million), by End-user Industry 2025 & 2033
- Figure 60: Rest of the World Phase Change Materials Industry Volume (K Tons), by End-user Industry 2025 & 2033
- Figure 61: Rest of the World Phase Change Materials Industry Revenue Share (%), by End-user Industry 2025 & 2033
- Figure 62: Rest of the World Phase Change Materials Industry Volume Share (%), by End-user Industry 2025 & 2033
- Figure 63: Rest of the World Phase Change Materials Industry Revenue (million), by Country 2025 & 2033
- Figure 64: Rest of the World Phase Change Materials Industry Volume (K Tons), by Country 2025 & 2033
- Figure 65: Rest of the World Phase Change Materials Industry Revenue Share (%), by Country 2025 & 2033
- Figure 66: Rest of the World Phase Change Materials Industry Volume Share (%), by Country 2025 & 2033
List of Tables
- Table 1: Global Phase Change Materials Industry Revenue million Forecast, by Product Type 2020 & 2033
- Table 2: Global Phase Change Materials Industry Volume K Tons Forecast, by Product Type 2020 & 2033
- Table 3: Global Phase Change Materials Industry Revenue million Forecast, by Encapsulation Technology 2020 & 2033
- Table 4: Global Phase Change Materials Industry Volume K Tons Forecast, by Encapsulation Technology 2020 & 2033
- Table 5: Global Phase Change Materials Industry Revenue million Forecast, by End-user Industry 2020 & 2033
- Table 6: Global Phase Change Materials Industry Volume K Tons Forecast, by End-user Industry 2020 & 2033
- Table 7: Global Phase Change Materials Industry Revenue million Forecast, by Region 2020 & 2033
- Table 8: Global Phase Change Materials Industry Volume K Tons Forecast, by Region 2020 & 2033
- Table 9: Global Phase Change Materials Industry Revenue million Forecast, by Product Type 2020 & 2033
- Table 10: Global Phase Change Materials Industry Volume K Tons Forecast, by Product Type 2020 & 2033
- Table 11: Global Phase Change Materials Industry Revenue million Forecast, by Encapsulation Technology 2020 & 2033
- Table 12: Global Phase Change Materials Industry Volume K Tons Forecast, by Encapsulation Technology 2020 & 2033
- Table 13: Global Phase Change Materials Industry Revenue million Forecast, by End-user Industry 2020 & 2033
- Table 14: Global Phase Change Materials Industry Volume K Tons Forecast, by End-user Industry 2020 & 2033
- Table 15: Global Phase Change Materials Industry Revenue million Forecast, by Country 2020 & 2033
- Table 16: Global Phase Change Materials Industry Volume K Tons Forecast, by Country 2020 & 2033
- Table 17: China Phase Change Materials Industry Revenue (million) Forecast, by Application 2020 & 2033
- Table 18: China Phase Change Materials Industry Volume (K Tons) Forecast, by Application 2020 & 2033
- Table 19: India Phase Change Materials Industry Revenue (million) Forecast, by Application 2020 & 2033
- Table 20: India Phase Change Materials Industry Volume (K Tons) Forecast, by Application 2020 & 2033
- Table 21: Japan Phase Change Materials Industry Revenue (million) Forecast, by Application 2020 & 2033
- Table 22: Japan Phase Change Materials Industry Volume (K Tons) Forecast, by Application 2020 & 2033
- Table 23: South Korea Phase Change Materials Industry Revenue (million) Forecast, by Application 2020 & 2033
- Table 24: South Korea Phase Change Materials Industry Volume (K Tons) Forecast, by Application 2020 & 2033
- Table 25: Rest of Asia Pacific Phase Change Materials Industry Revenue (million) Forecast, by Application 2020 & 2033
- Table 26: Rest of Asia Pacific Phase Change Materials Industry Volume (K Tons) Forecast, by Application 2020 & 2033
- Table 27: Global Phase Change Materials Industry Revenue million Forecast, by Product Type 2020 & 2033
- Table 28: Global Phase Change Materials Industry Volume K Tons Forecast, by Product Type 2020 & 2033
- Table 29: Global Phase Change Materials Industry Revenue million Forecast, by Encapsulation Technology 2020 & 2033
- Table 30: Global Phase Change Materials Industry Volume K Tons Forecast, by Encapsulation Technology 2020 & 2033
- Table 31: Global Phase Change Materials Industry Revenue million Forecast, by End-user Industry 2020 & 2033
- Table 32: Global Phase Change Materials Industry Volume K Tons Forecast, by End-user Industry 2020 & 2033
- Table 33: Global Phase Change Materials Industry Revenue million Forecast, by Country 2020 & 2033
- Table 34: Global Phase Change Materials Industry Volume K Tons Forecast, by Country 2020 & 2033
- Table 35: United States Phase Change Materials Industry Revenue (million) Forecast, by Application 2020 & 2033
- Table 36: United States Phase Change Materials Industry Volume (K Tons) Forecast, by Application 2020 & 2033
- Table 37: Canada Phase Change Materials Industry Revenue (million) Forecast, by Application 2020 & 2033
- Table 38: Canada Phase Change Materials Industry Volume (K Tons) Forecast, by Application 2020 & 2033
- Table 39: Mexico Phase Change Materials Industry Revenue (million) Forecast, by Application 2020 & 2033
- Table 40: Mexico Phase Change Materials Industry Volume (K Tons) Forecast, by Application 2020 & 2033
- Table 41: Global Phase Change Materials Industry Revenue million Forecast, by Product Type 2020 & 2033
- Table 42: Global Phase Change Materials Industry Volume K Tons Forecast, by Product Type 2020 & 2033
- Table 43: Global Phase Change Materials Industry Revenue million Forecast, by Encapsulation Technology 2020 & 2033
- Table 44: Global Phase Change Materials Industry Volume K Tons Forecast, by Encapsulation Technology 2020 & 2033
- Table 45: Global Phase Change Materials Industry Revenue million Forecast, by End-user Industry 2020 & 2033
- Table 46: Global Phase Change Materials Industry Volume K Tons Forecast, by End-user Industry 2020 & 2033
- Table 47: Global Phase Change Materials Industry Revenue million Forecast, by Country 2020 & 2033
- Table 48: Global Phase Change Materials Industry Volume K Tons Forecast, by Country 2020 & 2033
- Table 49: Germany Phase Change Materials Industry Revenue (million) Forecast, by Application 2020 & 2033
- Table 50: Germany Phase Change Materials Industry Volume (K Tons) Forecast, by Application 2020 & 2033
- Table 51: United Kingdom Phase Change Materials Industry Revenue (million) Forecast, by Application 2020 & 2033
- Table 52: United Kingdom Phase Change Materials Industry Volume (K Tons) Forecast, by Application 2020 & 2033
- Table 53: Italy Phase Change Materials Industry Revenue (million) Forecast, by Application 2020 & 2033
- Table 54: Italy Phase Change Materials Industry Volume (K Tons) Forecast, by Application 2020 & 2033
- Table 55: France Phase Change Materials Industry Revenue (million) Forecast, by Application 2020 & 2033
- Table 56: France Phase Change Materials Industry Volume (K Tons) Forecast, by Application 2020 & 2033
- Table 57: Rest of Europe Phase Change Materials Industry Revenue (million) Forecast, by Application 2020 & 2033
- Table 58: Rest of Europe Phase Change Materials Industry Volume (K Tons) Forecast, by Application 2020 & 2033
- Table 59: Global Phase Change Materials Industry Revenue million Forecast, by Product Type 2020 & 2033
- Table 60: Global Phase Change Materials Industry Volume K Tons Forecast, by Product Type 2020 & 2033
- Table 61: Global Phase Change Materials Industry Revenue million Forecast, by Encapsulation Technology 2020 & 2033
- Table 62: Global Phase Change Materials Industry Volume K Tons Forecast, by Encapsulation Technology 2020 & 2033
- Table 63: Global Phase Change Materials Industry Revenue million Forecast, by End-user Industry 2020 & 2033
- Table 64: Global Phase Change Materials Industry Volume K Tons Forecast, by End-user Industry 2020 & 2033
- Table 65: Global Phase Change Materials Industry Revenue million Forecast, by Country 2020 & 2033
- Table 66: Global Phase Change Materials Industry Volume K Tons Forecast, by Country 2020 & 2033
- Table 67: Brazil Phase Change Materials Industry Revenue (million) Forecast, by Application 2020 & 2033
- Table 68: Brazil Phase Change Materials Industry Volume (K Tons) Forecast, by Application 2020 & 2033
- Table 69: Saudi Arabia Phase Change Materials Industry Revenue (million) Forecast, by Application 2020 & 2033
- Table 70: Saudi Arabia Phase Change Materials Industry Volume (K Tons) Forecast, by Application 2020 & 2033
- Table 71: South Africa Phase Change Materials Industry Revenue (million) Forecast, by Application 2020 & 2033
- Table 72: South Africa Phase Change Materials Industry Volume (K Tons) Forecast, by Application 2020 & 2033
- Table 73: Other Countries Phase Change Materials Industry Revenue (million) Forecast, by Application 2020 & 2033
- Table 74: Other Countries Phase Change Materials Industry Volume (K Tons) Forecast, by Application 2020 & 2033
Frequently Asked Questions
1. What is the projected Compound Annual Growth Rate (CAGR) of the Phase Change Materials Industry?
The projected CAGR is approximately 17.58%.
2. Which companies are prominent players in the Phase Change Materials Industry?
Key companies in the market include Appvion Inc, Henkel AG & Co KGAA, Shin-Etsu Chemical Co Ltd, Rubitherm Technologies GmbH, Cryopak, Microtek Laboratories Inc, Croda International Plc, Outlast Technologies LLC, Entropy Solution, Shenzhen Aochuan Technology Co Ltd, Laird Technologies, National Gypsum Services Company, Parker Hannifin Corp.
3. What are the main segments of the Phase Change Materials Industry?
The market segments include Product Type, Encapsulation Technology, End-user Industry.
4. Can you provide details about the market size?
The market size is estimated to be USD 729.76 million as of 2022.
5. What are some drivers contributing to market growth?
Expanding Global Trend Towards Energy Conservation and Sustainable Development; Other Drivers.
6. What are the notable trends driving market growth?
Building and Construction Industry to Dominate the Market.
7. Are there any restraints impacting market growth?
Hazardous Nature of Phase Change Materials; Other Restraints.
8. Can you provide examples of recent developments in the market?
October 2022: Shanghai Polytechnic University researchers announced the development of a new efficient phase change microcapsules for storing solar energy. The newly designed microcapsule demonstrated enhanced heat transfer, storage properties, and high-performance photothermal conversion.
9. What pricing options are available for accessing the report?
Pricing options include single-user, multi-user, and enterprise licenses priced at USD 4750, USD 5250, and USD 8750 respectively.
10. Is the market size provided in terms of value or volume?
The market size is provided in terms of value, measured in million and volume, measured in K Tons.
11. Are there any specific market keywords associated with the report?
Yes, the market keyword associated with the report is "Phase Change Materials Industry," which aids in identifying and referencing the specific market segment covered.
12. How do I determine which pricing option suits my needs best?
The pricing options vary based on user requirements and access needs. Individual users may opt for single-user licenses, while businesses requiring broader access may choose multi-user or enterprise licenses for cost-effective access to the report.
13. Are there any additional resources or data provided in the Phase Change Materials Industry report?
While the report offers comprehensive insights, it's advisable to review the specific contents or supplementary materials provided to ascertain if additional resources or data are available.
14. How can I stay updated on further developments or reports in the Phase Change Materials Industry?
To stay informed about further developments, trends, and reports in the Phase Change Materials Industry, consider subscribing to industry newsletters, following relevant companies and organizations, or regularly checking reputable industry news sources and publications.
Methodology
Step 1 - Identification of Relevant Samples Size from Population Database


Step 2 - Approaches for Defining Global Market Size (Value, Volume* & Price*)

Note*: In applicable scenarios
Step 3 - Data Sources
Primary Research
- Web Analytics
- Survey Reports
- Research Institute
- Latest Research Reports
- Opinion Leaders
Secondary Research
- Annual Reports
- White Paper
- Latest Press Release
- Industry Association
- Paid Database
- Investor Presentations

Step 4 - Data Triangulation
Involves using different sources of information in order to increase the validity of a study
These sources are likely to be stakeholders in a program - participants, other researchers, program staff, other community members, and so on.
Then we put all data in single framework & apply various statistical tools to find out the dynamic on the market.
During the analysis stage, feedback from the stakeholder groups would be compared to determine areas of agreement as well as areas of divergence