

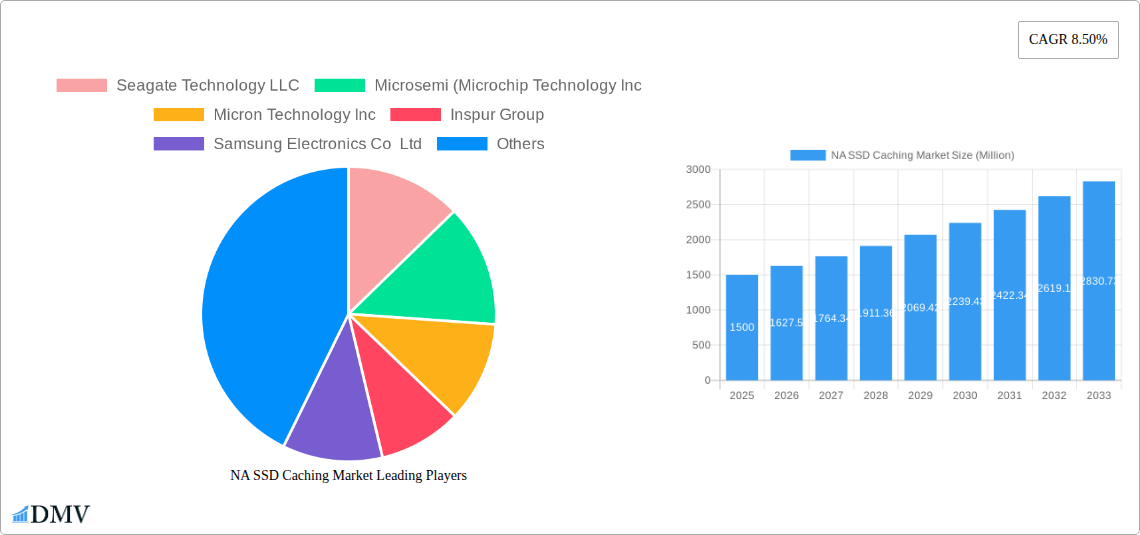
Key Insights
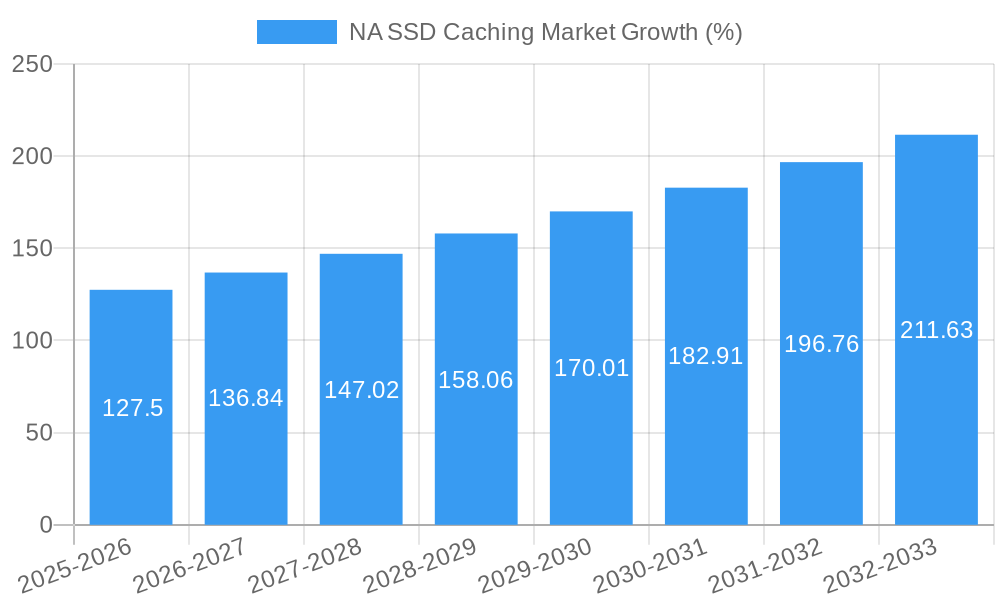
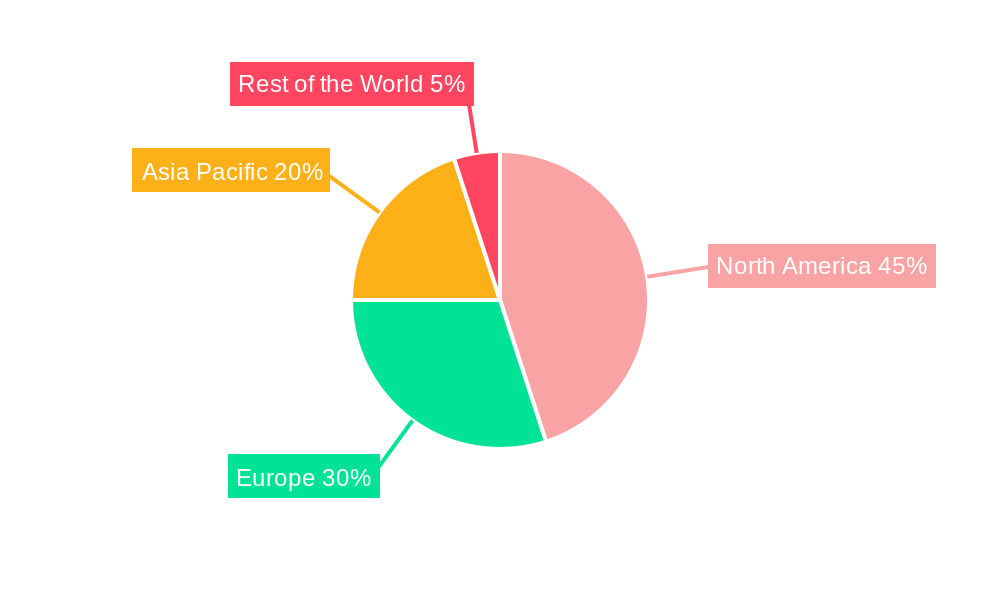
The North American (NA) SSD caching market is experiencing robust growth, driven by the increasing demand for high-performance computing and data storage solutions across enterprise and personal applications. The market's Compound Annual Growth Rate (CAGR) of 8.50% from 2019 to 2024 suggests a significant upward trajectory, projected to continue through 2033. Key drivers include the proliferation of big data analytics, the rise of cloud computing, and the growing adoption of virtualization technologies. Enterprise storage, a major segment, is fueled by the need for faster application response times and improved data management efficiency within organizations. Personal storage, while smaller in size, demonstrates significant growth potential driven by increased consumer demand for faster loading speeds in gaming, video editing, and high-capacity storage for personal media libraries. Leading vendors such as Seagate, Micron, Western Digital, and Samsung are actively competing to cater to this growing demand, investing heavily in research and development to improve SSD performance, capacity, and reliability. While the market faces constraints such as high initial investment costs and potential data security concerns, the overall positive market dynamics point toward continued expansion in the coming years. The NA market, benefiting from robust technological advancements and high adoption rates of SSD technology, is expected to remain a key region for this market segment.
The continued growth of the NA SSD caching market will be further propelled by technological innovations leading to greater storage density and reduced costs per gigabyte. Advancements in NVMe (Non-Volatile Memory Express) technology promise even faster data access speeds, which will further stimulate adoption in performance-critical applications, including high-frequency trading, scientific computing, and advanced data analytics. The increasing focus on edge computing also represents a significant opportunity, as the need for fast data processing at the edge necessitates the use of high-performance SSD caching solutions. Competition will intensify, with companies focusing on differentiation through proprietary technologies, value-added services, and strategic partnerships. The market's evolution will likely see a shift towards more specialized and integrated solutions, catering to the unique requirements of various applications and industry verticals. Overall, the NA SSD caching market is poised for considerable expansion, driven by technology improvements, market needs, and strategic vendor initiatives.
NA SSD Caching Market: A Comprehensive Market Report (2019-2033)
This insightful report provides a detailed analysis of the North American SSD caching market, offering crucial insights for stakeholders seeking to navigate this rapidly evolving landscape. The study period covers 2019-2033, with a base year of 2025 and a forecast period of 2025-2033. The report analyzes market trends, leading players, technological advancements, and future growth opportunities, providing a robust foundation for informed decision-making. The market size is expected to reach xx Million by 2033.
NA SSD Caching Market Market Composition & Trends
This section delves into the intricate dynamics of the NA SSD caching market, examining market concentration, innovation drivers, regulatory frameworks, substitute product analysis, end-user profiles, and merger and acquisition (M&A) activities. The report meticulously assesses market share distribution among key players, providing a granular understanding of the competitive landscape. Furthermore, it analyzes the financial aspects of M&A deals, quantifying their impact on market consolidation and future growth trajectories. The xx Million market exhibits a moderately concentrated structure, with the top five players holding approximately xx% of the market share in 2024.
- Market Concentration: High, with a few dominant players.
- Innovation Catalysts: Advancements in NVMe technology, increasing demand for high-speed storage.
- Regulatory Landscape: Compliance with data privacy regulations influencing market growth.
- Substitute Products: Traditional HDDs, other caching technologies posing limited threat.
- End-User Profiles: Dominated by enterprise storage and increasing adoption in personal storage.
- M&A Activities: Significant M&A activity observed in recent years, with deal values totaling approximately xx Million in the past five years.
NA SSD Caching Market Industry Evolution
This section meticulously traces the evolution of the NA SSD caching market, analyzing growth trajectories, technological advancements, and the shifting demands of consumers. Detailed data points, such as precise growth rates and adoption metrics, are provided to offer a clear and comprehensive picture of market evolution. The market experienced a Compound Annual Growth Rate (CAGR) of xx% during the historical period (2019-2024), driven primarily by the increasing adoption of cloud computing and big data analytics. We project a CAGR of xx% during the forecast period (2025-2033). The shift towards higher capacity, faster SSDs, particularly those employing NVMe technology, is a major factor. Consumer adoption of SSDs in personal devices continues to rise steadily, further accelerating market growth. The increasing demand for low-latency applications in various sectors further boosts the market's growth trajectory.
Leading Regions, Countries, or Segments in NA SSD Caching Market
This section pinpoints the dominant region, country, or segment within the NA SSD caching market, focusing on the Application segments: Enterprise Storage and Personal Storage. A detailed examination of the factors driving the dominance of these segments is presented.
- Enterprise Storage: This segment leads due to the substantial need for high-speed data access in data centers and cloud computing environments. Key drivers include:
- Significant investments in data center infrastructure upgrades.
- Stringent requirements for low latency and high IOPS in enterprise applications.
- Growing adoption of virtualization and cloud-based services.
- Personal Storage: The personal storage segment is exhibiting strong growth driven by the increasing demand for faster boot times, improved application responsiveness, and better overall performance in high-end personal computers and gaming devices.
The United States remains the dominant region due to high technological advancements, substantial investments in data center infrastructure, and strong demand across both enterprise and personal storage sectors.
NA SSD Caching Market Product Innovations
Recent years have witnessed significant innovation in NA SSD caching technology, marked by the introduction of higher capacity drives, improved performance metrics (especially read/write speeds), and the increasing adoption of NVMe interfaces. The advancements in 3D NAND technology are leading to greater storage densities and improved energy efficiency. Unique selling propositions now include features like enhanced data security, improved power management, and self-encrypting drives (SEDs) for enhanced data protection.
Propelling Factors for NA SSD Caching Market Growth
Several key factors are driving the expansion of the NA SSD caching market. Technological advancements, such as the transition to NVMe and the development of higher-density 3D NAND flash memory, are paramount. The growing need for faster data access in enterprise applications, fueled by the rise of cloud computing and big data, is another major factor. Furthermore, decreasing prices of SSDs are making them increasingly accessible to a wider range of consumers.
Obstacles in the NA SSD Caching Market Market
Despite the positive growth trajectory, the NA SSD caching market faces certain challenges. Supply chain disruptions, particularly concerning the procurement of raw materials like NAND flash memory, can lead to production bottlenecks and price volatility. Intense competition among numerous established and emerging players creates a pressure on profit margins. Moreover, the market is subject to fluctuations in overall economic conditions, particularly during periods of economic uncertainty.
Future Opportunities in NA SSD Caching Market
The NA SSD caching market holds significant future potential, driven by emerging trends in various sectors. The growing adoption of artificial intelligence (AI) and machine learning (ML) applications will necessitate high-speed storage solutions. Furthermore, the expansion of edge computing and the Internet of Things (IoT) will create a demand for low-latency, high-performance SSDs at the edge of the network. The development of new and innovative technologies, such as persistent memory, presents additional growth opportunities.
Major Players in the NA SSD Caching Market Ecosystem
- Seagate Technology LLC
- Microsemi (Microchip Technology Inc)
- Micron Technology Inc
- Inspur Group
- Samsung Electronics Co Ltd
- Transcend Information Inc
- Kioxia (Toshiba Memory Corporation)
- ADATA Technology Co Ltd
- Western Digital Corporation
- SK Hynix Inc
- NetApp Inc
- Intel Corporation
- QNAP Systems Inc
Key Developments in NA SSD Caching Market Industry
- August 2020: Intel launched SSD D7-P5500/5600 Series, enhancing IT efficiency and data security with optimized performance and capacity for all-TLC arrays.
- March 2021: Intel released the SSD 670p, a 144-layer quad-level cell-based SSD offering up to 2TB capacity, improved performance (2x sequential read speed), and 20% increased endurance compared to its predecessor.
Strategic NA SSD Caching Market Market Forecast
The NA SSD caching market is poised for continued growth driven by technological innovations, increasing data demands, and the expansion of key applications. The ongoing development of faster and higher-capacity SSDs, coupled with decreasing costs, will broaden market adoption across diverse sectors. The forecast period shows promising potential for continued expansion, making it an attractive market for investors and businesses alike.
NA SSD Caching Market Segmentation
-
1. Application
- 1.1. Enterprise Storage
- 1.2. Personal Storage
NA SSD Caching Market Segmentation By Geography
-
1. North America
- 1.1. United States
- 1.2. Canada
- 1.3. Mexico
-
2. South America
- 2.1. Brazil
- 2.2. Argentina
- 2.3. Rest of South America
-
3. Europe
- 3.1. United Kingdom
- 3.2. Germany
- 3.3. France
- 3.4. Italy
- 3.5. Spain
- 3.6. Russia
- 3.7. Benelux
- 3.8. Nordics
- 3.9. Rest of Europe
-
4. Middle East & Africa
- 4.1. Turkey
- 4.2. Israel
- 4.3. GCC
- 4.4. North Africa
- 4.5. South Africa
- 4.6. Rest of Middle East & Africa
-
5. Asia Pacific
- 5.1. China
- 5.2. India
- 5.3. Japan
- 5.4. South Korea
- 5.5. ASEAN
- 5.6. Oceania
- 5.7. Rest of Asia Pacific
NA SSD Caching Market REPORT HIGHLIGHTS
| Aspects | Details |
|---|---|
| Study Period | 2019-2033 |
| Base Year | 2024 |
| Estimated Year | 2025 |
| Forecast Period | 2025-2033 |
| Historical Period | 2019-2024 |
| Growth Rate | CAGR of 8.50% from 2019-2033 |
| Segmentation |
|
Table of Contents
- 1. Introduction
- 1.1. Research Scope
- 1.2. Market Segmentation
- 1.3. Research Methodology
- 1.4. Definitions and Assumptions
- 2. Executive Summary
- 2.1. Introduction
- 3. Market Dynamics
- 3.1. Introduction
- 3.2. Market Drivers
- 3.2.1. Improvements Offered by SSDs Over Conventional HDDs
- 3.3. Market Restrains
- 3.3.1. Slow Pace in Development of Applications Despite Heavy investments in R&D; Commplexities in Hardware Designing
- 3.4. Market Trends
- 3.4.1. Enterprise Storage Expected to Hold Major Share
- 4. Market Factor Analysis
- 4.1. Porters Five Forces
- 4.2. Supply/Value Chain
- 4.3. PESTEL analysis
- 4.4. Market Entropy
- 4.5. Patent/Trademark Analysis
- 5. Global NA SSD Caching Market Analysis, Insights and Forecast, 2019-2031
- 5.1. Market Analysis, Insights and Forecast - by Application
- 5.1.1. Enterprise Storage
- 5.1.2. Personal Storage
- 5.2. Market Analysis, Insights and Forecast - by Region
- 5.2.1. North America
- 5.2.2. South America
- 5.2.3. Europe
- 5.2.4. Middle East & Africa
- 5.2.5. Asia Pacific
- 5.1. Market Analysis, Insights and Forecast - by Application
- 6. North America NA SSD Caching Market Analysis, Insights and Forecast, 2019-2031
- 6.1. Market Analysis, Insights and Forecast - by Application
- 6.1.1. Enterprise Storage
- 6.1.2. Personal Storage
- 6.1. Market Analysis, Insights and Forecast - by Application
- 7. South America NA SSD Caching Market Analysis, Insights and Forecast, 2019-2031
- 7.1. Market Analysis, Insights and Forecast - by Application
- 7.1.1. Enterprise Storage
- 7.1.2. Personal Storage
- 7.1. Market Analysis, Insights and Forecast - by Application
- 8. Europe NA SSD Caching Market Analysis, Insights and Forecast, 2019-2031
- 8.1. Market Analysis, Insights and Forecast - by Application
- 8.1.1. Enterprise Storage
- 8.1.2. Personal Storage
- 8.1. Market Analysis, Insights and Forecast - by Application
- 9. Middle East & Africa NA SSD Caching Market Analysis, Insights and Forecast, 2019-2031
- 9.1. Market Analysis, Insights and Forecast - by Application
- 9.1.1. Enterprise Storage
- 9.1.2. Personal Storage
- 9.1. Market Analysis, Insights and Forecast - by Application
- 10. Asia Pacific NA SSD Caching Market Analysis, Insights and Forecast, 2019-2031
- 10.1. Market Analysis, Insights and Forecast - by Application
- 10.1.1. Enterprise Storage
- 10.1.2. Personal Storage
- 10.1. Market Analysis, Insights and Forecast - by Application
- 11. North America NA SSD Caching Market Analysis, Insights and Forecast, 2019-2031
- 11.1. Market Analysis, Insights and Forecast - By Country/Sub-region
- 11.1.1 United States
- 11.1.2 Canada
- 12. Europe NA SSD Caching Market Analysis, Insights and Forecast, 2019-2031
- 12.1. Market Analysis, Insights and Forecast - By Country/Sub-region
- 12.1.1 Germany
- 12.1.2 United Kingdom
- 12.1.3 France
- 12.1.4 Rest of Europe
- 13. Asia Pacific NA SSD Caching Market Analysis, Insights and Forecast, 2019-2031
- 13.1. Market Analysis, Insights and Forecast - By Country/Sub-region
- 13.1.1 China
- 13.1.2 Taiwan
- 13.1.3 South Korea
- 13.1.4 Rest of Asia Pacific
- 14. Rest of the World NA SSD Caching Market Analysis, Insights and Forecast, 2019-2031
- 14.1. Market Analysis, Insights and Forecast - By Country/Sub-region
- 14.1.1.
- 15. Competitive Analysis
- 15.1. Global Market Share Analysis 2024
- 15.2. Company Profiles
- 15.2.1 Seagate Technology LLC
- 15.2.1.1. Overview
- 15.2.1.2. Products
- 15.2.1.3. SWOT Analysis
- 15.2.1.4. Recent Developments
- 15.2.1.5. Financials (Based on Availability)
- 15.2.2 Microsemi (Microchip Technology Inc
- 15.2.2.1. Overview
- 15.2.2.2. Products
- 15.2.2.3. SWOT Analysis
- 15.2.2.4. Recent Developments
- 15.2.2.5. Financials (Based on Availability)
- 15.2.3 Micron Technology Inc
- 15.2.3.1. Overview
- 15.2.3.2. Products
- 15.2.3.3. SWOT Analysis
- 15.2.3.4. Recent Developments
- 15.2.3.5. Financials (Based on Availability)
- 15.2.4 Inspur Group
- 15.2.4.1. Overview
- 15.2.4.2. Products
- 15.2.4.3. SWOT Analysis
- 15.2.4.4. Recent Developments
- 15.2.4.5. Financials (Based on Availability)
- 15.2.5 Samsung Electronics Co Ltd
- 15.2.5.1. Overview
- 15.2.5.2. Products
- 15.2.5.3. SWOT Analysis
- 15.2.5.4. Recent Developments
- 15.2.5.5. Financials (Based on Availability)
- 15.2.6 Transcend Information Inc
- 15.2.6.1. Overview
- 15.2.6.2. Products
- 15.2.6.3. SWOT Analysis
- 15.2.6.4. Recent Developments
- 15.2.6.5. Financials (Based on Availability)
- 15.2.7 Kioxia (Toshiba Memory Corporation)
- 15.2.7.1. Overview
- 15.2.7.2. Products
- 15.2.7.3. SWOT Analysis
- 15.2.7.4. Recent Developments
- 15.2.7.5. Financials (Based on Availability)
- 15.2.8 ADATA Technology Co Ltd
- 15.2.8.1. Overview
- 15.2.8.2. Products
- 15.2.8.3. SWOT Analysis
- 15.2.8.4. Recent Developments
- 15.2.8.5. Financials (Based on Availability)
- 15.2.9 Western Digital Corporation
- 15.2.9.1. Overview
- 15.2.9.2. Products
- 15.2.9.3. SWOT Analysis
- 15.2.9.4. Recent Developments
- 15.2.9.5. Financials (Based on Availability)
- 15.2.10 SK Hynix Inc
- 15.2.10.1. Overview
- 15.2.10.2. Products
- 15.2.10.3. SWOT Analysis
- 15.2.10.4. Recent Developments
- 15.2.10.5. Financials (Based on Availability)
- 15.2.11 NetApp Inc
- 15.2.11.1. Overview
- 15.2.11.2. Products
- 15.2.11.3. SWOT Analysis
- 15.2.11.4. Recent Developments
- 15.2.11.5. Financials (Based on Availability)
- 15.2.12 Intel Corporation
- 15.2.12.1. Overview
- 15.2.12.2. Products
- 15.2.12.3. SWOT Analysis
- 15.2.12.4. Recent Developments
- 15.2.12.5. Financials (Based on Availability)
- 15.2.13 QNAP Systems Inc
- 15.2.13.1. Overview
- 15.2.13.2. Products
- 15.2.13.3. SWOT Analysis
- 15.2.13.4. Recent Developments
- 15.2.13.5. Financials (Based on Availability)
- 15.2.1 Seagate Technology LLC
List of Figures
- Figure 1: Global NA SSD Caching Market Revenue Breakdown (Million, %) by Region 2024 & 2032
- Figure 2: North America NA SSD Caching Market Revenue (Million), by Country 2024 & 2032
- Figure 3: North America NA SSD Caching Market Revenue Share (%), by Country 2024 & 2032
- Figure 4: Europe NA SSD Caching Market Revenue (Million), by Country 2024 & 2032
- Figure 5: Europe NA SSD Caching Market Revenue Share (%), by Country 2024 & 2032
- Figure 6: Asia Pacific NA SSD Caching Market Revenue (Million), by Country 2024 & 2032
- Figure 7: Asia Pacific NA SSD Caching Market Revenue Share (%), by Country 2024 & 2032
- Figure 8: Rest of the World NA SSD Caching Market Revenue (Million), by Country 2024 & 2032
- Figure 9: Rest of the World NA SSD Caching Market Revenue Share (%), by Country 2024 & 2032
- Figure 10: North America NA SSD Caching Market Revenue (Million), by Application 2024 & 2032
- Figure 11: North America NA SSD Caching Market Revenue Share (%), by Application 2024 & 2032
- Figure 12: North America NA SSD Caching Market Revenue (Million), by Country 2024 & 2032
- Figure 13: North America NA SSD Caching Market Revenue Share (%), by Country 2024 & 2032
- Figure 14: South America NA SSD Caching Market Revenue (Million), by Application 2024 & 2032
- Figure 15: South America NA SSD Caching Market Revenue Share (%), by Application 2024 & 2032
- Figure 16: South America NA SSD Caching Market Revenue (Million), by Country 2024 & 2032
- Figure 17: South America NA SSD Caching Market Revenue Share (%), by Country 2024 & 2032
- Figure 18: Europe NA SSD Caching Market Revenue (Million), by Application 2024 & 2032
- Figure 19: Europe NA SSD Caching Market Revenue Share (%), by Application 2024 & 2032
- Figure 20: Europe NA SSD Caching Market Revenue (Million), by Country 2024 & 2032
- Figure 21: Europe NA SSD Caching Market Revenue Share (%), by Country 2024 & 2032
- Figure 22: Middle East & Africa NA SSD Caching Market Revenue (Million), by Application 2024 & 2032
- Figure 23: Middle East & Africa NA SSD Caching Market Revenue Share (%), by Application 2024 & 2032
- Figure 24: Middle East & Africa NA SSD Caching Market Revenue (Million), by Country 2024 & 2032
- Figure 25: Middle East & Africa NA SSD Caching Market Revenue Share (%), by Country 2024 & 2032
- Figure 26: Asia Pacific NA SSD Caching Market Revenue (Million), by Application 2024 & 2032
- Figure 27: Asia Pacific NA SSD Caching Market Revenue Share (%), by Application 2024 & 2032
- Figure 28: Asia Pacific NA SSD Caching Market Revenue (Million), by Country 2024 & 2032
- Figure 29: Asia Pacific NA SSD Caching Market Revenue Share (%), by Country 2024 & 2032
List of Tables
- Table 1: Global NA SSD Caching Market Revenue Million Forecast, by Region 2019 & 2032
- Table 2: Global NA SSD Caching Market Revenue Million Forecast, by Application 2019 & 2032
- Table 3: Global NA SSD Caching Market Revenue Million Forecast, by Region 2019 & 2032
- Table 4: Global NA SSD Caching Market Revenue Million Forecast, by Country 2019 & 2032
- Table 5: United States NA SSD Caching Market Revenue (Million) Forecast, by Application 2019 & 2032
- Table 6: Canada NA SSD Caching Market Revenue (Million) Forecast, by Application 2019 & 2032
- Table 7: Global NA SSD Caching Market Revenue Million Forecast, by Country 2019 & 2032
- Table 8: Germany NA SSD Caching Market Revenue (Million) Forecast, by Application 2019 & 2032
- Table 9: United Kingdom NA SSD Caching Market Revenue (Million) Forecast, by Application 2019 & 2032
- Table 10: France NA SSD Caching Market Revenue (Million) Forecast, by Application 2019 & 2032
- Table 11: Rest of Europe NA SSD Caching Market Revenue (Million) Forecast, by Application 2019 & 2032
- Table 12: Global NA SSD Caching Market Revenue Million Forecast, by Country 2019 & 2032
- Table 13: China NA SSD Caching Market Revenue (Million) Forecast, by Application 2019 & 2032
- Table 14: Taiwan NA SSD Caching Market Revenue (Million) Forecast, by Application 2019 & 2032
- Table 15: South Korea NA SSD Caching Market Revenue (Million) Forecast, by Application 2019 & 2032
- Table 16: Rest of Asia Pacific NA SSD Caching Market Revenue (Million) Forecast, by Application 2019 & 2032
- Table 17: Global NA SSD Caching Market Revenue Million Forecast, by Country 2019 & 2032
- Table 18: NA SSD Caching Market Revenue (Million) Forecast, by Application 2019 & 2032
- Table 19: Global NA SSD Caching Market Revenue Million Forecast, by Application 2019 & 2032
- Table 20: Global NA SSD Caching Market Revenue Million Forecast, by Country 2019 & 2032
- Table 21: United States NA SSD Caching Market Revenue (Million) Forecast, by Application 2019 & 2032
- Table 22: Canada NA SSD Caching Market Revenue (Million) Forecast, by Application 2019 & 2032
- Table 23: Mexico NA SSD Caching Market Revenue (Million) Forecast, by Application 2019 & 2032
- Table 24: Global NA SSD Caching Market Revenue Million Forecast, by Application 2019 & 2032
- Table 25: Global NA SSD Caching Market Revenue Million Forecast, by Country 2019 & 2032
- Table 26: Brazil NA SSD Caching Market Revenue (Million) Forecast, by Application 2019 & 2032
- Table 27: Argentina NA SSD Caching Market Revenue (Million) Forecast, by Application 2019 & 2032
- Table 28: Rest of South America NA SSD Caching Market Revenue (Million) Forecast, by Application 2019 & 2032
- Table 29: Global NA SSD Caching Market Revenue Million Forecast, by Application 2019 & 2032
- Table 30: Global NA SSD Caching Market Revenue Million Forecast, by Country 2019 & 2032
- Table 31: United Kingdom NA SSD Caching Market Revenue (Million) Forecast, by Application 2019 & 2032
- Table 32: Germany NA SSD Caching Market Revenue (Million) Forecast, by Application 2019 & 2032
- Table 33: France NA SSD Caching Market Revenue (Million) Forecast, by Application 2019 & 2032
- Table 34: Italy NA SSD Caching Market Revenue (Million) Forecast, by Application 2019 & 2032
- Table 35: Spain NA SSD Caching Market Revenue (Million) Forecast, by Application 2019 & 2032
- Table 36: Russia NA SSD Caching Market Revenue (Million) Forecast, by Application 2019 & 2032
- Table 37: Benelux NA SSD Caching Market Revenue (Million) Forecast, by Application 2019 & 2032
- Table 38: Nordics NA SSD Caching Market Revenue (Million) Forecast, by Application 2019 & 2032
- Table 39: Rest of Europe NA SSD Caching Market Revenue (Million) Forecast, by Application 2019 & 2032
- Table 40: Global NA SSD Caching Market Revenue Million Forecast, by Application 2019 & 2032
- Table 41: Global NA SSD Caching Market Revenue Million Forecast, by Country 2019 & 2032
- Table 42: Turkey NA SSD Caching Market Revenue (Million) Forecast, by Application 2019 & 2032
- Table 43: Israel NA SSD Caching Market Revenue (Million) Forecast, by Application 2019 & 2032
- Table 44: GCC NA SSD Caching Market Revenue (Million) Forecast, by Application 2019 & 2032
- Table 45: North Africa NA SSD Caching Market Revenue (Million) Forecast, by Application 2019 & 2032
- Table 46: South Africa NA SSD Caching Market Revenue (Million) Forecast, by Application 2019 & 2032
- Table 47: Rest of Middle East & Africa NA SSD Caching Market Revenue (Million) Forecast, by Application 2019 & 2032
- Table 48: Global NA SSD Caching Market Revenue Million Forecast, by Application 2019 & 2032
- Table 49: Global NA SSD Caching Market Revenue Million Forecast, by Country 2019 & 2032
- Table 50: China NA SSD Caching Market Revenue (Million) Forecast, by Application 2019 & 2032
- Table 51: India NA SSD Caching Market Revenue (Million) Forecast, by Application 2019 & 2032
- Table 52: Japan NA SSD Caching Market Revenue (Million) Forecast, by Application 2019 & 2032
- Table 53: South Korea NA SSD Caching Market Revenue (Million) Forecast, by Application 2019 & 2032
- Table 54: ASEAN NA SSD Caching Market Revenue (Million) Forecast, by Application 2019 & 2032
- Table 55: Oceania NA SSD Caching Market Revenue (Million) Forecast, by Application 2019 & 2032
- Table 56: Rest of Asia Pacific NA SSD Caching Market Revenue (Million) Forecast, by Application 2019 & 2032
Frequently Asked Questions
1. What is the projected Compound Annual Growth Rate (CAGR) of the NA SSD Caching Market?
The projected CAGR is approximately 8.50%.
2. Which companies are prominent players in the NA SSD Caching Market?
Key companies in the market include Seagate Technology LLC, Microsemi (Microchip Technology Inc, Micron Technology Inc, Inspur Group, Samsung Electronics Co Ltd, Transcend Information Inc, Kioxia (Toshiba Memory Corporation), ADATA Technology Co Ltd, Western Digital Corporation, SK Hynix Inc, NetApp Inc, Intel Corporation, QNAP Systems Inc.
3. What are the main segments of the NA SSD Caching Market?
The market segments include Application.
4. Can you provide details about the market size?
The market size is estimated to be USD XX Million as of 2022.
5. What are some drivers contributing to market growth?
Improvements Offered by SSDs Over Conventional HDDs.
6. What are the notable trends driving market growth?
Enterprise Storage Expected to Hold Major Share.
7. Are there any restraints impacting market growth?
Slow Pace in Development of Applications Despite Heavy investments in R&D; Commplexities in Hardware Designing.
8. Can you provide examples of recent developments in the market?
March 2021 - A Solid State Drive (SSD) 670p has been released by Intel. The client SSD is a 144-layer quad-level cell-based device. The SSD can hold up to two terabytes of data in a single drive. According to Intel, SSDs can be used to supplement everyday computing needs and assist extreme gaming. When compared to the previous generation Intel QLC 3D NAND SSD, the new SSD 670p is said to give improved performance, including a 2-times sequential read and a 20% endurance boost. To meet normal processing demands, the Intel SSD 670p has been optimized for low queue depth and mixed workloads.
9. What pricing options are available for accessing the report?
Pricing options include single-user, multi-user, and enterprise licenses priced at USD 3800, USD 4500, and USD 5800 respectively.
10. Is the market size provided in terms of value or volume?
The market size is provided in terms of value, measured in Million.
11. Are there any specific market keywords associated with the report?
Yes, the market keyword associated with the report is "NA SSD Caching Market," which aids in identifying and referencing the specific market segment covered.
12. How do I determine which pricing option suits my needs best?
The pricing options vary based on user requirements and access needs. Individual users may opt for single-user licenses, while businesses requiring broader access may choose multi-user or enterprise licenses for cost-effective access to the report.
13. Are there any additional resources or data provided in the NA SSD Caching Market report?
While the report offers comprehensive insights, it's advisable to review the specific contents or supplementary materials provided to ascertain if additional resources or data are available.
14. How can I stay updated on further developments or reports in the NA SSD Caching Market?
To stay informed about further developments, trends, and reports in the NA SSD Caching Market, consider subscribing to industry newsletters, following relevant companies and organizations, or regularly checking reputable industry news sources and publications.
Methodology
Step 1 - Identification of Relevant Samples Size from Population Database


Step 2 - Approaches for Defining Global Market Size (Value, Volume* & Price*)

Note*: In applicable scenarios
Step 3 - Data Sources
Primary Research
- Web Analytics
- Survey Reports
- Research Institute
- Latest Research Reports
- Opinion Leaders
Secondary Research
- Annual Reports
- White Paper
- Latest Press Release
- Industry Association
- Paid Database
- Investor Presentations

Step 4 - Data Triangulation
Involves using different sources of information in order to increase the validity of a study
These sources are likely to be stakeholders in a program - participants, other researchers, program staff, other community members, and so on.
Then we put all data in single framework & apply various statistical tools to find out the dynamic on the market.
During the analysis stage, feedback from the stakeholder groups would be compared to determine areas of agreement as well as areas of divergence
