

Key Insights
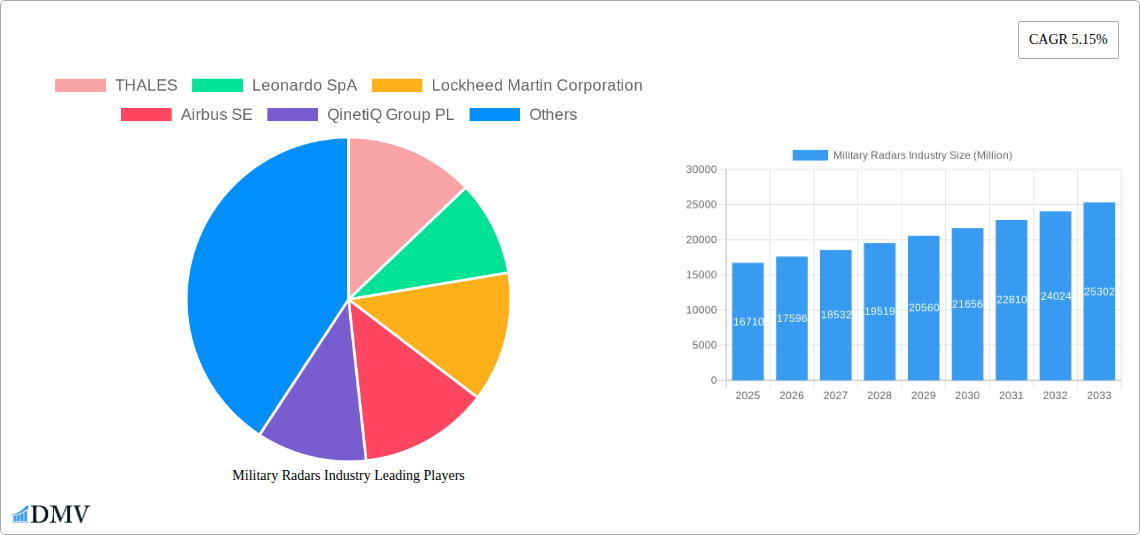
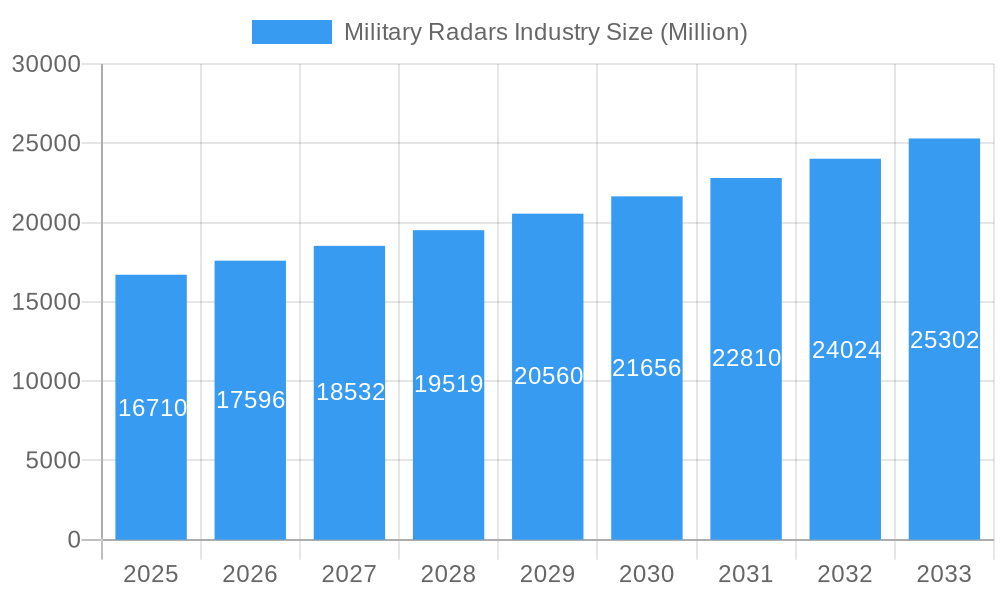
The military radar market, valued at $16.71 billion in 2025, is projected to experience robust growth, exhibiting a Compound Annual Growth Rate (CAGR) of 5.15% from 2025 to 2033. This expansion is fueled by several key drivers. Increasing geopolitical instability and the escalating need for advanced surveillance and defense systems are paramount. Modernization efforts by armed forces globally, coupled with the continuous development of sophisticated radar technologies like AESA (Active Electronically Scanned Array) radars, contribute significantly to market growth. Furthermore, the growing demand for improved situational awareness in both air and ground-based operations, along with the expanding application of radar systems in space-based defense, significantly impact market trajectory. Technological advancements, such as improved signal processing, miniaturization, and integration with other sensor systems, are creating new opportunities for innovation and deployment.
Military Radars Industry Market Size (In Billion)
However, certain restraints also exist. High initial investment costs associated with advanced radar systems can hinder market penetration, particularly in developing nations. The complex integration of various radar systems into existing defense infrastructure also presents challenges. Despite these limitations, the long-term prospects for the military radar market remain positive, driven by ongoing technological advancements, increasing defense budgets, and the rising need for enhanced security capabilities in various sectors, including air and missile defense, intelligence, surveillance, and reconnaissance (ISR), and navigation and weapon guidance. The market segmentation by platform (ground-based, naval, airborne, space) and application highlights the diverse deployment scenarios and functionalities of military radar systems. Major players like Thales, Leonardo SpA, and Lockheed Martin Corporation dominate the market, benefiting from strong technological expertise, extensive experience, and established supply chains. Regional market analysis indicates strong growth in North America and Asia-Pacific, driven by significant defense spending and robust technological development in these regions.
Military Radars Industry Company Market Share
Military Radars Industry Market Report: 2019-2033
This comprehensive report provides an in-depth analysis of the Military Radars Industry, offering invaluable insights for stakeholders seeking to navigate this dynamic market. The study period spans from 2019 to 2033, with 2025 serving as both the base and estimated year. The forecast period covers 2025-2033, while the historical period encompasses 2019-2024. The report meticulously analyzes market trends, technological advancements, competitive landscapes, and future opportunities, offering a 360-degree view of this crucial sector. Key players like Thales, Leonardo SpA, and Lockheed Martin are profiled, providing crucial competitive intelligence. The market is segmented by platform (ground-based, naval, airborne, space), application (air and missile defense, ISR, navigation, space situational awareness), and component (antennas, transmitters, receivers, etc.), delivering granular market understanding. The report projects a market value exceeding XX Million by 2033.
Military Radars Industry Market Composition & Trends
This section delves into the competitive dynamics of the Military Radars market, exploring market concentration, innovation drivers, regulatory frameworks, and substitute technologies. The analysis includes a detailed examination of mergers and acquisitions (M&A) activities, quantifying deal values and their impact on market share distribution. We assess the impact of evolving geopolitical landscapes and technological disruptions on market growth.
- Market Concentration: The Military Radars market exhibits a moderately concentrated structure, with the top five players—Thales, Leonardo SpA, Lockheed Martin Corporation, Airbus SE, and BAE Systems PLC—holding a combined market share of approximately 60% in 2024.
- Innovation Catalysts: Advancements in AESA (Active Electronically Scanned Array) technology, AI-powered signal processing, and miniaturization are key drivers of innovation.
- Regulatory Landscape: Stringent export controls and defense procurement regulations significantly impact market dynamics.
- Substitute Products: While limited, alternative surveillance technologies (e.g., satellite imagery) represent a partial substitute, albeit with limitations.
- End-User Profiles: The primary end-users include national armed forces, defense agencies, and allied nations.
- M&A Activities: Over the historical period (2019-2024), M&A activity totaled approximately $XX Million, primarily driven by consolidation efforts and technology acquisition.
Military Radars Industry Industry Evolution
This section examines the historical growth trajectory of the Military Radars industry and projects future expansion. Analysis includes technological breakthroughs, shifting consumer demands (e.g., increased focus on multi-domain operations), and their impact on market dynamics. The report quantifies growth rates and technology adoption trends using both historical and forecast data. The increased focus on network-centric warfare and the rising adoption of sophisticated sensor fusion techniques are shaping market evolution. Furthermore, the evolving threat landscape, characterized by asymmetric warfare and advanced anti-access/area denial (A2/AD) strategies, necessitates the development and deployment of advanced radar systems. The industry is witnessing a significant shift towards advanced technologies such as gallium nitride (GaN) based power amplifiers and digital beamforming techniques, leading to increased performance and improved cost efficiency. These advancements are leading to an increase in the demand for higher resolution and more accurate radar systems.
Leading Regions, Countries, or Segments in Military Radars Industry
This section pinpoints leading regions, countries, and market segments within the Military Radars industry. It provides an in-depth analysis of the factors contributing to their dominance.
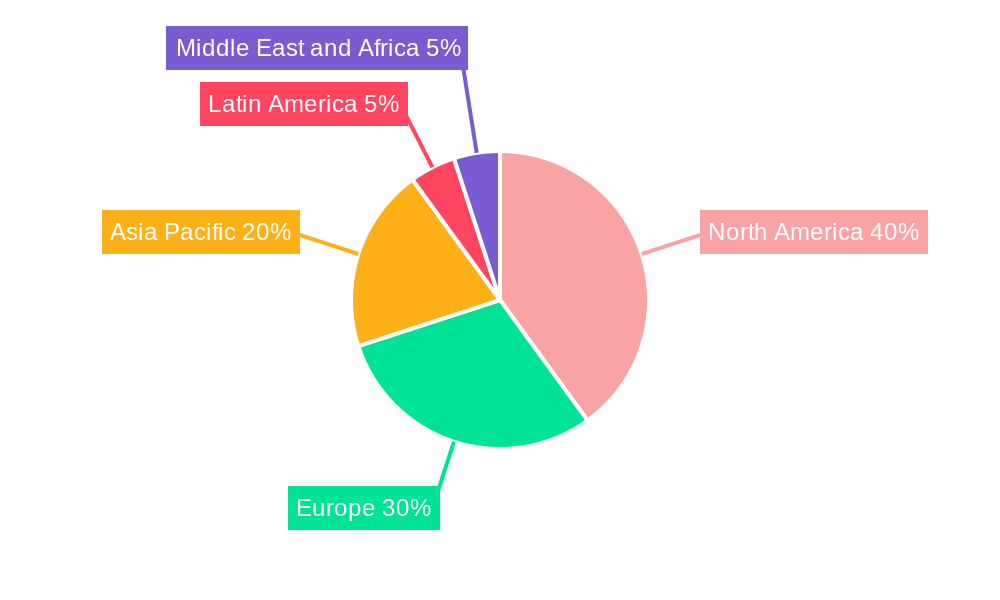
Dominant Regions/Countries: North America and Europe currently hold the largest market shares, driven by robust defense budgets, technological advancements, and established industry players. The Asia-Pacific region is projected to witness significant growth driven by increasing defense spending.
- Key Drivers:
- North America: High defense spending, technological leadership, and strong domestic industry.
- Europe: Significant defense budgets, collaborative defense initiatives, and technological expertise.
- Asia-Pacific: Rising defense budgets, modernization of armed forces, and geopolitical tensions.
Dominant Segments:
- Platform: Airborne radar systems dominate, driven by the need for enhanced situational awareness in aerial platforms. Naval radar systems also represent a significant segment, driven by the need for maritime surveillance and defense.
- Application: Air and Missile Defense systems constitute the largest application segment, followed by ISR and Navigation and Weapon Guidance systems.
- Component: Antennas and Digital Signal Processors represent significant market shares, reflecting the critical role they play in radar system performance.
Military Radars Industry Product Innovations
Recent innovations in Military Radars have focused on enhancing performance, reducing size and weight, and improving energy efficiency. The integration of AI and machine learning capabilities into radar systems is enabling advanced signal processing, target identification, and threat assessment. Miniaturized radar systems with enhanced capabilities are gaining traction, particularly in unmanned aerial vehicles (UAVs). The development of GaN-based power amplifiers has resulted in more efficient and powerful radar systems. These innovations offer unique selling propositions (USPs) such as improved accuracy, enhanced range, and superior target discrimination capabilities.
Propelling Factors for Military Radars Industry Growth
Several factors propel growth in the Military Radars industry. Firstly, geopolitical instability and heightened security concerns drive substantial investments in defense modernization. Secondly, advancements in technology, particularly AESA and software-defined radar systems, unlock new capabilities. Lastly, the increasing demand for enhanced situational awareness across diverse domains stimulates demand. These factors synergistically contribute to substantial market expansion.
Obstacles in the Military Radars Industry Market
The Military Radars market faces several challenges. Supply chain disruptions caused by geopolitical events can impact production and delivery timelines. Stringent export controls and regulatory hurdles increase complexity. Intense competition from established players and emerging entrants also impacts profitability. Furthermore, the high cost of advanced radar systems can limit adoption in budget-constrained environments. These factors cumulatively represent significant market restraints.
Future Opportunities in Military Radars Industry
Emerging opportunities abound. The integration of radar systems with other sensor modalities (e.g., electro-optical/infrared) creates enhanced situational awareness capabilities. The development of sophisticated countermeasures against advanced threats necessitates innovative radar designs. Expanding applications in space situational awareness and cybersecurity present lucrative market segments. Growth in unmanned and autonomous systems fuels further demand.
Major Players in the Military Radars Industry Ecosystem
Key Developments in Military Radars Industry Industry
- 2022 Q4: Lockheed Martin announced the successful completion of testing for its next-generation AESA radar system.
- 2023 Q1: Thales unveiled a new software-defined radar platform with advanced signal processing capabilities.
- 2023 Q3: Leonardo SpA and Airbus SE formed a strategic partnership to develop a joint radar system for future fighter jets. (Further details on specific mergers and acquisitions, including financial details, would be incorporated here in the full report).
Strategic Military Radars Industry Market Forecast
The Military Radars market is poised for substantial growth, driven by escalating geopolitical tensions, technological advancements, and increasing defense budgets globally. The market's future trajectory is closely linked to innovations in AESA technology, artificial intelligence-driven signal processing, and the continued adoption of miniaturized radar systems. Furthermore, new applications in space situational awareness, cybersecurity, and autonomous systems are expected to create significant opportunities. The projected market value demonstrates substantial growth potential.
Military Radars Industry Segmentation
- 1. Production Analysis
- 2. Consumption Analysis
- 3. Import Market Analysis (Value & Volume)
- 4. Export Market Analysis (Value & Volume)
- 5. Price Trend Analysis
Military Radars Industry Segmentation By Geography
-
1. North America
- 1.1. United States
- 1.2. Canada
- 1.3. Mexico
-
2. South America
- 2.1. Brazil
- 2.2. Argentina
- 2.3. Rest of South America
-
3. Europe
- 3.1. United Kingdom
- 3.2. Germany
- 3.3. France
- 3.4. Italy
- 3.5. Spain
- 3.6. Russia
- 3.7. Benelux
- 3.8. Nordics
- 3.9. Rest of Europe
-
4. Middle East & Africa
- 4.1. Turkey
- 4.2. Israel
- 4.3. GCC
- 4.4. North Africa
- 4.5. South Africa
- 4.6. Rest of Middle East & Africa
-
5. Asia Pacific
- 5.1. China
- 5.2. India
- 5.3. Japan
- 5.4. South Korea
- 5.5. ASEAN
- 5.6. Oceania
- 5.7. Rest of Asia Pacific
Military Radars Industry Regional Market Share
Geographic Coverage of Military Radars Industry
Military Radars Industry REPORT HIGHLIGHTS
| Aspects | Details |
|---|---|
| Study Period | 2020-2034 |
| Base Year | 2025 |
| Estimated Year | 2026 |
| Forecast Period | 2026-2034 |
| Historical Period | 2020-2025 |
| Growth Rate | CAGR of 5.15% from 2020-2034 |
| Segmentation |
|
Table of Contents
- 1. Introduction
- 1.1. Research Scope
- 1.2. Market Segmentation
- 1.3. Research Objective
- 1.4. Definitions and Assumptions
- 2. Executive Summary
- 2.1. Market Snapshot
- 3. Market Dynamics
- 3.1. Market Drivers
- 3.2. Market Restrains
- 3.3. Market Trends
- 3.4. Market Opportunities
- 4. Market Factor Analysis
- 4.1. Porters Five Forces
- 4.1.1. Bargaining Power of Suppliers
- 4.1.2. Bargaining Power of Buyers
- 4.1.3. Threat of New Entrants
- 4.1.4. Threat of Substitutes
- 4.1.5. Competitive Rivalry
- 4.2. PESTEL analysis
- 4.3. BCG Analysis
- 4.3.1. Stars (High Growth, High Market Share)
- 4.3.2. Cash Cows (Low Growth, High Market Share)
- 4.3.3. Question Mark (High Growth, Low Market Share)
- 4.3.4. Dogs (Low Growth, Low Market Share)
- 4.4. Ansoff Matrix Analysis
- 4.5. Supply Chain Analysis
- 4.6. Regulatory Landscape
- 4.7. Current Market Potential and Opportunity Assessment (TAM–SAM–SOM Framework)
- 4.8. DMV Analyst Note
- 4.1. Porters Five Forces
- 5. Market Analysis, Insights and Forecast 2021-2033
- 5.1. Market Analysis, Insights and Forecast - by Production Analysis
- 5.2. Market Analysis, Insights and Forecast - by Consumption Analysis
- 5.3. Market Analysis, Insights and Forecast - by Import Market Analysis (Value & Volume)
- 5.4. Market Analysis, Insights and Forecast - by Export Market Analysis (Value & Volume)
- 5.5. Market Analysis, Insights and Forecast - by Price Trend Analysis
- 5.6. Market Analysis, Insights and Forecast - by Region
- 5.6.1. North America
- 5.6.2. South America
- 5.6.3. Europe
- 5.6.4. Middle East & Africa
- 5.6.5. Asia Pacific
- 6. Global Military Radars Industry Analysis, Insights and Forecast, 2021-2033
- 6.1. Market Analysis, Insights and Forecast - by Production Analysis
- 6.2. Market Analysis, Insights and Forecast - by Consumption Analysis
- 6.3. Market Analysis, Insights and Forecast - by Import Market Analysis (Value & Volume)
- 6.4. Market Analysis, Insights and Forecast - by Export Market Analysis (Value & Volume)
- 6.5. Market Analysis, Insights and Forecast - by Price Trend Analysis
- 7. North America Military Radars Industry Analysis, Insights and Forecast, 2020-2032
- 7.1. Market Analysis, Insights and Forecast - by Production Analysis
- 7.2. Market Analysis, Insights and Forecast - by Consumption Analysis
- 7.3. Market Analysis, Insights and Forecast - by Import Market Analysis (Value & Volume)
- 7.4. Market Analysis, Insights and Forecast - by Export Market Analysis (Value & Volume)
- 7.5. Market Analysis, Insights and Forecast - by Price Trend Analysis
- 8. South America Military Radars Industry Analysis, Insights and Forecast, 2020-2032
- 8.1. Market Analysis, Insights and Forecast - by Production Analysis
- 8.2. Market Analysis, Insights and Forecast - by Consumption Analysis
- 8.3. Market Analysis, Insights and Forecast - by Import Market Analysis (Value & Volume)
- 8.4. Market Analysis, Insights and Forecast - by Export Market Analysis (Value & Volume)
- 8.5. Market Analysis, Insights and Forecast - by Price Trend Analysis
- 9. Europe Military Radars Industry Analysis, Insights and Forecast, 2020-2032
- 9.1. Market Analysis, Insights and Forecast - by Production Analysis
- 9.2. Market Analysis, Insights and Forecast - by Consumption Analysis
- 9.3. Market Analysis, Insights and Forecast - by Import Market Analysis (Value & Volume)
- 9.4. Market Analysis, Insights and Forecast - by Export Market Analysis (Value & Volume)
- 9.5. Market Analysis, Insights and Forecast - by Price Trend Analysis
- 10. Middle East & Africa Military Radars Industry Analysis, Insights and Forecast, 2020-2032
- 10.1. Market Analysis, Insights and Forecast - by Production Analysis
- 10.2. Market Analysis, Insights and Forecast - by Consumption Analysis
- 10.3. Market Analysis, Insights and Forecast - by Import Market Analysis (Value & Volume)
- 10.4. Market Analysis, Insights and Forecast - by Export Market Analysis (Value & Volume)
- 10.5. Market Analysis, Insights and Forecast - by Price Trend Analysis
- 11. Asia Pacific Military Radars Industry Analysis, Insights and Forecast, 2020-2032
- 11.1. Market Analysis, Insights and Forecast - by Production Analysis
- 11.2. Market Analysis, Insights and Forecast - by Consumption Analysis
- 11.3. Market Analysis, Insights and Forecast - by Import Market Analysis (Value & Volume)
- 11.4. Market Analysis, Insights and Forecast - by Export Market Analysis (Value & Volume)
- 11.5. Market Analysis, Insights and Forecast - by Price Trend Analysis
- 12. Competitive Analysis
- 12.1. Company Profiles
- 12.1.1 THALES
- 12.1.1.1. Company Overview
- 12.1.1.2. Products
- 12.1.1.3. Company Financials
- 12.1.1.4. SWOT Analysis
- 12.1.2 Leonardo SpA
- 12.1.2.1. Company Overview
- 12.1.2.2. Products
- 12.1.2.3. Company Financials
- 12.1.2.4. SWOT Analysis
- 12.1.3 Lockheed Martin Corporation
- 12.1.3.1. Company Overview
- 12.1.3.2. Products
- 12.1.3.3. Company Financials
- 12.1.3.4. SWOT Analysis
- 12.1.4 Airbus SE
- 12.1.4.1. Company Overview
- 12.1.4.2. Products
- 12.1.4.3. Company Financials
- 12.1.4.4. SWOT Analysis
- 12.1.5 QinetiQ Group PL
- 12.1.5.1. Company Overview
- 12.1.5.2. Products
- 12.1.5.3. Company Financials
- 12.1.5.4. SWOT Analysis
- 12.1.6 Teledyne Technologies Incorporated
- 12.1.6.1. Company Overview
- 12.1.6.2. Products
- 12.1.6.3. Company Financials
- 12.1.6.4. SWOT Analysis
- 12.1.7 BAE Systems PLC
- 12.1.7.1. Company Overview
- 12.1.7.2. Products
- 12.1.7.3. Company Financials
- 12.1.7.4. SWOT Analysis
- 12.1.8 RTX Corporation
- 12.1.8.1. Company Overview
- 12.1.8.2. Products
- 12.1.8.3. Company Financials
- 12.1.8.4. SWOT Analysis
- 12.1.9 HENSOLDT Holding Germany GmbH
- 12.1.9.1. Company Overview
- 12.1.9.2. Products
- 12.1.9.3. Company Financials
- 12.1.9.4. SWOT Analysis
- 12.1.10 Israel Aerospace Industries Ltd
- 12.1.10.1. Company Overview
- 12.1.10.2. Products
- 12.1.10.3. Company Financials
- 12.1.10.4. SWOT Analysis
- 12.1.11 Northrop Grumman Corporation
- 12.1.11.1. Company Overview
- 12.1.11.2. Products
- 12.1.11.3. Company Financials
- 12.1.11.4. SWOT Analysis
- 12.1.12 Saab AB
- 12.1.12.1. Company Overview
- 12.1.12.2. Products
- 12.1.12.3. Company Financials
- 12.1.12.4. SWOT Analysis
- 12.1.1 THALES
- 12.2. Market Entropy
- 12.2.1 Company's Key Areas Served
- 12.2.2 Recent Developments
- 12.3. Company Market Share Analysis 2025
- 12.3.1 Top 5 Companies Market Share Analysis
- 12.3.2 Top 3 Companies Market Share Analysis
- 12.4. List of Potential Customers
- 13. Research Methodology
List of Figures
- Figure 1: Global Military Radars Industry Revenue Breakdown (Million, %) by Region 2025 & 2033
- Figure 2: North America Military Radars Industry Revenue (Million), by Production Analysis 2025 & 2033
- Figure 3: North America Military Radars Industry Revenue Share (%), by Production Analysis 2025 & 2033
- Figure 4: North America Military Radars Industry Revenue (Million), by Consumption Analysis 2025 & 2033
- Figure 5: North America Military Radars Industry Revenue Share (%), by Consumption Analysis 2025 & 2033
- Figure 6: North America Military Radars Industry Revenue (Million), by Import Market Analysis (Value & Volume) 2025 & 2033
- Figure 7: North America Military Radars Industry Revenue Share (%), by Import Market Analysis (Value & Volume) 2025 & 2033
- Figure 8: North America Military Radars Industry Revenue (Million), by Export Market Analysis (Value & Volume) 2025 & 2033
- Figure 9: North America Military Radars Industry Revenue Share (%), by Export Market Analysis (Value & Volume) 2025 & 2033
- Figure 10: North America Military Radars Industry Revenue (Million), by Price Trend Analysis 2025 & 2033
- Figure 11: North America Military Radars Industry Revenue Share (%), by Price Trend Analysis 2025 & 2033
- Figure 12: North America Military Radars Industry Revenue (Million), by Country 2025 & 2033
- Figure 13: North America Military Radars Industry Revenue Share (%), by Country 2025 & 2033
- Figure 14: South America Military Radars Industry Revenue (Million), by Production Analysis 2025 & 2033
- Figure 15: South America Military Radars Industry Revenue Share (%), by Production Analysis 2025 & 2033
- Figure 16: South America Military Radars Industry Revenue (Million), by Consumption Analysis 2025 & 2033
- Figure 17: South America Military Radars Industry Revenue Share (%), by Consumption Analysis 2025 & 2033
- Figure 18: South America Military Radars Industry Revenue (Million), by Import Market Analysis (Value & Volume) 2025 & 2033
- Figure 19: South America Military Radars Industry Revenue Share (%), by Import Market Analysis (Value & Volume) 2025 & 2033
- Figure 20: South America Military Radars Industry Revenue (Million), by Export Market Analysis (Value & Volume) 2025 & 2033
- Figure 21: South America Military Radars Industry Revenue Share (%), by Export Market Analysis (Value & Volume) 2025 & 2033
- Figure 22: South America Military Radars Industry Revenue (Million), by Price Trend Analysis 2025 & 2033
- Figure 23: South America Military Radars Industry Revenue Share (%), by Price Trend Analysis 2025 & 2033
- Figure 24: South America Military Radars Industry Revenue (Million), by Country 2025 & 2033
- Figure 25: South America Military Radars Industry Revenue Share (%), by Country 2025 & 2033
- Figure 26: Europe Military Radars Industry Revenue (Million), by Production Analysis 2025 & 2033
- Figure 27: Europe Military Radars Industry Revenue Share (%), by Production Analysis 2025 & 2033
- Figure 28: Europe Military Radars Industry Revenue (Million), by Consumption Analysis 2025 & 2033
- Figure 29: Europe Military Radars Industry Revenue Share (%), by Consumption Analysis 2025 & 2033
- Figure 30: Europe Military Radars Industry Revenue (Million), by Import Market Analysis (Value & Volume) 2025 & 2033
- Figure 31: Europe Military Radars Industry Revenue Share (%), by Import Market Analysis (Value & Volume) 2025 & 2033
- Figure 32: Europe Military Radars Industry Revenue (Million), by Export Market Analysis (Value & Volume) 2025 & 2033
- Figure 33: Europe Military Radars Industry Revenue Share (%), by Export Market Analysis (Value & Volume) 2025 & 2033
- Figure 34: Europe Military Radars Industry Revenue (Million), by Price Trend Analysis 2025 & 2033
- Figure 35: Europe Military Radars Industry Revenue Share (%), by Price Trend Analysis 2025 & 2033
- Figure 36: Europe Military Radars Industry Revenue (Million), by Country 2025 & 2033
- Figure 37: Europe Military Radars Industry Revenue Share (%), by Country 2025 & 2033
- Figure 38: Middle East & Africa Military Radars Industry Revenue (Million), by Production Analysis 2025 & 2033
- Figure 39: Middle East & Africa Military Radars Industry Revenue Share (%), by Production Analysis 2025 & 2033
- Figure 40: Middle East & Africa Military Radars Industry Revenue (Million), by Consumption Analysis 2025 & 2033
- Figure 41: Middle East & Africa Military Radars Industry Revenue Share (%), by Consumption Analysis 2025 & 2033
- Figure 42: Middle East & Africa Military Radars Industry Revenue (Million), by Import Market Analysis (Value & Volume) 2025 & 2033
- Figure 43: Middle East & Africa Military Radars Industry Revenue Share (%), by Import Market Analysis (Value & Volume) 2025 & 2033
- Figure 44: Middle East & Africa Military Radars Industry Revenue (Million), by Export Market Analysis (Value & Volume) 2025 & 2033
- Figure 45: Middle East & Africa Military Radars Industry Revenue Share (%), by Export Market Analysis (Value & Volume) 2025 & 2033
- Figure 46: Middle East & Africa Military Radars Industry Revenue (Million), by Price Trend Analysis 2025 & 2033
- Figure 47: Middle East & Africa Military Radars Industry Revenue Share (%), by Price Trend Analysis 2025 & 2033
- Figure 48: Middle East & Africa Military Radars Industry Revenue (Million), by Country 2025 & 2033
- Figure 49: Middle East & Africa Military Radars Industry Revenue Share (%), by Country 2025 & 2033
- Figure 50: Asia Pacific Military Radars Industry Revenue (Million), by Production Analysis 2025 & 2033
- Figure 51: Asia Pacific Military Radars Industry Revenue Share (%), by Production Analysis 2025 & 2033
- Figure 52: Asia Pacific Military Radars Industry Revenue (Million), by Consumption Analysis 2025 & 2033
- Figure 53: Asia Pacific Military Radars Industry Revenue Share (%), by Consumption Analysis 2025 & 2033
- Figure 54: Asia Pacific Military Radars Industry Revenue (Million), by Import Market Analysis (Value & Volume) 2025 & 2033
- Figure 55: Asia Pacific Military Radars Industry Revenue Share (%), by Import Market Analysis (Value & Volume) 2025 & 2033
- Figure 56: Asia Pacific Military Radars Industry Revenue (Million), by Export Market Analysis (Value & Volume) 2025 & 2033
- Figure 57: Asia Pacific Military Radars Industry Revenue Share (%), by Export Market Analysis (Value & Volume) 2025 & 2033
- Figure 58: Asia Pacific Military Radars Industry Revenue (Million), by Price Trend Analysis 2025 & 2033
- Figure 59: Asia Pacific Military Radars Industry Revenue Share (%), by Price Trend Analysis 2025 & 2033
- Figure 60: Asia Pacific Military Radars Industry Revenue (Million), by Country 2025 & 2033
- Figure 61: Asia Pacific Military Radars Industry Revenue Share (%), by Country 2025 & 2033
List of Tables
- Table 1: Global Military Radars Industry Revenue Million Forecast, by Production Analysis 2020 & 2033
- Table 2: Global Military Radars Industry Revenue Million Forecast, by Consumption Analysis 2020 & 2033
- Table 3: Global Military Radars Industry Revenue Million Forecast, by Import Market Analysis (Value & Volume) 2020 & 2033
- Table 4: Global Military Radars Industry Revenue Million Forecast, by Export Market Analysis (Value & Volume) 2020 & 2033
- Table 5: Global Military Radars Industry Revenue Million Forecast, by Price Trend Analysis 2020 & 2033
- Table 6: Global Military Radars Industry Revenue Million Forecast, by Region 2020 & 2033
- Table 7: Global Military Radars Industry Revenue Million Forecast, by Production Analysis 2020 & 2033
- Table 8: Global Military Radars Industry Revenue Million Forecast, by Consumption Analysis 2020 & 2033
- Table 9: Global Military Radars Industry Revenue Million Forecast, by Import Market Analysis (Value & Volume) 2020 & 2033
- Table 10: Global Military Radars Industry Revenue Million Forecast, by Export Market Analysis (Value & Volume) 2020 & 2033
- Table 11: Global Military Radars Industry Revenue Million Forecast, by Price Trend Analysis 2020 & 2033
- Table 12: Global Military Radars Industry Revenue Million Forecast, by Country 2020 & 2033
- Table 13: United States Military Radars Industry Revenue (Million) Forecast, by Application 2020 & 2033
- Table 14: Canada Military Radars Industry Revenue (Million) Forecast, by Application 2020 & 2033
- Table 15: Mexico Military Radars Industry Revenue (Million) Forecast, by Application 2020 & 2033
- Table 16: Global Military Radars Industry Revenue Million Forecast, by Production Analysis 2020 & 2033
- Table 17: Global Military Radars Industry Revenue Million Forecast, by Consumption Analysis 2020 & 2033
- Table 18: Global Military Radars Industry Revenue Million Forecast, by Import Market Analysis (Value & Volume) 2020 & 2033
- Table 19: Global Military Radars Industry Revenue Million Forecast, by Export Market Analysis (Value & Volume) 2020 & 2033
- Table 20: Global Military Radars Industry Revenue Million Forecast, by Price Trend Analysis 2020 & 2033
- Table 21: Global Military Radars Industry Revenue Million Forecast, by Country 2020 & 2033
- Table 22: Brazil Military Radars Industry Revenue (Million) Forecast, by Application 2020 & 2033
- Table 23: Argentina Military Radars Industry Revenue (Million) Forecast, by Application 2020 & 2033
- Table 24: Rest of South America Military Radars Industry Revenue (Million) Forecast, by Application 2020 & 2033
- Table 25: Global Military Radars Industry Revenue Million Forecast, by Production Analysis 2020 & 2033
- Table 26: Global Military Radars Industry Revenue Million Forecast, by Consumption Analysis 2020 & 2033
- Table 27: Global Military Radars Industry Revenue Million Forecast, by Import Market Analysis (Value & Volume) 2020 & 2033
- Table 28: Global Military Radars Industry Revenue Million Forecast, by Export Market Analysis (Value & Volume) 2020 & 2033
- Table 29: Global Military Radars Industry Revenue Million Forecast, by Price Trend Analysis 2020 & 2033
- Table 30: Global Military Radars Industry Revenue Million Forecast, by Country 2020 & 2033
- Table 31: United Kingdom Military Radars Industry Revenue (Million) Forecast, by Application 2020 & 2033
- Table 32: Germany Military Radars Industry Revenue (Million) Forecast, by Application 2020 & 2033
- Table 33: France Military Radars Industry Revenue (Million) Forecast, by Application 2020 & 2033
- Table 34: Italy Military Radars Industry Revenue (Million) Forecast, by Application 2020 & 2033
- Table 35: Spain Military Radars Industry Revenue (Million) Forecast, by Application 2020 & 2033
- Table 36: Russia Military Radars Industry Revenue (Million) Forecast, by Application 2020 & 2033
- Table 37: Benelux Military Radars Industry Revenue (Million) Forecast, by Application 2020 & 2033
- Table 38: Nordics Military Radars Industry Revenue (Million) Forecast, by Application 2020 & 2033
- Table 39: Rest of Europe Military Radars Industry Revenue (Million) Forecast, by Application 2020 & 2033
- Table 40: Global Military Radars Industry Revenue Million Forecast, by Production Analysis 2020 & 2033
- Table 41: Global Military Radars Industry Revenue Million Forecast, by Consumption Analysis 2020 & 2033
- Table 42: Global Military Radars Industry Revenue Million Forecast, by Import Market Analysis (Value & Volume) 2020 & 2033
- Table 43: Global Military Radars Industry Revenue Million Forecast, by Export Market Analysis (Value & Volume) 2020 & 2033
- Table 44: Global Military Radars Industry Revenue Million Forecast, by Price Trend Analysis 2020 & 2033
- Table 45: Global Military Radars Industry Revenue Million Forecast, by Country 2020 & 2033
- Table 46: Turkey Military Radars Industry Revenue (Million) Forecast, by Application 2020 & 2033
- Table 47: Israel Military Radars Industry Revenue (Million) Forecast, by Application 2020 & 2033
- Table 48: GCC Military Radars Industry Revenue (Million) Forecast, by Application 2020 & 2033
- Table 49: North Africa Military Radars Industry Revenue (Million) Forecast, by Application 2020 & 2033
- Table 50: South Africa Military Radars Industry Revenue (Million) Forecast, by Application 2020 & 2033
- Table 51: Rest of Middle East & Africa Military Radars Industry Revenue (Million) Forecast, by Application 2020 & 2033
- Table 52: Global Military Radars Industry Revenue Million Forecast, by Production Analysis 2020 & 2033
- Table 53: Global Military Radars Industry Revenue Million Forecast, by Consumption Analysis 2020 & 2033
- Table 54: Global Military Radars Industry Revenue Million Forecast, by Import Market Analysis (Value & Volume) 2020 & 2033
- Table 55: Global Military Radars Industry Revenue Million Forecast, by Export Market Analysis (Value & Volume) 2020 & 2033
- Table 56: Global Military Radars Industry Revenue Million Forecast, by Price Trend Analysis 2020 & 2033
- Table 57: Global Military Radars Industry Revenue Million Forecast, by Country 2020 & 2033
- Table 58: China Military Radars Industry Revenue (Million) Forecast, by Application 2020 & 2033
- Table 59: India Military Radars Industry Revenue (Million) Forecast, by Application 2020 & 2033
- Table 60: Japan Military Radars Industry Revenue (Million) Forecast, by Application 2020 & 2033
- Table 61: South Korea Military Radars Industry Revenue (Million) Forecast, by Application 2020 & 2033
- Table 62: ASEAN Military Radars Industry Revenue (Million) Forecast, by Application 2020 & 2033
- Table 63: Oceania Military Radars Industry Revenue (Million) Forecast, by Application 2020 & 2033
- Table 64: Rest of Asia Pacific Military Radars Industry Revenue (Million) Forecast, by Application 2020 & 2033
Frequently Asked Questions
1. What is the projected Compound Annual Growth Rate (CAGR) of the Military Radars Industry?
The projected CAGR is approximately 5.15%.
2. Which companies are prominent players in the Military Radars Industry?
Key companies in the market include THALES, Leonardo SpA, Lockheed Martin Corporation, Airbus SE, QinetiQ Group PL, Teledyne Technologies Incorporated, BAE Systems PLC, RTX Corporation, HENSOLDT Holding Germany GmbH, Israel Aerospace Industries Ltd, Northrop Grumman Corporation, Saab AB.
3. What are the main segments of the Military Radars Industry?
The market segments include Production Analysis, Consumption Analysis, Import Market Analysis (Value & Volume), Export Market Analysis (Value & Volume), Price Trend Analysis.
4. Can you provide details about the market size?
The market size is estimated to be USD 16.71 Million as of 2022.
5. What are some drivers contributing to market growth?
Increase in Internet of Things (IoT) and Autonomous Systems; Rise in Demand for Military and Defense Satellite Communication Solutions.
6. What are the notable trends driving market growth?
Airborne Segment Expected to Register the Highest CAGR During the Forecast Period.
7. Are there any restraints impacting market growth?
Cybersecurity Threats to Satellite Communication; Interference in Transmission of Data.
8. Can you provide examples of recent developments in the market?
N/A
9. What pricing options are available for accessing the report?
Pricing options include single-user, multi-user, and enterprise licenses priced at USD 4750, USD 5250, and USD 8750 respectively.
10. Is the market size provided in terms of value or volume?
The market size is provided in terms of value, measured in Million.
11. Are there any specific market keywords associated with the report?
Yes, the market keyword associated with the report is "Military Radars Industry," which aids in identifying and referencing the specific market segment covered.
12. How do I determine which pricing option suits my needs best?
The pricing options vary based on user requirements and access needs. Individual users may opt for single-user licenses, while businesses requiring broader access may choose multi-user or enterprise licenses for cost-effective access to the report.
13. Are there any additional resources or data provided in the Military Radars Industry report?
While the report offers comprehensive insights, it's advisable to review the specific contents or supplementary materials provided to ascertain if additional resources or data are available.
14. How can I stay updated on further developments or reports in the Military Radars Industry?
To stay informed about further developments, trends, and reports in the Military Radars Industry, consider subscribing to industry newsletters, following relevant companies and organizations, or regularly checking reputable industry news sources and publications.
Methodology
Step 1 - Identification of Relevant Samples Size from Population Database


Step 2 - Approaches for Defining Global Market Size (Value, Volume* & Price*)

Note*: In applicable scenarios
Step 3 - Data Sources
Primary Research
- Web Analytics
- Survey Reports
- Research Institute
- Latest Research Reports
- Opinion Leaders
Secondary Research
- Annual Reports
- White Paper
- Latest Press Release
- Industry Association
- Paid Database
- Investor Presentations

Step 4 - Data Triangulation
Involves using different sources of information in order to increase the validity of a study
These sources are likely to be stakeholders in a program - participants, other researchers, program staff, other community members, and so on.
Then we put all data in single framework & apply various statistical tools to find out the dynamic on the market.
During the analysis stage, feedback from the stakeholder groups would be compared to determine areas of agreement as well as areas of divergence