

Key Insights
The global liquid filter bag market, estimated at $8.5 billion in 2025, is poised for substantial expansion. Projections indicate a Compound Annual Growth Rate (CAGR) of 6%, driven by increasing industrial adoption and stringent environmental mandates. Enhanced demand in sectors such as water treatment, chemical processing, and food & beverage manufacturing is a primary growth catalyst. Innovations in filter bag materials, improving durability and filtration efficacy, are also fueling market advancement. Key market players include industry leaders like Parker Hannifin, Eaton, and Donaldson, alongside agile, specialized manufacturers focused on meeting evolving customer requirements.
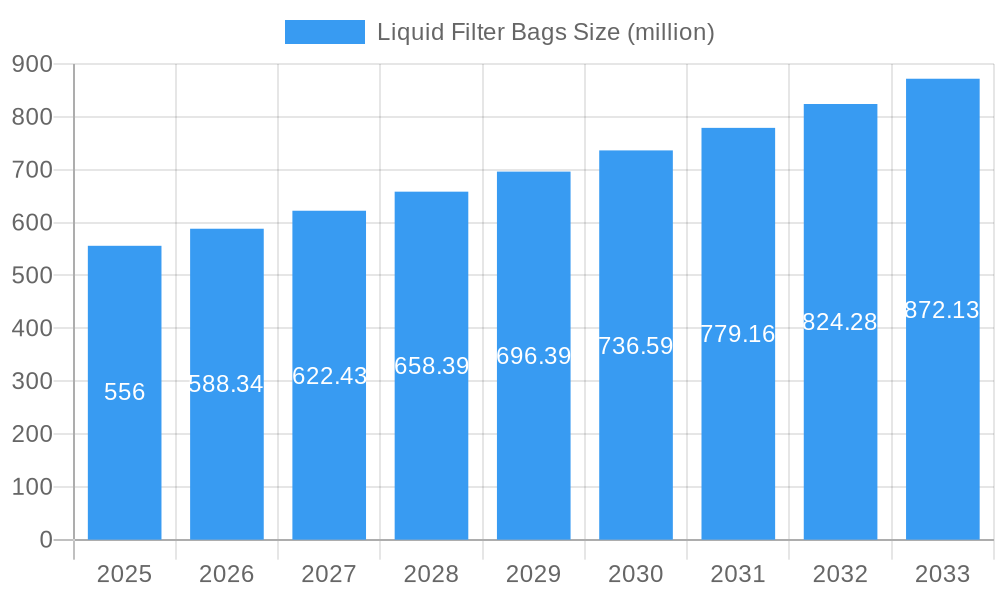
Liquid Filter Bags Market Size (In Billion)
Market segmentation is anticipated across filter bag materials (polypropylene, polyester, nylon), pore sizes, and specific applications. Growth trajectories are expected to vary regionally, with developing economies exhibiting higher demand due to infrastructure expansion and industrialization. The forecast period through 2033 presents significant opportunities for companies developing sustainable, high-performance liquid filter bag solutions. Strategic collaborations, mergers, acquisitions, and ongoing product innovation will be vital for maintaining a competitive advantage in this evolving market.
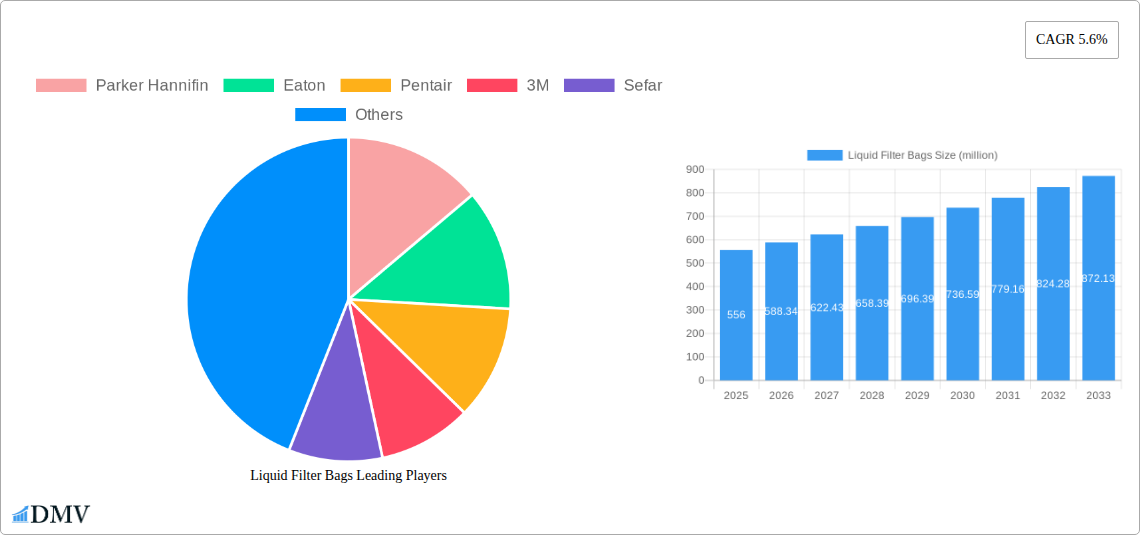
Liquid Filter Bags Company Market Share
Liquid Filter Bags Market Report: A Comprehensive Analysis (2019-2033)
This insightful report provides a comprehensive analysis of the global Liquid Filter Bags market, projecting a market value exceeding $XX million by 2033. The study covers the period from 2019 to 2033, with a base year of 2025 and a forecast period from 2025 to 2033. This detailed examination incorporates historical data (2019-2024) to offer invaluable insights for stakeholders, investors, and industry professionals seeking to navigate this dynamic market.
Liquid Filter Bags Market Composition & Trends
The global liquid filter bags market is characterized by a moderately concentrated landscape, with key players like Parker Hannifin, Eaton, and 3M holding significant market share. However, several smaller, specialized players contribute to a dynamic competitive environment. The market's growth is fueled by innovation in filter media materials (e.g., advancements in nanotechnology), stringent environmental regulations driving demand for cleaner processes across industries, and increasing awareness of filtration's role in optimizing production efficiency. Substitute products, such as cartridge filters, present competitive challenges but are often outweighed by the cost-effectiveness and ease of handling offered by liquid filter bags.
Market Share Distribution (Estimated 2025):
- Parker Hannifin: xx%
- Eaton: xx%
- 3M: xx%
- Others: xx%
Mergers & Acquisitions (M&A) Activity (2019-2024):
- Total M&A deal value: Approximately $XX million
- Significant deals involved consolidation of smaller players by larger corporations to enhance market reach and technological capabilities.
End-User Profiles: The market caters to a diverse range of end-users, including food & beverage, pharmaceuticals, chemicals, and water treatment. The demand varies significantly across these sectors based on specific regulatory requirements and application needs.
Liquid Filter Bags Industry Evolution
The liquid filter bags market has experienced a steady growth trajectory over the past decade, driven primarily by escalating demand from various industries. From 2019 to 2024, the Compound Annual Growth Rate (CAGR) was estimated at xx%, reaching a market value of $XX million in 2024. Technological advancements, particularly in filter media materials and bag design, have contributed significantly to improved filtration efficiency, reduced operational costs, and enhanced sustainability. Consumer demand is shifting toward more sustainable and cost-effective solutions, stimulating the development of biodegradable filter bags and improved recycling mechanisms. The forecast period (2025-2033) anticipates continued growth, with a projected CAGR of xx%, reaching a market size exceeding $XX million by 2033. This projection incorporates factors like rising industrialization in emerging economies and the growing focus on environmental protection. Further growth is anticipated through the increased adoption of automated filter bag change systems, improving overall efficiency and reducing downtime.
Leading Regions, Countries, or Segments in Liquid Filter Bags
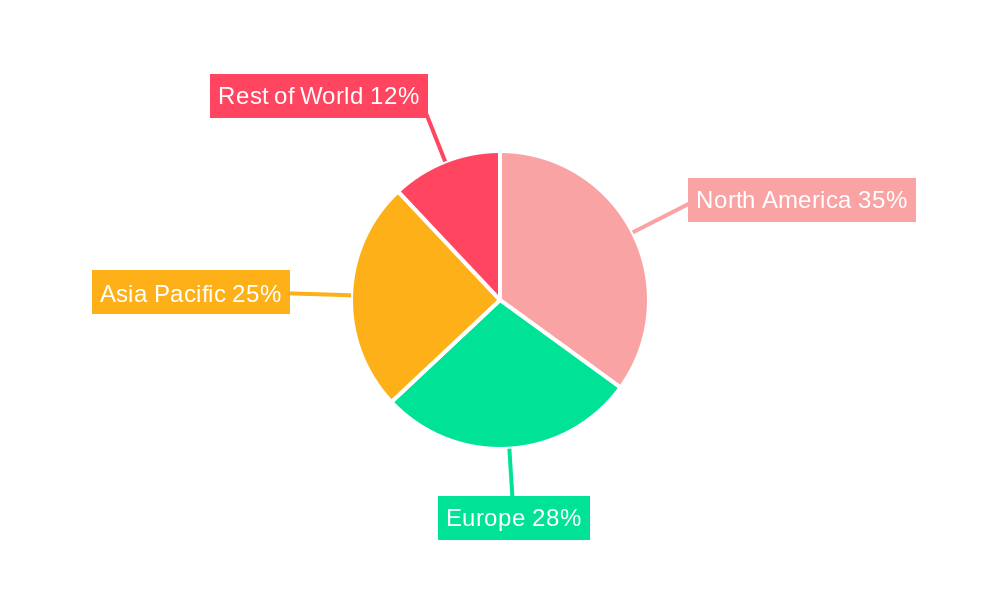
North America currently dominates the liquid filter bags market, driven by robust industrial activity, stringent environmental regulations, and a high concentration of major players.
Key Drivers for North American Dominance:
- High investment in manufacturing and industrial processes.
- Stringent environmental regulations promoting efficient filtration technologies.
- Established presence of major filter bag manufacturers.
Other significant regions: Europe and Asia Pacific are experiencing substantial growth, propelled by expanding manufacturing sectors and rising environmental awareness. However, variations exist across segments; for example, the pharmaceutical segment in Europe demands high-quality filter bags with stringent regulatory compliance.
Liquid Filter Bags Product Innovations
Recent innovations include the development of self-cleaning filter bags, which minimize downtime by reducing the frequency of manual bag changes. The use of advanced filter media materials, such as nanofibers and electrospun membranes, enables improved filtration efficiency, longer service life, and enhanced particle removal. These innovations are further complemented by the implementation of smart sensors integrated into filter bags to monitor pressure drop and predict maintenance needs, preventing operational disruptions.
Propelling Factors for Liquid Filter Bags Growth
Several factors contribute to the market's growth: stringent environmental regulations worldwide necessitate advanced filtration solutions; rising industrial activity drives demand for efficient and cost-effective filtration processes; and advancements in material science offer high-performance filter media with enhanced efficiency and durability. Government initiatives promoting cleaner production practices also significantly drive adoption.
Obstacles in the Liquid Filter Bags Market
The market faces challenges such as raw material price fluctuations, which impact production costs and pricing strategies. Global supply chain disruptions can lead to production delays and shortages. Intense competition among established and emerging players necessitates continuous innovation and cost optimization to maintain a competitive edge. Furthermore, fluctuating oil prices, a key component in some filter media manufacturing, impact overall market dynamics.
Future Opportunities in Liquid Filter Bags
Emerging opportunities exist in developing economies with growing industrialization and improving environmental standards. Advancements in smart filtration technologies, such as sensors and data analytics integration, will enhance monitoring and maintenance capabilities. The development of sustainable and biodegradable filter bags caters to increasing environmental consciousness and reduces disposal challenges.
Major Players in the Liquid Filter Bags Ecosystem
- Parker Hannifin
- Eaton
- Pentair
- 3M
- Sefar
- AJR Filtration
- Amazon Filters
- Filtration Group
- Knight Corporation
- Strainrite
- Donaldson
- Allied Filter Systems
- Critical Process Filtration
- Harmsco
- HL Filter
- Universal Filtration
- Industrial Filter Manufacturing (IFM)
- Hlvleey
Key Developments in Liquid Filter Bags Industry
- 2022 Q3: 3M launched a new line of high-efficiency liquid filter bags with improved particle retention.
- 2023 Q1: Parker Hannifin acquired a smaller filter bag manufacturer, expanding its product portfolio.
- 2024 Q2: New environmental regulations in the EU impacted the material composition of liquid filter bags.
Strategic Liquid Filter Bags Market Forecast
The liquid filter bags market is poised for significant growth in the coming years, driven by technological advancements, increasing industrial activity, and a growing emphasis on environmental sustainability. The forecast suggests a substantial increase in market size, exceeding $XX million by 2033. This growth will be further amplified by increased adoption in emerging markets and the development of innovative, high-performance filter bag solutions.
Liquid Filter Bags Segmentation
-
1. Application
- 1.1. Chemical Industry
- 1.2. Food and Beverages
- 1.3. Pharmaceuticals
- 1.4. Water & Wastewater
- 1.5. Inks, Paints, Coatings
- 1.6. Others
-
2. Types
- 2.1. Polyester Filter Bags
- 2.2. Polypropylene Filter Bags
- 2.3. Nylon Filter Bags
- 2.4. Aramid Filter Bags
- 2.5. Others
Liquid Filter Bags Segmentation By Geography
-
1. North America
- 1.1. United States
- 1.2. Canada
- 1.3. Mexico
-
2. South America
- 2.1. Brazil
- 2.2. Argentina
- 2.3. Rest of South America
-
3. Europe
- 3.1. United Kingdom
- 3.2. Germany
- 3.3. France
- 3.4. Italy
- 3.5. Spain
- 3.6. Russia
- 3.7. Benelux
- 3.8. Nordics
- 3.9. Rest of Europe
-
4. Middle East & Africa
- 4.1. Turkey
- 4.2. Israel
- 4.3. GCC
- 4.4. North Africa
- 4.5. South Africa
- 4.6. Rest of Middle East & Africa
-
5. Asia Pacific
- 5.1. China
- 5.2. India
- 5.3. Japan
- 5.4. South Korea
- 5.5. ASEAN
- 5.6. Oceania
- 5.7. Rest of Asia Pacific
Liquid Filter Bags Regional Market Share
Geographic Coverage of Liquid Filter Bags
Liquid Filter Bags REPORT HIGHLIGHTS
| Aspects | Details |
|---|---|
| Study Period | 2020-2034 |
| Base Year | 2025 |
| Estimated Year | 2026 |
| Forecast Period | 2026-2034 |
| Historical Period | 2020-2025 |
| Growth Rate | CAGR of 6% from 2020-2034 |
| Segmentation |
|
Table of Contents
- 1. Introduction
- 1.1. Research Scope
- 1.2. Market Segmentation
- 1.3. Research Methodology
- 1.4. Definitions and Assumptions
- 2. Executive Summary
- 2.1. Introduction
- 3. Market Dynamics
- 3.1. Introduction
- 3.2. Market Drivers
- 3.3. Market Restrains
- 3.4. Market Trends
- 4. Market Factor Analysis
- 4.1. Porters Five Forces
- 4.2. Supply/Value Chain
- 4.3. PESTEL analysis
- 4.4. Market Entropy
- 4.5. Patent/Trademark Analysis
- 5. Global Liquid Filter Bags Analysis, Insights and Forecast, 2020-2032
- 5.1. Market Analysis, Insights and Forecast - by Application
- 5.1.1. Chemical Industry
- 5.1.2. Food and Beverages
- 5.1.3. Pharmaceuticals
- 5.1.4. Water & Wastewater
- 5.1.5. Inks, Paints, Coatings
- 5.1.6. Others
- 5.2. Market Analysis, Insights and Forecast - by Types
- 5.2.1. Polyester Filter Bags
- 5.2.2. Polypropylene Filter Bags
- 5.2.3. Nylon Filter Bags
- 5.2.4. Aramid Filter Bags
- 5.2.5. Others
- 5.3. Market Analysis, Insights and Forecast - by Region
- 5.3.1. North America
- 5.3.2. South America
- 5.3.3. Europe
- 5.3.4. Middle East & Africa
- 5.3.5. Asia Pacific
- 5.1. Market Analysis, Insights and Forecast - by Application
- 6. North America Liquid Filter Bags Analysis, Insights and Forecast, 2020-2032
- 6.1. Market Analysis, Insights and Forecast - by Application
- 6.1.1. Chemical Industry
- 6.1.2. Food and Beverages
- 6.1.3. Pharmaceuticals
- 6.1.4. Water & Wastewater
- 6.1.5. Inks, Paints, Coatings
- 6.1.6. Others
- 6.2. Market Analysis, Insights and Forecast - by Types
- 6.2.1. Polyester Filter Bags
- 6.2.2. Polypropylene Filter Bags
- 6.2.3. Nylon Filter Bags
- 6.2.4. Aramid Filter Bags
- 6.2.5. Others
- 6.1. Market Analysis, Insights and Forecast - by Application
- 7. South America Liquid Filter Bags Analysis, Insights and Forecast, 2020-2032
- 7.1. Market Analysis, Insights and Forecast - by Application
- 7.1.1. Chemical Industry
- 7.1.2. Food and Beverages
- 7.1.3. Pharmaceuticals
- 7.1.4. Water & Wastewater
- 7.1.5. Inks, Paints, Coatings
- 7.1.6. Others
- 7.2. Market Analysis, Insights and Forecast - by Types
- 7.2.1. Polyester Filter Bags
- 7.2.2. Polypropylene Filter Bags
- 7.2.3. Nylon Filter Bags
- 7.2.4. Aramid Filter Bags
- 7.2.5. Others
- 7.1. Market Analysis, Insights and Forecast - by Application
- 8. Europe Liquid Filter Bags Analysis, Insights and Forecast, 2020-2032
- 8.1. Market Analysis, Insights and Forecast - by Application
- 8.1.1. Chemical Industry
- 8.1.2. Food and Beverages
- 8.1.3. Pharmaceuticals
- 8.1.4. Water & Wastewater
- 8.1.5. Inks, Paints, Coatings
- 8.1.6. Others
- 8.2. Market Analysis, Insights and Forecast - by Types
- 8.2.1. Polyester Filter Bags
- 8.2.2. Polypropylene Filter Bags
- 8.2.3. Nylon Filter Bags
- 8.2.4. Aramid Filter Bags
- 8.2.5. Others
- 8.1. Market Analysis, Insights and Forecast - by Application
- 9. Middle East & Africa Liquid Filter Bags Analysis, Insights and Forecast, 2020-2032
- 9.1. Market Analysis, Insights and Forecast - by Application
- 9.1.1. Chemical Industry
- 9.1.2. Food and Beverages
- 9.1.3. Pharmaceuticals
- 9.1.4. Water & Wastewater
- 9.1.5. Inks, Paints, Coatings
- 9.1.6. Others
- 9.2. Market Analysis, Insights and Forecast - by Types
- 9.2.1. Polyester Filter Bags
- 9.2.2. Polypropylene Filter Bags
- 9.2.3. Nylon Filter Bags
- 9.2.4. Aramid Filter Bags
- 9.2.5. Others
- 9.1. Market Analysis, Insights and Forecast - by Application
- 10. Asia Pacific Liquid Filter Bags Analysis, Insights and Forecast, 2020-2032
- 10.1. Market Analysis, Insights and Forecast - by Application
- 10.1.1. Chemical Industry
- 10.1.2. Food and Beverages
- 10.1.3. Pharmaceuticals
- 10.1.4. Water & Wastewater
- 10.1.5. Inks, Paints, Coatings
- 10.1.6. Others
- 10.2. Market Analysis, Insights and Forecast - by Types
- 10.2.1. Polyester Filter Bags
- 10.2.2. Polypropylene Filter Bags
- 10.2.3. Nylon Filter Bags
- 10.2.4. Aramid Filter Bags
- 10.2.5. Others
- 10.1. Market Analysis, Insights and Forecast - by Application
- 11. Competitive Analysis
- 11.1. Global Market Share Analysis 2025
- 11.2. Company Profiles
- 11.2.1 Parker Hannifin
- 11.2.1.1. Overview
- 11.2.1.2. Products
- 11.2.1.3. SWOT Analysis
- 11.2.1.4. Recent Developments
- 11.2.1.5. Financials (Based on Availability)
- 11.2.2 Eaton
- 11.2.2.1. Overview
- 11.2.2.2. Products
- 11.2.2.3. SWOT Analysis
- 11.2.2.4. Recent Developments
- 11.2.2.5. Financials (Based on Availability)
- 11.2.3 Pentair
- 11.2.3.1. Overview
- 11.2.3.2. Products
- 11.2.3.3. SWOT Analysis
- 11.2.3.4. Recent Developments
- 11.2.3.5. Financials (Based on Availability)
- 11.2.4 3M
- 11.2.4.1. Overview
- 11.2.4.2. Products
- 11.2.4.3. SWOT Analysis
- 11.2.4.4. Recent Developments
- 11.2.4.5. Financials (Based on Availability)
- 11.2.5 Sefar
- 11.2.5.1. Overview
- 11.2.5.2. Products
- 11.2.5.3. SWOT Analysis
- 11.2.5.4. Recent Developments
- 11.2.5.5. Financials (Based on Availability)
- 11.2.6 AJR Filtration
- 11.2.6.1. Overview
- 11.2.6.2. Products
- 11.2.6.3. SWOT Analysis
- 11.2.6.4. Recent Developments
- 11.2.6.5. Financials (Based on Availability)
- 11.2.7 Amazon Filters
- 11.2.7.1. Overview
- 11.2.7.2. Products
- 11.2.7.3. SWOT Analysis
- 11.2.7.4. Recent Developments
- 11.2.7.5. Financials (Based on Availability)
- 11.2.8 Filtration Group
- 11.2.8.1. Overview
- 11.2.8.2. Products
- 11.2.8.3. SWOT Analysis
- 11.2.8.4. Recent Developments
- 11.2.8.5. Financials (Based on Availability)
- 11.2.9 Knight Corporation
- 11.2.9.1. Overview
- 11.2.9.2. Products
- 11.2.9.3. SWOT Analysis
- 11.2.9.4. Recent Developments
- 11.2.9.5. Financials (Based on Availability)
- 11.2.10 Strainrite
- 11.2.10.1. Overview
- 11.2.10.2. Products
- 11.2.10.3. SWOT Analysis
- 11.2.10.4. Recent Developments
- 11.2.10.5. Financials (Based on Availability)
- 11.2.11 Donaldson
- 11.2.11.1. Overview
- 11.2.11.2. Products
- 11.2.11.3. SWOT Analysis
- 11.2.11.4. Recent Developments
- 11.2.11.5. Financials (Based on Availability)
- 11.2.12 Allied Filter Systems
- 11.2.12.1. Overview
- 11.2.12.2. Products
- 11.2.12.3. SWOT Analysis
- 11.2.12.4. Recent Developments
- 11.2.12.5. Financials (Based on Availability)
- 11.2.13 Critical Process Filtration
- 11.2.13.1. Overview
- 11.2.13.2. Products
- 11.2.13.3. SWOT Analysis
- 11.2.13.4. Recent Developments
- 11.2.13.5. Financials (Based on Availability)
- 11.2.14 Harmsco
- 11.2.14.1. Overview
- 11.2.14.2. Products
- 11.2.14.3. SWOT Analysis
- 11.2.14.4. Recent Developments
- 11.2.14.5. Financials (Based on Availability)
- 11.2.15 HL Filter
- 11.2.15.1. Overview
- 11.2.15.2. Products
- 11.2.15.3. SWOT Analysis
- 11.2.15.4. Recent Developments
- 11.2.15.5. Financials (Based on Availability)
- 11.2.16 Universal Filtration
- 11.2.16.1. Overview
- 11.2.16.2. Products
- 11.2.16.3. SWOT Analysis
- 11.2.16.4. Recent Developments
- 11.2.16.5. Financials (Based on Availability)
- 11.2.17 Industrial Filter Manufacturing (IFM)
- 11.2.17.1. Overview
- 11.2.17.2. Products
- 11.2.17.3. SWOT Analysis
- 11.2.17.4. Recent Developments
- 11.2.17.5. Financials (Based on Availability)
- 11.2.18 Hlvleey
- 11.2.18.1. Overview
- 11.2.18.2. Products
- 11.2.18.3. SWOT Analysis
- 11.2.18.4. Recent Developments
- 11.2.18.5. Financials (Based on Availability)
- 11.2.1 Parker Hannifin
List of Figures
- Figure 1: Global Liquid Filter Bags Revenue Breakdown (billion, %) by Region 2025 & 2033
- Figure 2: North America Liquid Filter Bags Revenue (billion), by Application 2025 & 2033
- Figure 3: North America Liquid Filter Bags Revenue Share (%), by Application 2025 & 2033
- Figure 4: North America Liquid Filter Bags Revenue (billion), by Types 2025 & 2033
- Figure 5: North America Liquid Filter Bags Revenue Share (%), by Types 2025 & 2033
- Figure 6: North America Liquid Filter Bags Revenue (billion), by Country 2025 & 2033
- Figure 7: North America Liquid Filter Bags Revenue Share (%), by Country 2025 & 2033
- Figure 8: South America Liquid Filter Bags Revenue (billion), by Application 2025 & 2033
- Figure 9: South America Liquid Filter Bags Revenue Share (%), by Application 2025 & 2033
- Figure 10: South America Liquid Filter Bags Revenue (billion), by Types 2025 & 2033
- Figure 11: South America Liquid Filter Bags Revenue Share (%), by Types 2025 & 2033
- Figure 12: South America Liquid Filter Bags Revenue (billion), by Country 2025 & 2033
- Figure 13: South America Liquid Filter Bags Revenue Share (%), by Country 2025 & 2033
- Figure 14: Europe Liquid Filter Bags Revenue (billion), by Application 2025 & 2033
- Figure 15: Europe Liquid Filter Bags Revenue Share (%), by Application 2025 & 2033
- Figure 16: Europe Liquid Filter Bags Revenue (billion), by Types 2025 & 2033
- Figure 17: Europe Liquid Filter Bags Revenue Share (%), by Types 2025 & 2033
- Figure 18: Europe Liquid Filter Bags Revenue (billion), by Country 2025 & 2033
- Figure 19: Europe Liquid Filter Bags Revenue Share (%), by Country 2025 & 2033
- Figure 20: Middle East & Africa Liquid Filter Bags Revenue (billion), by Application 2025 & 2033
- Figure 21: Middle East & Africa Liquid Filter Bags Revenue Share (%), by Application 2025 & 2033
- Figure 22: Middle East & Africa Liquid Filter Bags Revenue (billion), by Types 2025 & 2033
- Figure 23: Middle East & Africa Liquid Filter Bags Revenue Share (%), by Types 2025 & 2033
- Figure 24: Middle East & Africa Liquid Filter Bags Revenue (billion), by Country 2025 & 2033
- Figure 25: Middle East & Africa Liquid Filter Bags Revenue Share (%), by Country 2025 & 2033
- Figure 26: Asia Pacific Liquid Filter Bags Revenue (billion), by Application 2025 & 2033
- Figure 27: Asia Pacific Liquid Filter Bags Revenue Share (%), by Application 2025 & 2033
- Figure 28: Asia Pacific Liquid Filter Bags Revenue (billion), by Types 2025 & 2033
- Figure 29: Asia Pacific Liquid Filter Bags Revenue Share (%), by Types 2025 & 2033
- Figure 30: Asia Pacific Liquid Filter Bags Revenue (billion), by Country 2025 & 2033
- Figure 31: Asia Pacific Liquid Filter Bags Revenue Share (%), by Country 2025 & 2033
List of Tables
- Table 1: Global Liquid Filter Bags Revenue billion Forecast, by Application 2020 & 2033
- Table 2: Global Liquid Filter Bags Revenue billion Forecast, by Types 2020 & 2033
- Table 3: Global Liquid Filter Bags Revenue billion Forecast, by Region 2020 & 2033
- Table 4: Global Liquid Filter Bags Revenue billion Forecast, by Application 2020 & 2033
- Table 5: Global Liquid Filter Bags Revenue billion Forecast, by Types 2020 & 2033
- Table 6: Global Liquid Filter Bags Revenue billion Forecast, by Country 2020 & 2033
- Table 7: United States Liquid Filter Bags Revenue (billion) Forecast, by Application 2020 & 2033
- Table 8: Canada Liquid Filter Bags Revenue (billion) Forecast, by Application 2020 & 2033
- Table 9: Mexico Liquid Filter Bags Revenue (billion) Forecast, by Application 2020 & 2033
- Table 10: Global Liquid Filter Bags Revenue billion Forecast, by Application 2020 & 2033
- Table 11: Global Liquid Filter Bags Revenue billion Forecast, by Types 2020 & 2033
- Table 12: Global Liquid Filter Bags Revenue billion Forecast, by Country 2020 & 2033
- Table 13: Brazil Liquid Filter Bags Revenue (billion) Forecast, by Application 2020 & 2033
- Table 14: Argentina Liquid Filter Bags Revenue (billion) Forecast, by Application 2020 & 2033
- Table 15: Rest of South America Liquid Filter Bags Revenue (billion) Forecast, by Application 2020 & 2033
- Table 16: Global Liquid Filter Bags Revenue billion Forecast, by Application 2020 & 2033
- Table 17: Global Liquid Filter Bags Revenue billion Forecast, by Types 2020 & 2033
- Table 18: Global Liquid Filter Bags Revenue billion Forecast, by Country 2020 & 2033
- Table 19: United Kingdom Liquid Filter Bags Revenue (billion) Forecast, by Application 2020 & 2033
- Table 20: Germany Liquid Filter Bags Revenue (billion) Forecast, by Application 2020 & 2033
- Table 21: France Liquid Filter Bags Revenue (billion) Forecast, by Application 2020 & 2033
- Table 22: Italy Liquid Filter Bags Revenue (billion) Forecast, by Application 2020 & 2033
- Table 23: Spain Liquid Filter Bags Revenue (billion) Forecast, by Application 2020 & 2033
- Table 24: Russia Liquid Filter Bags Revenue (billion) Forecast, by Application 2020 & 2033
- Table 25: Benelux Liquid Filter Bags Revenue (billion) Forecast, by Application 2020 & 2033
- Table 26: Nordics Liquid Filter Bags Revenue (billion) Forecast, by Application 2020 & 2033
- Table 27: Rest of Europe Liquid Filter Bags Revenue (billion) Forecast, by Application 2020 & 2033
- Table 28: Global Liquid Filter Bags Revenue billion Forecast, by Application 2020 & 2033
- Table 29: Global Liquid Filter Bags Revenue billion Forecast, by Types 2020 & 2033
- Table 30: Global Liquid Filter Bags Revenue billion Forecast, by Country 2020 & 2033
- Table 31: Turkey Liquid Filter Bags Revenue (billion) Forecast, by Application 2020 & 2033
- Table 32: Israel Liquid Filter Bags Revenue (billion) Forecast, by Application 2020 & 2033
- Table 33: GCC Liquid Filter Bags Revenue (billion) Forecast, by Application 2020 & 2033
- Table 34: North Africa Liquid Filter Bags Revenue (billion) Forecast, by Application 2020 & 2033
- Table 35: South Africa Liquid Filter Bags Revenue (billion) Forecast, by Application 2020 & 2033
- Table 36: Rest of Middle East & Africa Liquid Filter Bags Revenue (billion) Forecast, by Application 2020 & 2033
- Table 37: Global Liquid Filter Bags Revenue billion Forecast, by Application 2020 & 2033
- Table 38: Global Liquid Filter Bags Revenue billion Forecast, by Types 2020 & 2033
- Table 39: Global Liquid Filter Bags Revenue billion Forecast, by Country 2020 & 2033
- Table 40: China Liquid Filter Bags Revenue (billion) Forecast, by Application 2020 & 2033
- Table 41: India Liquid Filter Bags Revenue (billion) Forecast, by Application 2020 & 2033
- Table 42: Japan Liquid Filter Bags Revenue (billion) Forecast, by Application 2020 & 2033
- Table 43: South Korea Liquid Filter Bags Revenue (billion) Forecast, by Application 2020 & 2033
- Table 44: ASEAN Liquid Filter Bags Revenue (billion) Forecast, by Application 2020 & 2033
- Table 45: Oceania Liquid Filter Bags Revenue (billion) Forecast, by Application 2020 & 2033
- Table 46: Rest of Asia Pacific Liquid Filter Bags Revenue (billion) Forecast, by Application 2020 & 2033
Frequently Asked Questions
1. What is the projected Compound Annual Growth Rate (CAGR) of the Liquid Filter Bags?
The projected CAGR is approximately 6%.
2. Which companies are prominent players in the Liquid Filter Bags?
Key companies in the market include Parker Hannifin, Eaton, Pentair, 3M, Sefar, AJR Filtration, Amazon Filters, Filtration Group, Knight Corporation, Strainrite, Donaldson, Allied Filter Systems, Critical Process Filtration, Harmsco, HL Filter, Universal Filtration, Industrial Filter Manufacturing (IFM), Hlvleey.
3. What are the main segments of the Liquid Filter Bags?
The market segments include Application, Types.
4. Can you provide details about the market size?
The market size is estimated to be USD 8.5 billion as of 2022.
5. What are some drivers contributing to market growth?
N/A
6. What are the notable trends driving market growth?
N/A
7. Are there any restraints impacting market growth?
N/A
8. Can you provide examples of recent developments in the market?
N/A
9. What pricing options are available for accessing the report?
Pricing options include single-user, multi-user, and enterprise licenses priced at USD 5600.00, USD 8400.00, and USD 11200.00 respectively.
10. Is the market size provided in terms of value or volume?
The market size is provided in terms of value, measured in billion.
11. Are there any specific market keywords associated with the report?
Yes, the market keyword associated with the report is "Liquid Filter Bags," which aids in identifying and referencing the specific market segment covered.
12. How do I determine which pricing option suits my needs best?
The pricing options vary based on user requirements and access needs. Individual users may opt for single-user licenses, while businesses requiring broader access may choose multi-user or enterprise licenses for cost-effective access to the report.
13. Are there any additional resources or data provided in the Liquid Filter Bags report?
While the report offers comprehensive insights, it's advisable to review the specific contents or supplementary materials provided to ascertain if additional resources or data are available.
14. How can I stay updated on further developments or reports in the Liquid Filter Bags?
To stay informed about further developments, trends, and reports in the Liquid Filter Bags, consider subscribing to industry newsletters, following relevant companies and organizations, or regularly checking reputable industry news sources and publications.
Methodology
Step 1 - Identification of Relevant Samples Size from Population Database


Step 2 - Approaches for Defining Global Market Size (Value, Volume* & Price*)

Note*: In applicable scenarios
Step 3 - Data Sources
Primary Research
- Web Analytics
- Survey Reports
- Research Institute
- Latest Research Reports
- Opinion Leaders
Secondary Research
- Annual Reports
- White Paper
- Latest Press Release
- Industry Association
- Paid Database
- Investor Presentations

Step 4 - Data Triangulation
Involves using different sources of information in order to increase the validity of a study
These sources are likely to be stakeholders in a program - participants, other researchers, program staff, other community members, and so on.
Then we put all data in single framework & apply various statistical tools to find out the dynamic on the market.
During the analysis stage, feedback from the stakeholder groups would be compared to determine areas of agreement as well as areas of divergence