

Key Insights
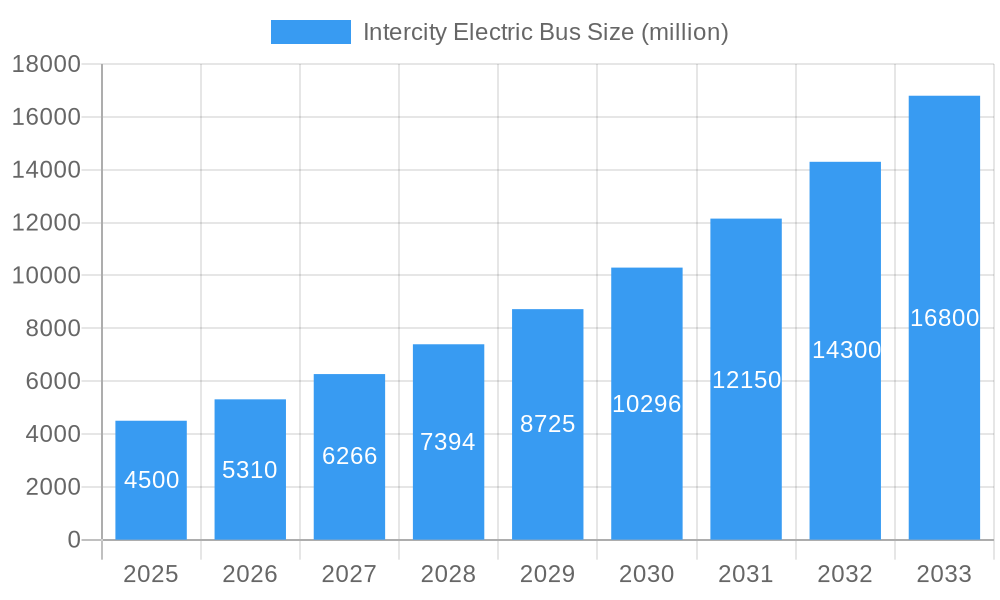
The Intercity Electric Bus market is poised for significant expansion, driven by a growing global commitment to sustainable transportation and the urgent need to decarbonize public transit. With a substantial market size estimated at $4,500 million and a projected Compound Annual Growth Rate (CAGR) of 18% from 2025 to 2033, this sector is experiencing dynamic evolution. Key drivers include stringent government regulations, increasing environmental awareness among consumers and municipalities, and substantial investments in electric vehicle (EV) infrastructure. Furthermore, advancements in battery technology, leading to longer ranges and faster charging times, are directly addressing earlier concerns about range anxiety for intercity routes. The push for fleet electrification by transit authorities worldwide, coupled with the cost-effectiveness of electric buses in terms of operational and maintenance expenses over their lifecycle, further fuels this growth.

Intercity Electric Bus Market Size (In Billion)
The market is segmented across various applications, with Battery Electric Buses dominating due to their zero-emission capabilities and suitability for both short and long-haul intercity routes. Plug-in Hybrid Buses and Hybrid Buses also play a crucial role in the transition phase, offering a bridge to full electrification. Key technological components powering this growth include advanced Electric Motors, high-capacity Batteries, and efficient Transmission Systems, while Hydrogen Fuel Cells are emerging as a promising alternative for specific long-distance applications. Geographically, the Asia Pacific region, particularly China, is expected to lead the market in terms of volume, owing to robust government support and a well-established manufacturing base. Europe and North America are also exhibiting strong growth, driven by ambitious climate targets and technological innovation from leading companies like BYD, AB Volvo, and Ebusco, among others. Challenges such as high initial purchase costs and the need for extensive charging infrastructure are being steadily overcome by technological progress and supportive policy frameworks, paving the way for widespread adoption.
Intercity Electric Bus Company Market Share
This in-depth market research report provides a thorough analysis of the global Intercity Electric Bus market, covering the historical period from 2019 to 2024, a base year of 2025, and a comprehensive forecast period extending to 2033. We delve into market composition, evolutionary trends, key regional and segmental dominance, product innovations, growth drivers, existing obstacles, and promising future opportunities. This report is meticulously crafted to assist stakeholders, investors, and industry participants in navigating the dynamic landscape of electric intercity bus transportation.
Intercity Electric Bus Market Composition & Trends
The Intercity Electric Bus market exhibits a moderate concentration, with a few major players holding significant market share, estimated at over 500 million. Innovation is primarily driven by advancements in battery technology, charging infrastructure, and lightweight materials, leading to enhanced range and reduced charging times for Battery Electric Buses. Regulatory landscapes are progressively favoring zero-emission vehicles through subsidies, tax incentives, and stringent emission standards, compelling manufacturers to invest heavily in sustainable mobility solutions. While alternative fuel buses like Hydrogen Fuel Cell vehicles are emerging, Battery Electric Buses currently dominate due to established infrastructure and cost-effectiveness. End-user profiles are diverse, encompassing public transportation authorities, private operators, and large corporations seeking to decarbonize their fleets. Mergers and acquisitions (M&A) activity is on the rise, with strategic partnerships and consolidations valued in the hundreds of millions as companies aim to expand their product portfolios and geographical reach. Key M&A deals are projected to reach over 700 million in value during the forecast period.
- Market Share Distribution: Leading companies hold an estimated 60% of the market share.
- Innovation Catalysts: Battery technology (e.g., solid-state batteries) and fast-charging solutions are key drivers.
- Regulatory Influence: Government mandates and subsidies are instrumental in market adoption, with over 200 million in incentives expected annually.
- Substitute Products: While Hydrogen Fuel Cell buses are a nascent alternative, Battery Electric Buses maintain a strong competitive edge.
- End-User Profiles: Public transit agencies and large fleet operators are primary adopters.
- M&A Activities: Consolidations are expected to accelerate, with projected deal values exceeding 700 million.
Intercity Electric Bus Industry Evolution
The intercity electric bus industry is experiencing remarkable growth and transformation, driven by a confluence of factors. The global market for intercity electric buses is projected to witness a Compound Annual Growth Rate (CAGR) of approximately 18% from the base year of 2025 through 2033, reaching an estimated market size of over 50 billion by the end of the forecast period. This robust expansion is underpinned by significant technological advancements. Battery electric buses are continuously improving in terms of energy density, leading to extended operational ranges that now frequently exceed 400 kilometers on a single charge, thereby alleviating range anxiety for intercity routes. Charging technologies are also rapidly evolving, with the advent of ultra-fast charging stations capable of replenishing bus batteries in under an hour, a dramatic improvement from previous multi-hour charging cycles. The development of more efficient electric powertrains and regenerative braking systems further optimizes energy consumption, contributing to lower operating costs.
Shifting consumer demands and increasing environmental awareness are playing a pivotal role in this evolution. Passengers are increasingly prioritizing sustainable travel options, and intercity bus operators are responding by investing in eco-friendly fleets to enhance their brand image and attract environmentally conscious travelers. Furthermore, the growing commitment of governments worldwide to achieve net-zero emissions targets is a substantial catalyst. Policy initiatives, including preferential procurement policies for electric buses, substantial subsidies for their acquisition, and the establishment of ambitious deployment targets, are creating a highly favorable market environment. For instance, the European Union's "Fit for 55" package includes targets for zero-emission public transport, directly impacting the intercity bus sector. The adoption of hybrid buses and plug-in hybrid buses, while still relevant, is steadily declining as the performance and cost-effectiveness of pure battery electric buses improve, making them the clear future of intercity public transportation. The industry is moving towards cleaner, quieter, and more efficient intercity travel solutions.
Leading Regions, Countries, or Segments in Intercity Electric Bus
The dominance in the Intercity Electric Bus market is clearly shifting towards Battery Electric Buses as the preferred application, driven by continuous improvements in range, performance, and charging infrastructure. Within this segment, key regions and countries are spearheading adoption due to strong governmental support, robust market demand, and significant investment in electric mobility.
Dominant Application: Battery Electric Bus
Battery Electric Buses are at the forefront of the intercity electric bus revolution. Their appeal lies in their zero tailpipe emissions, lower operating costs due to reduced fuel and maintenance expenses, and increasingly competitive initial purchase prices. The forecast suggests that Battery Electric Buses will capture over 75% of the total intercity electric bus market by 2033.
- Key Drivers for Battery Electric Bus Dominance:
- Environmental Regulations and Targets: Aggressive emission reduction goals set by governments worldwide, particularly in Europe and Asia, are mandating the transition away from diesel and hybrid alternatives.
- Technological Advancements: Continuous improvements in battery energy density and lifespan, enabling longer intercity routes (exceeding 400 kilometers), coupled with rapid advancements in charging technology, have significantly addressed previous limitations.
- Cost Competitiveness: While initial purchase costs remain higher than traditional buses, the total cost of ownership (TCO) for battery electric buses is becoming increasingly attractive due to lower energy and maintenance expenses, projected to be 20% lower by 2030.
- Government Incentives and Subsidies: Extensive financial support in the form of purchase subsidies, tax credits, and grants are making battery electric buses more accessible to operators. These incentives are estimated to contribute over 300 million annually in some key markets.
Leading Regions and Countries:
- Europe: This region is a frontrunner, with countries like Germany, France, the Netherlands, and Norway leading the charge. Strong policy frameworks, substantial EU funding for sustainable transport, and a high public awareness of climate change issues are key factors. Investment in charging infrastructure alone in Europe is projected to reach over 1 billion by 2028.
- Asia-Pacific: China, in particular, has been a dominant force, driven by aggressive government mandates and a well-established manufacturing base. The region's rapid urbanization and commitment to cleaner air are also fueling growth. Emerging markets in Southeast Asia are also showing increasing interest.
- North America: While slightly behind Europe and Asia in overall adoption, the United States and Canada are witnessing a significant uptick, spurred by federal and state-level incentives, and a growing number of transit agencies setting ambitious electrification targets.
Dominant Types:
- Batteries: The advancement of battery technology, particularly lithium-ion variants, is crucial. Investments in R&D for batteries with higher energy density and faster charging capabilities are projected to exceed 500 million globally by 2026.
- Electric Motor: The efficiency and reliability of electric motors are continually improving, offering superior torque and smoother acceleration compared to internal combustion engines.
- Transmission System: Simplified and highly efficient transmission systems are integral to the performance of electric buses.
Intercity Electric Bus Product Innovations
The intercity electric bus market is witnessing a surge of product innovations focused on enhancing efficiency, passenger comfort, and sustainability. Manufacturers are pushing the boundaries with lightweight composite materials, reducing vehicle weight to improve energy efficiency and extend range. Advanced battery management systems are optimizing charging and discharging cycles, contributing to longer battery life, estimated at over 10 years. Innovations in aerodynamic design are minimizing drag, further boosting efficiency on long-haul routes. Furthermore, the integration of smart connectivity features, including real-time passenger information systems and predictive maintenance, is enhancing the operational intelligence of these buses. The development of modular battery designs allows for easier upgrades and replacements, ensuring the long-term viability of the fleet. Performance metrics like average energy consumption are now below 1.2 kWh per kilometer, and charging times are being reduced to under 60 minutes for a full charge.
Propelling Factors for Intercity Electric Bus Growth
Several key factors are propelling the growth of the intercity electric bus market. Firstly, technological advancements in battery technology, including increased energy density and faster charging capabilities, are significantly improving the practicality and range of electric buses. Secondly, stringent environmental regulations and government mandates worldwide are pushing for the adoption of zero-emission vehicles, creating a strong regulatory push. Thirdly, growing environmental consciousness among consumers is driving demand for sustainable travel options. Fourthly, decreasing battery costs and increasing government subsidies are making electric buses more economically viable, with projected cost reductions of 25% in battery packs by 2027. Finally, corporate sustainability initiatives by large companies and tour operators to reduce their carbon footprint are further fueling market expansion.
Obstacles in the Intercity Electric Bus Market
Despite the promising growth, the intercity electric bus market faces several obstacles. The high upfront cost of electric buses, although decreasing, remains a significant barrier for some operators. Limited charging infrastructure availability on intercity routes, especially in remote areas, can lead to range anxiety and logistical challenges. Longer refueling (charging) times compared to traditional diesel buses can impact operational efficiency. Supply chain disruptions for critical raw materials, such as lithium and cobalt, can affect production volumes and costs. Furthermore, policy inconsistencies and the gradual phasing out of subsidies in some regions could temper growth. The availability of skilled technicians for maintenance and repair of electric powertrains is also a concern.
Future Opportunities in Intercity Electric Bus
The future of the intercity electric bus market is rife with opportunities. The continuous development of solid-state battery technology promises even greater energy density and faster charging, potentially eliminating range anxiety. Expansion of smart charging infrastructure and vehicle-to-grid (V2G) capabilities will create new revenue streams and enhance grid stability. The emergence of autonomous electric buses for intercity routes presents a transformative opportunity for improved efficiency and safety. Furthermore, new market penetration in developing economies, coupled with the increasing demand for eco-tourism and sustainable long-distance travel, will open up new customer segments. The ongoing reduction in battery costs is expected to make electric buses cost-competitive with diesel alternatives within the next five years, further accelerating adoption.
Major Players in the Intercity Electric Bus Ecosystem
- AB Volvo
- BYD Company Ltd.
- Ebusco
- EvoBus GmbH
- Mitra Mobility Solution
- Motor Coach Industries (MCI)
- PT MOBIL ANAK BANGSA (MAB)
- Scania
- Solaris Bus and Coach sp. z o.o.
- YANGZHOU ASIASTAR BUS CO.,LTD.
- Yinlong
- YUTONG
Key Developments in Intercity Electric Bus Industry
- 2023: BYD launches its new generation intercity electric bus with a claimed range of over 500 kilometers, setting a new benchmark.
- 2023: Ebusco announces a significant order for 100 electric buses from a European transit authority, highlighting growing fleet electrification.
- 2024: Scania showcases its latest hydrogen fuel cell intercity bus prototype, signaling continued exploration of alternative zero-emission technologies.
- 2024: EvoBus GmbH (Daimler Buses) announces increased investment in battery technology research and development, aiming for enhanced performance and cost reduction.
- 2024: Solaris Bus and Coach secures a major contract for the supply of 50 articulated electric buses to a metropolitan area, emphasizing the trend towards larger capacity electric vehicles.
- 2025 (Projected): Introduction of new battery chemistries expected to further reduce charging times and increase energy density by 15%.
- 2025 (Projected): Major infrastructure initiatives in Europe and Asia aim to significantly expand the network of fast-charging stations for intercity buses.
- 2026 (Projected): Increased M&A activity anticipated as larger players seek to acquire innovative startups and expand their market presence, with deal values potentially exceeding 200 million.
- 2027 (Projected): The total cost of ownership for Battery Electric Buses is projected to become comparable to or even lower than diesel buses.
- 2028 (Projected): Significant advancements in autonomous driving technology for electric buses are expected to reach pilot testing phases for intercity routes.
- 2029 (Projected): China's domestic market is expected to account for over 60% of global intercity electric bus sales.
- 2030 (Projected): North American adoption rates are projected to accelerate, reaching a market share of over 30% for electric intercity buses.
- 2033 (Projected): The global Intercity Electric Bus market is forecast to exceed 50 billion in value, with Battery Electric Buses dominating over 80% of the market.
Strategic Intercity Electric Bus Market Forecast
The strategic forecast for the Intercity Electric Bus market is exceptionally positive, driven by a confluence of compelling growth catalysts. The ongoing advancements in battery technology, including higher energy densities and faster charging capabilities, are directly addressing historical limitations and making electric buses a viable and increasingly preferred choice for long-distance travel. Furthermore, the unwavering commitment from governments globally to decarbonize transportation through stringent regulations and substantial financial incentives, such as purchase subsidies and tax credits valued in the hundreds of millions, is creating a robust market environment. The rising consumer demand for sustainable and environmentally friendly travel options further amplifies this trend. Coupled with the strategic investments in charging infrastructure and the expanding product portfolios of major players like BYD and AB Volvo, the market is poised for sustained and significant expansion, with a projected market size exceeding 50 billion by 2033.
Intercity Electric Bus Segmentation
-
1. Application
- 1.1. Battery Electric Bus
- 1.2. Plug-in Hybrid Bus
- 1.3. Hybrid Bus
-
2. Types
- 2.1. Electric Motor
- 2.2. Batteries
- 2.3. Transmission System
- 2.4. Hydrogen Fuel Cell
- 2.5. Others
Intercity Electric Bus Segmentation By Geography
-
1. North America
- 1.1. United States
- 1.2. Canada
- 1.3. Mexico
-
2. South America
- 2.1. Brazil
- 2.2. Argentina
- 2.3. Rest of South America
-
3. Europe
- 3.1. United Kingdom
- 3.2. Germany
- 3.3. France
- 3.4. Italy
- 3.5. Spain
- 3.6. Russia
- 3.7. Benelux
- 3.8. Nordics
- 3.9. Rest of Europe
-
4. Middle East & Africa
- 4.1. Turkey
- 4.2. Israel
- 4.3. GCC
- 4.4. North Africa
- 4.5. South Africa
- 4.6. Rest of Middle East & Africa
-
5. Asia Pacific
- 5.1. China
- 5.2. India
- 5.3. Japan
- 5.4. South Korea
- 5.5. ASEAN
- 5.6. Oceania
- 5.7. Rest of Asia Pacific
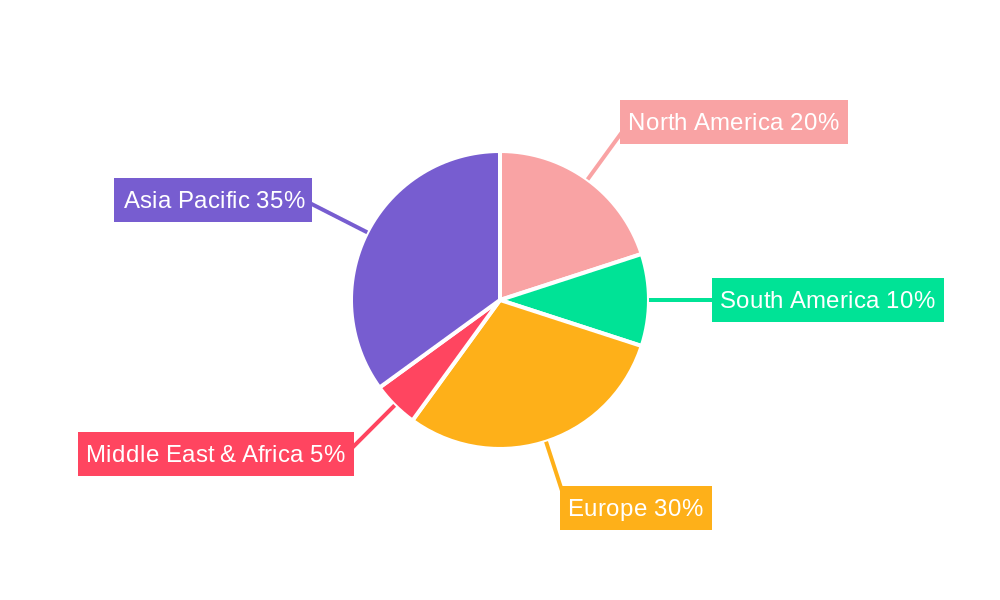
Intercity Electric Bus Regional Market Share
Geographic Coverage of Intercity Electric Bus
Intercity Electric Bus REPORT HIGHLIGHTS
| Aspects | Details |
|---|---|
| Study Period | 2020-2034 |
| Base Year | 2025 |
| Estimated Year | 2026 |
| Forecast Period | 2026-2034 |
| Historical Period | 2020-2025 |
| Growth Rate | CAGR of 14% from 2020-2034 |
| Segmentation |
|
Table of Contents
- 1. Introduction
- 1.1. Research Scope
- 1.2. Market Segmentation
- 1.3. Research Methodology
- 1.4. Definitions and Assumptions
- 2. Executive Summary
- 2.1. Introduction
- 3. Market Dynamics
- 3.1. Introduction
- 3.2. Market Drivers
- 3.3. Market Restrains
- 3.4. Market Trends
- 4. Market Factor Analysis
- 4.1. Porters Five Forces
- 4.2. Supply/Value Chain
- 4.3. PESTEL analysis
- 4.4. Market Entropy
- 4.5. Patent/Trademark Analysis
- 5. Global Intercity Electric Bus Analysis, Insights and Forecast, 2020-2032
- 5.1. Market Analysis, Insights and Forecast - by Application
- 5.1.1. Battery Electric Bus
- 5.1.2. Plug-in Hybrid Bus
- 5.1.3. Hybrid Bus
- 5.2. Market Analysis, Insights and Forecast - by Types
- 5.2.1. Electric Motor
- 5.2.2. Batteries
- 5.2.3. Transmission System
- 5.2.4. Hydrogen Fuel Cell
- 5.2.5. Others
- 5.3. Market Analysis, Insights and Forecast - by Region
- 5.3.1. North America
- 5.3.2. South America
- 5.3.3. Europe
- 5.3.4. Middle East & Africa
- 5.3.5. Asia Pacific
- 5.1. Market Analysis, Insights and Forecast - by Application
- 6. North America Intercity Electric Bus Analysis, Insights and Forecast, 2020-2032
- 6.1. Market Analysis, Insights and Forecast - by Application
- 6.1.1. Battery Electric Bus
- 6.1.2. Plug-in Hybrid Bus
- 6.1.3. Hybrid Bus
- 6.2. Market Analysis, Insights and Forecast - by Types
- 6.2.1. Electric Motor
- 6.2.2. Batteries
- 6.2.3. Transmission System
- 6.2.4. Hydrogen Fuel Cell
- 6.2.5. Others
- 6.1. Market Analysis, Insights and Forecast - by Application
- 7. South America Intercity Electric Bus Analysis, Insights and Forecast, 2020-2032
- 7.1. Market Analysis, Insights and Forecast - by Application
- 7.1.1. Battery Electric Bus
- 7.1.2. Plug-in Hybrid Bus
- 7.1.3. Hybrid Bus
- 7.2. Market Analysis, Insights and Forecast - by Types
- 7.2.1. Electric Motor
- 7.2.2. Batteries
- 7.2.3. Transmission System
- 7.2.4. Hydrogen Fuel Cell
- 7.2.5. Others
- 7.1. Market Analysis, Insights and Forecast - by Application
- 8. Europe Intercity Electric Bus Analysis, Insights and Forecast, 2020-2032
- 8.1. Market Analysis, Insights and Forecast - by Application
- 8.1.1. Battery Electric Bus
- 8.1.2. Plug-in Hybrid Bus
- 8.1.3. Hybrid Bus
- 8.2. Market Analysis, Insights and Forecast - by Types
- 8.2.1. Electric Motor
- 8.2.2. Batteries
- 8.2.3. Transmission System
- 8.2.4. Hydrogen Fuel Cell
- 8.2.5. Others
- 8.1. Market Analysis, Insights and Forecast - by Application
- 9. Middle East & Africa Intercity Electric Bus Analysis, Insights and Forecast, 2020-2032
- 9.1. Market Analysis, Insights and Forecast - by Application
- 9.1.1. Battery Electric Bus
- 9.1.2. Plug-in Hybrid Bus
- 9.1.3. Hybrid Bus
- 9.2. Market Analysis, Insights and Forecast - by Types
- 9.2.1. Electric Motor
- 9.2.2. Batteries
- 9.2.3. Transmission System
- 9.2.4. Hydrogen Fuel Cell
- 9.2.5. Others
- 9.1. Market Analysis, Insights and Forecast - by Application
- 10. Asia Pacific Intercity Electric Bus Analysis, Insights and Forecast, 2020-2032
- 10.1. Market Analysis, Insights and Forecast - by Application
- 10.1.1. Battery Electric Bus
- 10.1.2. Plug-in Hybrid Bus
- 10.1.3. Hybrid Bus
- 10.2. Market Analysis, Insights and Forecast - by Types
- 10.2.1. Electric Motor
- 10.2.2. Batteries
- 10.2.3. Transmission System
- 10.2.4. Hydrogen Fuel Cell
- 10.2.5. Others
- 10.1. Market Analysis, Insights and Forecast - by Application
- 11. Competitive Analysis
- 11.1. Global Market Share Analysis 2025
- 11.2. Company Profiles
- 11.2.1 AB Volvo
- 11.2.1.1. Overview
- 11.2.1.2. Products
- 11.2.1.3. SWOT Analysis
- 11.2.1.4. Recent Developments
- 11.2.1.5. Financials (Based on Availability)
- 11.2.2 BYD Company Ltd.
- 11.2.2.1. Overview
- 11.2.2.2. Products
- 11.2.2.3. SWOT Analysis
- 11.2.2.4. Recent Developments
- 11.2.2.5. Financials (Based on Availability)
- 11.2.3 Ebusco
- 11.2.3.1. Overview
- 11.2.3.2. Products
- 11.2.3.3. SWOT Analysis
- 11.2.3.4. Recent Developments
- 11.2.3.5. Financials (Based on Availability)
- 11.2.4 EvoBus GmbH
- 11.2.4.1. Overview
- 11.2.4.2. Products
- 11.2.4.3. SWOT Analysis
- 11.2.4.4. Recent Developments
- 11.2.4.5. Financials (Based on Availability)
- 11.2.5 Mitra Mobility Solution
- 11.2.5.1. Overview
- 11.2.5.2. Products
- 11.2.5.3. SWOT Analysis
- 11.2.5.4. Recent Developments
- 11.2.5.5. Financials (Based on Availability)
- 11.2.6 Motor Coach Industries (MCI)
- 11.2.6.1. Overview
- 11.2.6.2. Products
- 11.2.6.3. SWOT Analysis
- 11.2.6.4. Recent Developments
- 11.2.6.5. Financials (Based on Availability)
- 11.2.7 PT MOBIL ANAK BANGSA (MAB)
- 11.2.7.1. Overview
- 11.2.7.2. Products
- 11.2.7.3. SWOT Analysis
- 11.2.7.4. Recent Developments
- 11.2.7.5. Financials (Based on Availability)
- 11.2.8 Scania
- 11.2.8.1. Overview
- 11.2.8.2. Products
- 11.2.8.3. SWOT Analysis
- 11.2.8.4. Recent Developments
- 11.2.8.5. Financials (Based on Availability)
- 11.2.9 Solaris Bus and Coach sp. z o.o.
- 11.2.9.1. Overview
- 11.2.9.2. Products
- 11.2.9.3. SWOT Analysis
- 11.2.9.4. Recent Developments
- 11.2.9.5. Financials (Based on Availability)
- 11.2.10 YANGZHOU ASIASTAR BUS CO.
- 11.2.10.1. Overview
- 11.2.10.2. Products
- 11.2.10.3. SWOT Analysis
- 11.2.10.4. Recent Developments
- 11.2.10.5. Financials (Based on Availability)
- 11.2.11 LTD.
- 11.2.11.1. Overview
- 11.2.11.2. Products
- 11.2.11.3. SWOT Analysis
- 11.2.11.4. Recent Developments
- 11.2.11.5. Financials (Based on Availability)
- 11.2.12 Yinlong
- 11.2.12.1. Overview
- 11.2.12.2. Products
- 11.2.12.3. SWOT Analysis
- 11.2.12.4. Recent Developments
- 11.2.12.5. Financials (Based on Availability)
- 11.2.13 YUTONG
- 11.2.13.1. Overview
- 11.2.13.2. Products
- 11.2.13.3. SWOT Analysis
- 11.2.13.4. Recent Developments
- 11.2.13.5. Financials (Based on Availability)
- 11.2.1 AB Volvo
List of Figures
- Figure 1: Global Intercity Electric Bus Revenue Breakdown (undefined, %) by Region 2025 & 2033
- Figure 2: North America Intercity Electric Bus Revenue (undefined), by Application 2025 & 2033
- Figure 3: North America Intercity Electric Bus Revenue Share (%), by Application 2025 & 2033
- Figure 4: North America Intercity Electric Bus Revenue (undefined), by Types 2025 & 2033
- Figure 5: North America Intercity Electric Bus Revenue Share (%), by Types 2025 & 2033
- Figure 6: North America Intercity Electric Bus Revenue (undefined), by Country 2025 & 2033
- Figure 7: North America Intercity Electric Bus Revenue Share (%), by Country 2025 & 2033
- Figure 8: South America Intercity Electric Bus Revenue (undefined), by Application 2025 & 2033
- Figure 9: South America Intercity Electric Bus Revenue Share (%), by Application 2025 & 2033
- Figure 10: South America Intercity Electric Bus Revenue (undefined), by Types 2025 & 2033
- Figure 11: South America Intercity Electric Bus Revenue Share (%), by Types 2025 & 2033
- Figure 12: South America Intercity Electric Bus Revenue (undefined), by Country 2025 & 2033
- Figure 13: South America Intercity Electric Bus Revenue Share (%), by Country 2025 & 2033
- Figure 14: Europe Intercity Electric Bus Revenue (undefined), by Application 2025 & 2033
- Figure 15: Europe Intercity Electric Bus Revenue Share (%), by Application 2025 & 2033
- Figure 16: Europe Intercity Electric Bus Revenue (undefined), by Types 2025 & 2033
- Figure 17: Europe Intercity Electric Bus Revenue Share (%), by Types 2025 & 2033
- Figure 18: Europe Intercity Electric Bus Revenue (undefined), by Country 2025 & 2033
- Figure 19: Europe Intercity Electric Bus Revenue Share (%), by Country 2025 & 2033
- Figure 20: Middle East & Africa Intercity Electric Bus Revenue (undefined), by Application 2025 & 2033
- Figure 21: Middle East & Africa Intercity Electric Bus Revenue Share (%), by Application 2025 & 2033
- Figure 22: Middle East & Africa Intercity Electric Bus Revenue (undefined), by Types 2025 & 2033
- Figure 23: Middle East & Africa Intercity Electric Bus Revenue Share (%), by Types 2025 & 2033
- Figure 24: Middle East & Africa Intercity Electric Bus Revenue (undefined), by Country 2025 & 2033
- Figure 25: Middle East & Africa Intercity Electric Bus Revenue Share (%), by Country 2025 & 2033
- Figure 26: Asia Pacific Intercity Electric Bus Revenue (undefined), by Application 2025 & 2033
- Figure 27: Asia Pacific Intercity Electric Bus Revenue Share (%), by Application 2025 & 2033
- Figure 28: Asia Pacific Intercity Electric Bus Revenue (undefined), by Types 2025 & 2033
- Figure 29: Asia Pacific Intercity Electric Bus Revenue Share (%), by Types 2025 & 2033
- Figure 30: Asia Pacific Intercity Electric Bus Revenue (undefined), by Country 2025 & 2033
- Figure 31: Asia Pacific Intercity Electric Bus Revenue Share (%), by Country 2025 & 2033
List of Tables
- Table 1: Global Intercity Electric Bus Revenue undefined Forecast, by Application 2020 & 2033
- Table 2: Global Intercity Electric Bus Revenue undefined Forecast, by Types 2020 & 2033
- Table 3: Global Intercity Electric Bus Revenue undefined Forecast, by Region 2020 & 2033
- Table 4: Global Intercity Electric Bus Revenue undefined Forecast, by Application 2020 & 2033
- Table 5: Global Intercity Electric Bus Revenue undefined Forecast, by Types 2020 & 2033
- Table 6: Global Intercity Electric Bus Revenue undefined Forecast, by Country 2020 & 2033
- Table 7: United States Intercity Electric Bus Revenue (undefined) Forecast, by Application 2020 & 2033
- Table 8: Canada Intercity Electric Bus Revenue (undefined) Forecast, by Application 2020 & 2033
- Table 9: Mexico Intercity Electric Bus Revenue (undefined) Forecast, by Application 2020 & 2033
- Table 10: Global Intercity Electric Bus Revenue undefined Forecast, by Application 2020 & 2033
- Table 11: Global Intercity Electric Bus Revenue undefined Forecast, by Types 2020 & 2033
- Table 12: Global Intercity Electric Bus Revenue undefined Forecast, by Country 2020 & 2033
- Table 13: Brazil Intercity Electric Bus Revenue (undefined) Forecast, by Application 2020 & 2033
- Table 14: Argentina Intercity Electric Bus Revenue (undefined) Forecast, by Application 2020 & 2033
- Table 15: Rest of South America Intercity Electric Bus Revenue (undefined) Forecast, by Application 2020 & 2033
- Table 16: Global Intercity Electric Bus Revenue undefined Forecast, by Application 2020 & 2033
- Table 17: Global Intercity Electric Bus Revenue undefined Forecast, by Types 2020 & 2033
- Table 18: Global Intercity Electric Bus Revenue undefined Forecast, by Country 2020 & 2033
- Table 19: United Kingdom Intercity Electric Bus Revenue (undefined) Forecast, by Application 2020 & 2033
- Table 20: Germany Intercity Electric Bus Revenue (undefined) Forecast, by Application 2020 & 2033
- Table 21: France Intercity Electric Bus Revenue (undefined) Forecast, by Application 2020 & 2033
- Table 22: Italy Intercity Electric Bus Revenue (undefined) Forecast, by Application 2020 & 2033
- Table 23: Spain Intercity Electric Bus Revenue (undefined) Forecast, by Application 2020 & 2033
- Table 24: Russia Intercity Electric Bus Revenue (undefined) Forecast, by Application 2020 & 2033
- Table 25: Benelux Intercity Electric Bus Revenue (undefined) Forecast, by Application 2020 & 2033
- Table 26: Nordics Intercity Electric Bus Revenue (undefined) Forecast, by Application 2020 & 2033
- Table 27: Rest of Europe Intercity Electric Bus Revenue (undefined) Forecast, by Application 2020 & 2033
- Table 28: Global Intercity Electric Bus Revenue undefined Forecast, by Application 2020 & 2033
- Table 29: Global Intercity Electric Bus Revenue undefined Forecast, by Types 2020 & 2033
- Table 30: Global Intercity Electric Bus Revenue undefined Forecast, by Country 2020 & 2033
- Table 31: Turkey Intercity Electric Bus Revenue (undefined) Forecast, by Application 2020 & 2033
- Table 32: Israel Intercity Electric Bus Revenue (undefined) Forecast, by Application 2020 & 2033
- Table 33: GCC Intercity Electric Bus Revenue (undefined) Forecast, by Application 2020 & 2033
- Table 34: North Africa Intercity Electric Bus Revenue (undefined) Forecast, by Application 2020 & 2033
- Table 35: South Africa Intercity Electric Bus Revenue (undefined) Forecast, by Application 2020 & 2033
- Table 36: Rest of Middle East & Africa Intercity Electric Bus Revenue (undefined) Forecast, by Application 2020 & 2033
- Table 37: Global Intercity Electric Bus Revenue undefined Forecast, by Application 2020 & 2033
- Table 38: Global Intercity Electric Bus Revenue undefined Forecast, by Types 2020 & 2033
- Table 39: Global Intercity Electric Bus Revenue undefined Forecast, by Country 2020 & 2033
- Table 40: China Intercity Electric Bus Revenue (undefined) Forecast, by Application 2020 & 2033
- Table 41: India Intercity Electric Bus Revenue (undefined) Forecast, by Application 2020 & 2033
- Table 42: Japan Intercity Electric Bus Revenue (undefined) Forecast, by Application 2020 & 2033
- Table 43: South Korea Intercity Electric Bus Revenue (undefined) Forecast, by Application 2020 & 2033
- Table 44: ASEAN Intercity Electric Bus Revenue (undefined) Forecast, by Application 2020 & 2033
- Table 45: Oceania Intercity Electric Bus Revenue (undefined) Forecast, by Application 2020 & 2033
- Table 46: Rest of Asia Pacific Intercity Electric Bus Revenue (undefined) Forecast, by Application 2020 & 2033
Frequently Asked Questions
1. What is the projected Compound Annual Growth Rate (CAGR) of the Intercity Electric Bus?
The projected CAGR is approximately 14%.
2. Which companies are prominent players in the Intercity Electric Bus?
Key companies in the market include AB Volvo, BYD Company Ltd., Ebusco, EvoBus GmbH, Mitra Mobility Solution, Motor Coach Industries (MCI), PT MOBIL ANAK BANGSA (MAB), Scania, Solaris Bus and Coach sp. z o.o., YANGZHOU ASIASTAR BUS CO., LTD., Yinlong, YUTONG.
3. What are the main segments of the Intercity Electric Bus?
The market segments include Application, Types.
4. Can you provide details about the market size?
The market size is estimated to be USD XXX N/A as of 2022.
5. What are some drivers contributing to market growth?
N/A
6. What are the notable trends driving market growth?
N/A
7. Are there any restraints impacting market growth?
N/A
8. Can you provide examples of recent developments in the market?
N/A
9. What pricing options are available for accessing the report?
Pricing options include single-user, multi-user, and enterprise licenses priced at USD 4900.00, USD 7350.00, and USD 9800.00 respectively.
10. Is the market size provided in terms of value or volume?
The market size is provided in terms of value, measured in N/A.
11. Are there any specific market keywords associated with the report?
Yes, the market keyword associated with the report is "Intercity Electric Bus," which aids in identifying and referencing the specific market segment covered.
12. How do I determine which pricing option suits my needs best?
The pricing options vary based on user requirements and access needs. Individual users may opt for single-user licenses, while businesses requiring broader access may choose multi-user or enterprise licenses for cost-effective access to the report.
13. Are there any additional resources or data provided in the Intercity Electric Bus report?
While the report offers comprehensive insights, it's advisable to review the specific contents or supplementary materials provided to ascertain if additional resources or data are available.
14. How can I stay updated on further developments or reports in the Intercity Electric Bus?
To stay informed about further developments, trends, and reports in the Intercity Electric Bus, consider subscribing to industry newsletters, following relevant companies and organizations, or regularly checking reputable industry news sources and publications.
Methodology
Step 1 - Identification of Relevant Samples Size from Population Database


Step 2 - Approaches for Defining Global Market Size (Value, Volume* & Price*)

Note*: In applicable scenarios
Step 3 - Data Sources
Primary Research
- Web Analytics
- Survey Reports
- Research Institute
- Latest Research Reports
- Opinion Leaders
Secondary Research
- Annual Reports
- White Paper
- Latest Press Release
- Industry Association
- Paid Database
- Investor Presentations

Step 4 - Data Triangulation
Involves using different sources of information in order to increase the validity of a study
These sources are likely to be stakeholders in a program - participants, other researchers, program staff, other community members, and so on.
Then we put all data in single framework & apply various statistical tools to find out the dynamic on the market.
During the analysis stage, feedback from the stakeholder groups would be compared to determine areas of agreement as well as areas of divergence