

Key Insights
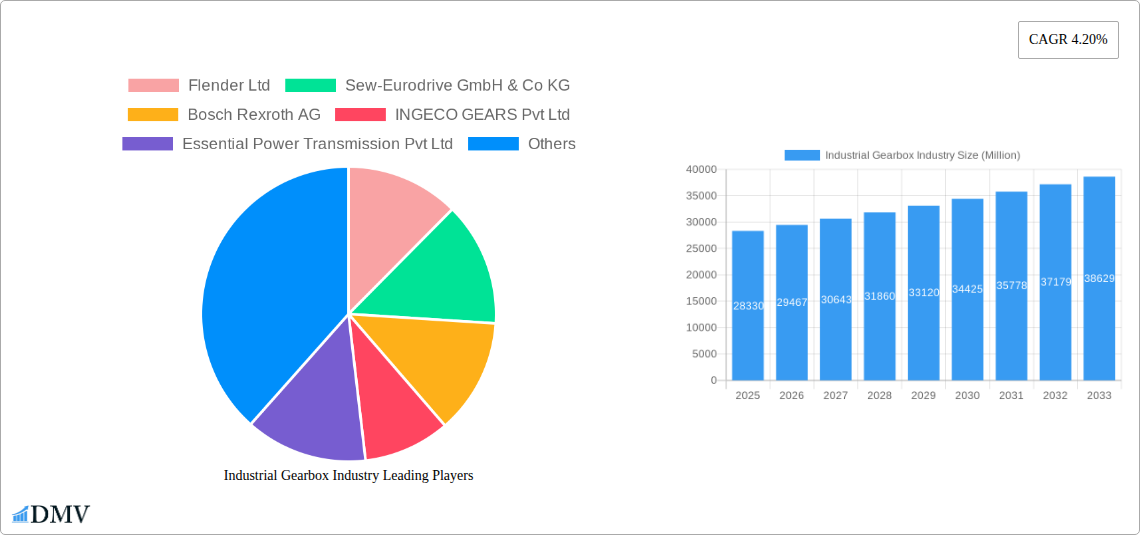
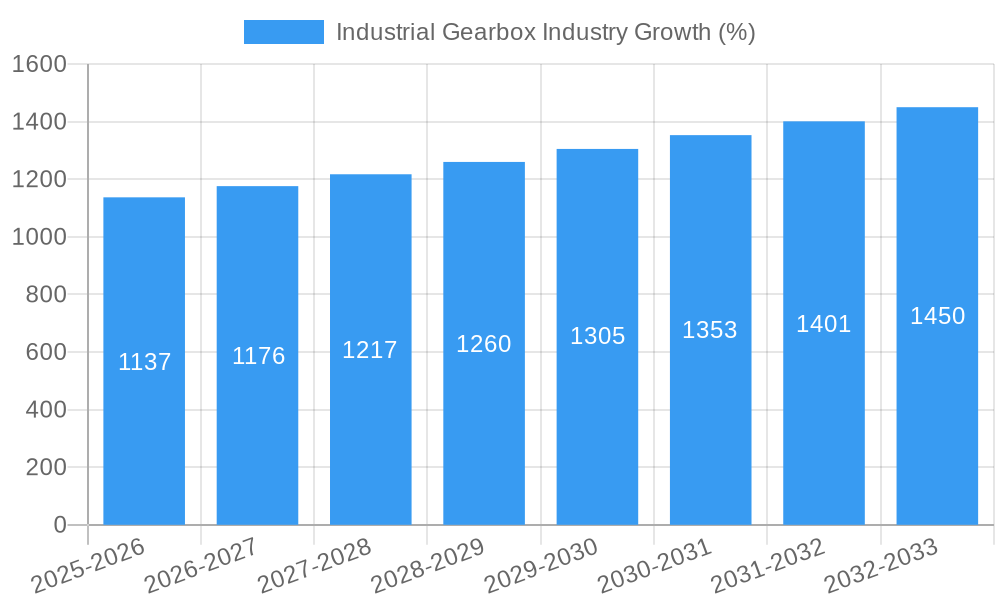
The global industrial gearbox market, valued at $28.33 billion in 2025, is projected to experience robust growth, driven by increasing automation across various industries and a rising demand for energy-efficient solutions. A compound annual growth rate (CAGR) of 4.20% from 2025 to 2033 indicates a significant expansion, particularly fueled by the power generation, steel manufacturing, mining, and wastewater treatment sectors. The diverse application segments, including worm, helical, bevel helical, and planetary gearboxes, cater to the specific needs of different industrial processes. Key market players like Flender, Sew-Eurodrive, and Bosch Rexroth are leveraging technological advancements and strategic partnerships to enhance their market share. Geographic expansion, particularly in rapidly developing economies of Asia-Pacific and South America, presents lucrative opportunities for growth. However, factors like the volatility of raw material prices and stringent environmental regulations could pose challenges to the market's consistent expansion. The consistent adoption of Industry 4.0 technologies and a rising need for precise and efficient transmission systems are expected to further accelerate market growth.
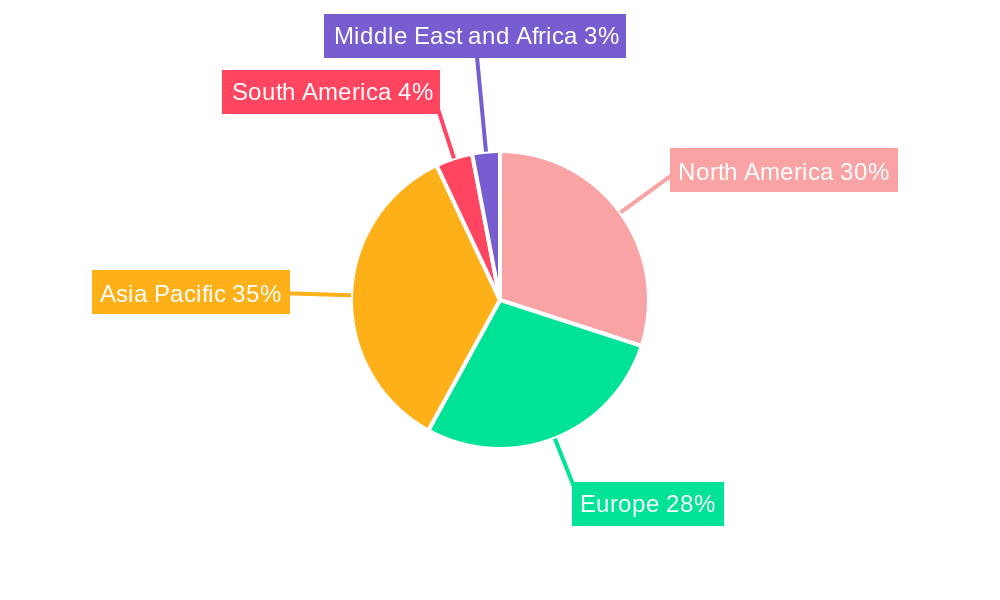
The market segmentation reveals a strong demand for various gearbox types, with helical and planetary gearboxes likely dominating due to their versatility and efficiency in diverse applications. Regional variations exist, with North America and Europe currently holding significant market shares due to established industrial infrastructure. However, the Asia-Pacific region is anticipated to witness the highest growth rate due to its burgeoning industrialization and infrastructure development projects. Competitive dynamics are characterized by both established multinational corporations and regional players, leading to innovation in gearbox design, materials, and manufacturing processes. Future growth will likely be influenced by advancements in materials science resulting in lighter, stronger, and more durable gearboxes, along with a greater focus on predictive maintenance and digitalization for optimized performance and reduced downtime.
Industrial Gearbox Industry Market Report: 2019-2033
This comprehensive report provides an in-depth analysis of the Industrial Gearbox Industry, projecting a market valuation exceeding $XX Million by 2033. The study covers the period from 2019 to 2033, with 2025 serving as the base and estimated year. We examine key market segments, leading players, and future growth trajectories, offering invaluable insights for stakeholders seeking to navigate this dynamic sector.
Industrial Gearbox Industry Market Composition & Trends
The global industrial gearbox market, valued at $XX Million in 2024, is characterized by moderate concentration, with several key players commanding significant market share. Flender Ltd, Sew-Eurodrive GmbH & Co KG, and Bosch Rexroth AG are among the prominent companies shaping the landscape. Market share distribution is dynamic, with ongoing mergers and acquisitions (M&A) activity influencing the competitive dynamics. Innovation is driven by the need for enhanced efficiency, durability, and reduced energy consumption. Stringent regulatory frameworks regarding energy efficiency and safety standards are also crucial drivers. Substitute products, while limited, exert some pressure. End-users span diverse sectors including power generation, steel manufacturing, mining, and wastewater treatment.
- Market Concentration: Moderately concentrated, with top 5 players holding approximately XX% market share.
- Innovation Catalysts: Demand for energy-efficient gearboxes, advancements in materials science, and Industry 4.0 integration.
- Regulatory Landscape: Stringent emission norms and safety regulations influence product design and manufacturing.
- Substitute Products: Limited substitutes exist, mainly in niche applications, but competition from alternative power transmission solutions remains a factor.
- End-User Profiles: Power industry, steel industry, mines & minerals, wastewater treatment, manufacturing industry and others.
- M&A Activity: Recent deals, such as the Airbus Helicopters acquisition of ZF Luftfahrttechnik, signal ongoing consolidation and expansion strategies within the industry, with total deal values estimated to exceed $XX Million in the past 5 years.
Industrial Gearbox Industry Industry Evolution
The industrial gearbox market has witnessed consistent growth over the historical period (2019-2024), expanding at a CAGR of XX%. This growth is primarily attributed to increasing industrialization globally, particularly in developing economies. Technological advancements, such as the integration of advanced materials and digital technologies like IoT sensors for predictive maintenance, are revolutionizing gearbox design and operation. Shifting consumer demands, focusing on enhanced efficiency and reduced downtime, are driving the adoption of high-performance gearboxes. Growth is expected to continue in the forecast period (2025-2033), with a projected CAGR of XX%, driven by factors like renewable energy expansion and automation in various sectors.
- Growth Trajectories: Consistent growth driven by industrial expansion and technological advancements.
- Technological Advancements: Adoption of advanced materials, improved manufacturing processes, and digitalization.
- Shifting Consumer Demands: Focus on higher efficiency, longer lifespan, and reduced maintenance costs.
Leading Regions, Countries, or Segments in Industrial Gearbox Industry
The Asia-Pacific region currently holds the largest market share in the industrial gearbox industry, driven by robust industrial growth in countries like China and India. Within gearbox types, helical gearboxes maintain significant dominance due to their versatility and cost-effectiveness. The power industry remains a leading application segment due to the large-scale deployment of power generation and transmission infrastructure.
- Key Drivers (Asia-Pacific): Rapid industrialization, significant infrastructure development, and increasing government investments in energy and manufacturing sectors.
- Key Drivers (Helical Gearboxes): High efficiency, adaptability to various applications, and relatively lower cost compared to other gearbox types.
- Key Drivers (Power Industry): Large-scale power generation and transmission projects, expansion of renewable energy sources, and upgrading of existing infrastructure.
Industrial Gearbox Industry Product Innovations
Recent product innovations focus on improving efficiency, durability, and reducing noise levels. The incorporation of advanced materials, like high-strength alloys and composites, enhances gearbox performance and lifespan. Smart gearboxes with integrated sensors and predictive maintenance capabilities are gaining traction, minimizing downtime and optimizing operational efficiency. These innovations address the growing need for reliable, energy-efficient, and cost-effective power transmission solutions across diverse industries.
Propelling Factors for Industrial Gearbox Industry Growth
Several factors fuel the growth of the industrial gearbox market. Technological advancements, such as the development of lighter, stronger materials and sophisticated control systems, enhance efficiency and reliability. The increasing demand for automation across various industries, especially in manufacturing and logistics, fuels demand for high-performance gearboxes. Supportive government policies and investments in infrastructure projects, especially in developing economies, further bolster market expansion. The transition towards renewable energy sources also creates significant opportunities for the industrial gearbox industry.
Obstacles in the Industrial Gearbox Industry Market
The industrial gearbox market faces challenges such as fluctuating raw material prices, which impact production costs. Supply chain disruptions, particularly in the wake of global events, can impede production and delivery timelines. Intense competition among established players and the emergence of new entrants create pricing pressure. Moreover, stringent regulatory compliance requirements add to the cost of product development and manufacturing. These factors collectively affect market growth and profitability.
Future Opportunities in Industrial Gearbox Industry
Future opportunities lie in the adoption of advanced technologies such as AI-powered predictive maintenance and the integration of robotics. The expansion of renewable energy infrastructure and the electrification of transportation will drive demand for specific gearbox types. Emerging markets in developing economies also present significant growth potential. Focus on sustainable manufacturing practices and circular economy principles will be crucial for long-term success.
Major Players in the Industrial Gearbox Industry Ecosystem
- Flender Ltd
- Sew-Eurodrive GmbH & Co KG
- Bosch Rexroth AG
- INGECO GEARS Pvt Ltd
- Essential Power Transmission Pvt Ltd
- Getriebebau NORD GmbH & Co KG
- Nanjing High Accurate Drive Equipment Manufacturing Group Co Ltd
- Zollern GmbH & Co KG
- Lenze SE
- Kngear
- Elecon Engineering Company Limited
- Bonfiglioli Drives Co Ltd
Key Developments in Industrial Gearbox Industry Industry
- May 2023: Triumph Group, Inc. secured a long-term agreement with General Electric (GE) for the supply of thousands of integral gearboxes (IGBs) annually for the next decade, representing a significant boost to its revenue stream and strengthening its position in the aerospace sector.
- January 2023: Airbus Helicopters' acquisition of ZF Luftfahrttechnik enhances its in-house transmission production capabilities, potentially impacting the competitive landscape and driving further consolidation in the industry.
Strategic Industrial Gearbox Industry Market Forecast
The industrial gearbox market is poised for sustained growth, driven by the confluence of technological innovation, increasing industrial automation, and the expansion of renewable energy. The focus on energy efficiency, predictive maintenance, and customized solutions will shape future market dynamics. Emerging markets and evolving application sectors offer significant untapped potential for market expansion, promising continued growth throughout the forecast period.
Industrial Gearbox Industry Segmentation
-
1. Type
- 1.1. Worm Gearbox
- 1.2. Helical Gearbox
- 1.3. Bevel Helical Gearbox
- 1.4. Planetary Gearbox
- 1.5. Other Types
-
2. Application
- 2.1. Power Industry
- 2.2. Steel Industry
- 2.3. Mines and Minerals Industry
- 2.4. Wastewater Treatment Industry
- 2.5. Manufacturing Industry
- 2.6. Other Applications
Industrial Gearbox Industry Segmentation By Geography
-
1. North America
- 1.1. United States
- 1.2. Canada
- 1.3. Rest of North America
-
2. Europe
- 2.1. Germany
- 2.2. France
- 2.3. United Kingdom
- 2.4. Rest of Europe
-
3. Asia Pacific
- 3.1. China
- 3.2. India
- 3.3. Japan
- 3.4. South Korea
- 3.5. Rest of Asia Pacific
-
4. South America
- 4.1. Brazil
- 4.2. Argentina
- 4.3. Rest of South America
-
5. Middle East and Africa
- 5.1. Saudi Arabia
- 5.2. United Arab Emirates
- 5.3. South Africa
- 5.4. Rest of Middle East and Africa
Industrial Gearbox Industry REPORT HIGHLIGHTS
| Aspects | Details |
|---|---|
| Study Period | 2019-2033 |
| Base Year | 2024 |
| Estimated Year | 2025 |
| Forecast Period | 2025-2033 |
| Historical Period | 2019-2024 |
| Growth Rate | CAGR of 4.20% from 2019-2033 |
| Segmentation |
|
Table of Contents
- 1. Introduction
- 1.1. Research Scope
- 1.2. Market Segmentation
- 1.3. Research Methodology
- 1.4. Definitions and Assumptions
- 2. Executive Summary
- 2.1. Introduction
- 3. Market Dynamics
- 3.1. Introduction
- 3.2. Market Drivers
- 3.2.1. 4.; Growing Adoption of Industrial Automation across Various Industrial Sectors4.; Rising Sales for Automobiles across the World
- 3.3. Market Restrains
- 3.3.1. 4.; Slow Down in Economic and Industrial Activities
- 3.4. Market Trends
- 3.4.1. Helical Gearbox Type Segment to Dominate the Market
- 4. Market Factor Analysis
- 4.1. Porters Five Forces
- 4.2. Supply/Value Chain
- 4.3. PESTEL analysis
- 4.4. Market Entropy
- 4.5. Patent/Trademark Analysis
- 5. Global Industrial Gearbox Industry Analysis, Insights and Forecast, 2019-2031
- 5.1. Market Analysis, Insights and Forecast - by Type
- 5.1.1. Worm Gearbox
- 5.1.2. Helical Gearbox
- 5.1.3. Bevel Helical Gearbox
- 5.1.4. Planetary Gearbox
- 5.1.5. Other Types
- 5.2. Market Analysis, Insights and Forecast - by Application
- 5.2.1. Power Industry
- 5.2.2. Steel Industry
- 5.2.3. Mines and Minerals Industry
- 5.2.4. Wastewater Treatment Industry
- 5.2.5. Manufacturing Industry
- 5.2.6. Other Applications
- 5.3. Market Analysis, Insights and Forecast - by Region
- 5.3.1. North America
- 5.3.2. Europe
- 5.3.3. Asia Pacific
- 5.3.4. South America
- 5.3.5. Middle East and Africa
- 5.1. Market Analysis, Insights and Forecast - by Type
- 6. North America Industrial Gearbox Industry Analysis, Insights and Forecast, 2019-2031
- 6.1. Market Analysis, Insights and Forecast - by Type
- 6.1.1. Worm Gearbox
- 6.1.2. Helical Gearbox
- 6.1.3. Bevel Helical Gearbox
- 6.1.4. Planetary Gearbox
- 6.1.5. Other Types
- 6.2. Market Analysis, Insights and Forecast - by Application
- 6.2.1. Power Industry
- 6.2.2. Steel Industry
- 6.2.3. Mines and Minerals Industry
- 6.2.4. Wastewater Treatment Industry
- 6.2.5. Manufacturing Industry
- 6.2.6. Other Applications
- 6.1. Market Analysis, Insights and Forecast - by Type
- 7. Europe Industrial Gearbox Industry Analysis, Insights and Forecast, 2019-2031
- 7.1. Market Analysis, Insights and Forecast - by Type
- 7.1.1. Worm Gearbox
- 7.1.2. Helical Gearbox
- 7.1.3. Bevel Helical Gearbox
- 7.1.4. Planetary Gearbox
- 7.1.5. Other Types
- 7.2. Market Analysis, Insights and Forecast - by Application
- 7.2.1. Power Industry
- 7.2.2. Steel Industry
- 7.2.3. Mines and Minerals Industry
- 7.2.4. Wastewater Treatment Industry
- 7.2.5. Manufacturing Industry
- 7.2.6. Other Applications
- 7.1. Market Analysis, Insights and Forecast - by Type
- 8. Asia Pacific Industrial Gearbox Industry Analysis, Insights and Forecast, 2019-2031
- 8.1. Market Analysis, Insights and Forecast - by Type
- 8.1.1. Worm Gearbox
- 8.1.2. Helical Gearbox
- 8.1.3. Bevel Helical Gearbox
- 8.1.4. Planetary Gearbox
- 8.1.5. Other Types
- 8.2. Market Analysis, Insights and Forecast - by Application
- 8.2.1. Power Industry
- 8.2.2. Steel Industry
- 8.2.3. Mines and Minerals Industry
- 8.2.4. Wastewater Treatment Industry
- 8.2.5. Manufacturing Industry
- 8.2.6. Other Applications
- 8.1. Market Analysis, Insights and Forecast - by Type
- 9. South America Industrial Gearbox Industry Analysis, Insights and Forecast, 2019-2031
- 9.1. Market Analysis, Insights and Forecast - by Type
- 9.1.1. Worm Gearbox
- 9.1.2. Helical Gearbox
- 9.1.3. Bevel Helical Gearbox
- 9.1.4. Planetary Gearbox
- 9.1.5. Other Types
- 9.2. Market Analysis, Insights and Forecast - by Application
- 9.2.1. Power Industry
- 9.2.2. Steel Industry
- 9.2.3. Mines and Minerals Industry
- 9.2.4. Wastewater Treatment Industry
- 9.2.5. Manufacturing Industry
- 9.2.6. Other Applications
- 9.1. Market Analysis, Insights and Forecast - by Type
- 10. Middle East and Africa Industrial Gearbox Industry Analysis, Insights and Forecast, 2019-2031
- 10.1. Market Analysis, Insights and Forecast - by Type
- 10.1.1. Worm Gearbox
- 10.1.2. Helical Gearbox
- 10.1.3. Bevel Helical Gearbox
- 10.1.4. Planetary Gearbox
- 10.1.5. Other Types
- 10.2. Market Analysis, Insights and Forecast - by Application
- 10.2.1. Power Industry
- 10.2.2. Steel Industry
- 10.2.3. Mines and Minerals Industry
- 10.2.4. Wastewater Treatment Industry
- 10.2.5. Manufacturing Industry
- 10.2.6. Other Applications
- 10.1. Market Analysis, Insights and Forecast - by Type
- 11. North America Industrial Gearbox Industry Analysis, Insights and Forecast, 2019-2031
- 11.1. Market Analysis, Insights and Forecast - By Country/Sub-region
- 11.1.1 United States
- 11.1.2 Canada
- 11.1.3 Rest of North America
- 12. Europe Industrial Gearbox Industry Analysis, Insights and Forecast, 2019-2031
- 12.1. Market Analysis, Insights and Forecast - By Country/Sub-region
- 12.1.1 Germany
- 12.1.2 France
- 12.1.3 United Kingdom
- 12.1.4 Rest of Europe
- 13. Asia Pacific Industrial Gearbox Industry Analysis, Insights and Forecast, 2019-2031
- 13.1. Market Analysis, Insights and Forecast - By Country/Sub-region
- 13.1.1 China
- 13.1.2 India
- 13.1.3 Japan
- 13.1.4 South Korea
- 13.1.5 Rest of Asia Pacific
- 14. South America Industrial Gearbox Industry Analysis, Insights and Forecast, 2019-2031
- 14.1. Market Analysis, Insights and Forecast - By Country/Sub-region
- 14.1.1 Brazil
- 14.1.2 Argentina
- 14.1.3 Rest of South America
- 15. Middle East and Africa Industrial Gearbox Industry Analysis, Insights and Forecast, 2019-2031
- 15.1. Market Analysis, Insights and Forecast - By Country/Sub-region
- 15.1.1 Saudi Arabia
- 15.1.2 United Arab Emirates
- 15.1.3 South Africa
- 15.1.4 Rest of Middle East and Africa
- 16. Competitive Analysis
- 16.1. Global Market Share Analysis 2024
- 16.2. Company Profiles
- 16.2.1 Flender Ltd
- 16.2.1.1. Overview
- 16.2.1.2. Products
- 16.2.1.3. SWOT Analysis
- 16.2.1.4. Recent Developments
- 16.2.1.5. Financials (Based on Availability)
- 16.2.2 Sew-Eurodrive GmbH & Co KG
- 16.2.2.1. Overview
- 16.2.2.2. Products
- 16.2.2.3. SWOT Analysis
- 16.2.2.4. Recent Developments
- 16.2.2.5. Financials (Based on Availability)
- 16.2.3 Bosch Rexroth AG
- 16.2.3.1. Overview
- 16.2.3.2. Products
- 16.2.3.3. SWOT Analysis
- 16.2.3.4. Recent Developments
- 16.2.3.5. Financials (Based on Availability)
- 16.2.4 INGECO GEARS Pvt Ltd
- 16.2.4.1. Overview
- 16.2.4.2. Products
- 16.2.4.3. SWOT Analysis
- 16.2.4.4. Recent Developments
- 16.2.4.5. Financials (Based on Availability)
- 16.2.5 Essential Power Transmission Pvt Ltd
- 16.2.5.1. Overview
- 16.2.5.2. Products
- 16.2.5.3. SWOT Analysis
- 16.2.5.4. Recent Developments
- 16.2.5.5. Financials (Based on Availability)
- 16.2.6 Getriebebau NORD GmbH & Co KG
- 16.2.6.1. Overview
- 16.2.6.2. Products
- 16.2.6.3. SWOT Analysis
- 16.2.6.4. Recent Developments
- 16.2.6.5. Financials (Based on Availability)
- 16.2.7 Nanjing High Accurate Drive Equipment Manufacturing Group Co Ltd
- 16.2.7.1. Overview
- 16.2.7.2. Products
- 16.2.7.3. SWOT Analysis
- 16.2.7.4. Recent Developments
- 16.2.7.5. Financials (Based on Availability)
- 16.2.8 Zollern GmbH & Co KG
- 16.2.8.1. Overview
- 16.2.8.2. Products
- 16.2.8.3. SWOT Analysis
- 16.2.8.4. Recent Developments
- 16.2.8.5. Financials (Based on Availability)
- 16.2.9 Lenze SE
- 16.2.9.1. Overview
- 16.2.9.2. Products
- 16.2.9.3. SWOT Analysis
- 16.2.9.4. Recent Developments
- 16.2.9.5. Financials (Based on Availability)
- 16.2.10 Kngear
- 16.2.10.1. Overview
- 16.2.10.2. Products
- 16.2.10.3. SWOT Analysis
- 16.2.10.4. Recent Developments
- 16.2.10.5. Financials (Based on Availability)
- 16.2.11 Elecon Engineering Company Limited
- 16.2.11.1. Overview
- 16.2.11.2. Products
- 16.2.11.3. SWOT Analysis
- 16.2.11.4. Recent Developments
- 16.2.11.5. Financials (Based on Availability)
- 16.2.12 Bonfiglioli Drives Co Ltd
- 16.2.12.1. Overview
- 16.2.12.2. Products
- 16.2.12.3. SWOT Analysis
- 16.2.12.4. Recent Developments
- 16.2.12.5. Financials (Based on Availability)
- 16.2.1 Flender Ltd
List of Figures
- Figure 1: Global Industrial Gearbox Industry Revenue Breakdown (Million, %) by Region 2024 & 2032
- Figure 2: Global Industrial Gearbox Industry Volume Breakdown (K Unit, %) by Region 2024 & 2032
- Figure 3: North America Industrial Gearbox Industry Revenue (Million), by Country 2024 & 2032
- Figure 4: North America Industrial Gearbox Industry Volume (K Unit), by Country 2024 & 2032
- Figure 5: North America Industrial Gearbox Industry Revenue Share (%), by Country 2024 & 2032
- Figure 6: North America Industrial Gearbox Industry Volume Share (%), by Country 2024 & 2032
- Figure 7: Europe Industrial Gearbox Industry Revenue (Million), by Country 2024 & 2032
- Figure 8: Europe Industrial Gearbox Industry Volume (K Unit), by Country 2024 & 2032
- Figure 9: Europe Industrial Gearbox Industry Revenue Share (%), by Country 2024 & 2032
- Figure 10: Europe Industrial Gearbox Industry Volume Share (%), by Country 2024 & 2032
- Figure 11: Asia Pacific Industrial Gearbox Industry Revenue (Million), by Country 2024 & 2032
- Figure 12: Asia Pacific Industrial Gearbox Industry Volume (K Unit), by Country 2024 & 2032
- Figure 13: Asia Pacific Industrial Gearbox Industry Revenue Share (%), by Country 2024 & 2032
- Figure 14: Asia Pacific Industrial Gearbox Industry Volume Share (%), by Country 2024 & 2032
- Figure 15: South America Industrial Gearbox Industry Revenue (Million), by Country 2024 & 2032
- Figure 16: South America Industrial Gearbox Industry Volume (K Unit), by Country 2024 & 2032
- Figure 17: South America Industrial Gearbox Industry Revenue Share (%), by Country 2024 & 2032
- Figure 18: South America Industrial Gearbox Industry Volume Share (%), by Country 2024 & 2032
- Figure 19: Middle East and Africa Industrial Gearbox Industry Revenue (Million), by Country 2024 & 2032
- Figure 20: Middle East and Africa Industrial Gearbox Industry Volume (K Unit), by Country 2024 & 2032
- Figure 21: Middle East and Africa Industrial Gearbox Industry Revenue Share (%), by Country 2024 & 2032
- Figure 22: Middle East and Africa Industrial Gearbox Industry Volume Share (%), by Country 2024 & 2032
- Figure 23: North America Industrial Gearbox Industry Revenue (Million), by Type 2024 & 2032
- Figure 24: North America Industrial Gearbox Industry Volume (K Unit), by Type 2024 & 2032
- Figure 25: North America Industrial Gearbox Industry Revenue Share (%), by Type 2024 & 2032
- Figure 26: North America Industrial Gearbox Industry Volume Share (%), by Type 2024 & 2032
- Figure 27: North America Industrial Gearbox Industry Revenue (Million), by Application 2024 & 2032
- Figure 28: North America Industrial Gearbox Industry Volume (K Unit), by Application 2024 & 2032
- Figure 29: North America Industrial Gearbox Industry Revenue Share (%), by Application 2024 & 2032
- Figure 30: North America Industrial Gearbox Industry Volume Share (%), by Application 2024 & 2032
- Figure 31: North America Industrial Gearbox Industry Revenue (Million), by Country 2024 & 2032
- Figure 32: North America Industrial Gearbox Industry Volume (K Unit), by Country 2024 & 2032
- Figure 33: North America Industrial Gearbox Industry Revenue Share (%), by Country 2024 & 2032
- Figure 34: North America Industrial Gearbox Industry Volume Share (%), by Country 2024 & 2032
- Figure 35: Europe Industrial Gearbox Industry Revenue (Million), by Type 2024 & 2032
- Figure 36: Europe Industrial Gearbox Industry Volume (K Unit), by Type 2024 & 2032
- Figure 37: Europe Industrial Gearbox Industry Revenue Share (%), by Type 2024 & 2032
- Figure 38: Europe Industrial Gearbox Industry Volume Share (%), by Type 2024 & 2032
- Figure 39: Europe Industrial Gearbox Industry Revenue (Million), by Application 2024 & 2032
- Figure 40: Europe Industrial Gearbox Industry Volume (K Unit), by Application 2024 & 2032
- Figure 41: Europe Industrial Gearbox Industry Revenue Share (%), by Application 2024 & 2032
- Figure 42: Europe Industrial Gearbox Industry Volume Share (%), by Application 2024 & 2032
- Figure 43: Europe Industrial Gearbox Industry Revenue (Million), by Country 2024 & 2032
- Figure 44: Europe Industrial Gearbox Industry Volume (K Unit), by Country 2024 & 2032
- Figure 45: Europe Industrial Gearbox Industry Revenue Share (%), by Country 2024 & 2032
- Figure 46: Europe Industrial Gearbox Industry Volume Share (%), by Country 2024 & 2032
- Figure 47: Asia Pacific Industrial Gearbox Industry Revenue (Million), by Type 2024 & 2032
- Figure 48: Asia Pacific Industrial Gearbox Industry Volume (K Unit), by Type 2024 & 2032
- Figure 49: Asia Pacific Industrial Gearbox Industry Revenue Share (%), by Type 2024 & 2032
- Figure 50: Asia Pacific Industrial Gearbox Industry Volume Share (%), by Type 2024 & 2032
- Figure 51: Asia Pacific Industrial Gearbox Industry Revenue (Million), by Application 2024 & 2032
- Figure 52: Asia Pacific Industrial Gearbox Industry Volume (K Unit), by Application 2024 & 2032
- Figure 53: Asia Pacific Industrial Gearbox Industry Revenue Share (%), by Application 2024 & 2032
- Figure 54: Asia Pacific Industrial Gearbox Industry Volume Share (%), by Application 2024 & 2032
- Figure 55: Asia Pacific Industrial Gearbox Industry Revenue (Million), by Country 2024 & 2032
- Figure 56: Asia Pacific Industrial Gearbox Industry Volume (K Unit), by Country 2024 & 2032
- Figure 57: Asia Pacific Industrial Gearbox Industry Revenue Share (%), by Country 2024 & 2032
- Figure 58: Asia Pacific Industrial Gearbox Industry Volume Share (%), by Country 2024 & 2032
- Figure 59: South America Industrial Gearbox Industry Revenue (Million), by Type 2024 & 2032
- Figure 60: South America Industrial Gearbox Industry Volume (K Unit), by Type 2024 & 2032
- Figure 61: South America Industrial Gearbox Industry Revenue Share (%), by Type 2024 & 2032
- Figure 62: South America Industrial Gearbox Industry Volume Share (%), by Type 2024 & 2032
- Figure 63: South America Industrial Gearbox Industry Revenue (Million), by Application 2024 & 2032
- Figure 64: South America Industrial Gearbox Industry Volume (K Unit), by Application 2024 & 2032
- Figure 65: South America Industrial Gearbox Industry Revenue Share (%), by Application 2024 & 2032
- Figure 66: South America Industrial Gearbox Industry Volume Share (%), by Application 2024 & 2032
- Figure 67: South America Industrial Gearbox Industry Revenue (Million), by Country 2024 & 2032
- Figure 68: South America Industrial Gearbox Industry Volume (K Unit), by Country 2024 & 2032
- Figure 69: South America Industrial Gearbox Industry Revenue Share (%), by Country 2024 & 2032
- Figure 70: South America Industrial Gearbox Industry Volume Share (%), by Country 2024 & 2032
- Figure 71: Middle East and Africa Industrial Gearbox Industry Revenue (Million), by Type 2024 & 2032
- Figure 72: Middle East and Africa Industrial Gearbox Industry Volume (K Unit), by Type 2024 & 2032
- Figure 73: Middle East and Africa Industrial Gearbox Industry Revenue Share (%), by Type 2024 & 2032
- Figure 74: Middle East and Africa Industrial Gearbox Industry Volume Share (%), by Type 2024 & 2032
- Figure 75: Middle East and Africa Industrial Gearbox Industry Revenue (Million), by Application 2024 & 2032
- Figure 76: Middle East and Africa Industrial Gearbox Industry Volume (K Unit), by Application 2024 & 2032
- Figure 77: Middle East and Africa Industrial Gearbox Industry Revenue Share (%), by Application 2024 & 2032
- Figure 78: Middle East and Africa Industrial Gearbox Industry Volume Share (%), by Application 2024 & 2032
- Figure 79: Middle East and Africa Industrial Gearbox Industry Revenue (Million), by Country 2024 & 2032
- Figure 80: Middle East and Africa Industrial Gearbox Industry Volume (K Unit), by Country 2024 & 2032
- Figure 81: Middle East and Africa Industrial Gearbox Industry Revenue Share (%), by Country 2024 & 2032
- Figure 82: Middle East and Africa Industrial Gearbox Industry Volume Share (%), by Country 2024 & 2032
List of Tables
- Table 1: Global Industrial Gearbox Industry Revenue Million Forecast, by Region 2019 & 2032
- Table 2: Global Industrial Gearbox Industry Volume K Unit Forecast, by Region 2019 & 2032
- Table 3: Global Industrial Gearbox Industry Revenue Million Forecast, by Type 2019 & 2032
- Table 4: Global Industrial Gearbox Industry Volume K Unit Forecast, by Type 2019 & 2032
- Table 5: Global Industrial Gearbox Industry Revenue Million Forecast, by Application 2019 & 2032
- Table 6: Global Industrial Gearbox Industry Volume K Unit Forecast, by Application 2019 & 2032
- Table 7: Global Industrial Gearbox Industry Revenue Million Forecast, by Region 2019 & 2032
- Table 8: Global Industrial Gearbox Industry Volume K Unit Forecast, by Region 2019 & 2032
- Table 9: Global Industrial Gearbox Industry Revenue Million Forecast, by Country 2019 & 2032
- Table 10: Global Industrial Gearbox Industry Volume K Unit Forecast, by Country 2019 & 2032
- Table 11: United States Industrial Gearbox Industry Revenue (Million) Forecast, by Application 2019 & 2032
- Table 12: United States Industrial Gearbox Industry Volume (K Unit) Forecast, by Application 2019 & 2032
- Table 13: Canada Industrial Gearbox Industry Revenue (Million) Forecast, by Application 2019 & 2032
- Table 14: Canada Industrial Gearbox Industry Volume (K Unit) Forecast, by Application 2019 & 2032
- Table 15: Rest of North America Industrial Gearbox Industry Revenue (Million) Forecast, by Application 2019 & 2032
- Table 16: Rest of North America Industrial Gearbox Industry Volume (K Unit) Forecast, by Application 2019 & 2032
- Table 17: Global Industrial Gearbox Industry Revenue Million Forecast, by Country 2019 & 2032
- Table 18: Global Industrial Gearbox Industry Volume K Unit Forecast, by Country 2019 & 2032
- Table 19: Germany Industrial Gearbox Industry Revenue (Million) Forecast, by Application 2019 & 2032
- Table 20: Germany Industrial Gearbox Industry Volume (K Unit) Forecast, by Application 2019 & 2032
- Table 21: France Industrial Gearbox Industry Revenue (Million) Forecast, by Application 2019 & 2032
- Table 22: France Industrial Gearbox Industry Volume (K Unit) Forecast, by Application 2019 & 2032
- Table 23: United Kingdom Industrial Gearbox Industry Revenue (Million) Forecast, by Application 2019 & 2032
- Table 24: United Kingdom Industrial Gearbox Industry Volume (K Unit) Forecast, by Application 2019 & 2032
- Table 25: Rest of Europe Industrial Gearbox Industry Revenue (Million) Forecast, by Application 2019 & 2032
- Table 26: Rest of Europe Industrial Gearbox Industry Volume (K Unit) Forecast, by Application 2019 & 2032
- Table 27: Global Industrial Gearbox Industry Revenue Million Forecast, by Country 2019 & 2032
- Table 28: Global Industrial Gearbox Industry Volume K Unit Forecast, by Country 2019 & 2032
- Table 29: China Industrial Gearbox Industry Revenue (Million) Forecast, by Application 2019 & 2032
- Table 30: China Industrial Gearbox Industry Volume (K Unit) Forecast, by Application 2019 & 2032
- Table 31: India Industrial Gearbox Industry Revenue (Million) Forecast, by Application 2019 & 2032
- Table 32: India Industrial Gearbox Industry Volume (K Unit) Forecast, by Application 2019 & 2032
- Table 33: Japan Industrial Gearbox Industry Revenue (Million) Forecast, by Application 2019 & 2032
- Table 34: Japan Industrial Gearbox Industry Volume (K Unit) Forecast, by Application 2019 & 2032
- Table 35: South Korea Industrial Gearbox Industry Revenue (Million) Forecast, by Application 2019 & 2032
- Table 36: South Korea Industrial Gearbox Industry Volume (K Unit) Forecast, by Application 2019 & 2032
- Table 37: Rest of Asia Pacific Industrial Gearbox Industry Revenue (Million) Forecast, by Application 2019 & 2032
- Table 38: Rest of Asia Pacific Industrial Gearbox Industry Volume (K Unit) Forecast, by Application 2019 & 2032
- Table 39: Global Industrial Gearbox Industry Revenue Million Forecast, by Country 2019 & 2032
- Table 40: Global Industrial Gearbox Industry Volume K Unit Forecast, by Country 2019 & 2032
- Table 41: Brazil Industrial Gearbox Industry Revenue (Million) Forecast, by Application 2019 & 2032
- Table 42: Brazil Industrial Gearbox Industry Volume (K Unit) Forecast, by Application 2019 & 2032
- Table 43: Argentina Industrial Gearbox Industry Revenue (Million) Forecast, by Application 2019 & 2032
- Table 44: Argentina Industrial Gearbox Industry Volume (K Unit) Forecast, by Application 2019 & 2032
- Table 45: Rest of South America Industrial Gearbox Industry Revenue (Million) Forecast, by Application 2019 & 2032
- Table 46: Rest of South America Industrial Gearbox Industry Volume (K Unit) Forecast, by Application 2019 & 2032
- Table 47: Global Industrial Gearbox Industry Revenue Million Forecast, by Country 2019 & 2032
- Table 48: Global Industrial Gearbox Industry Volume K Unit Forecast, by Country 2019 & 2032
- Table 49: Saudi Arabia Industrial Gearbox Industry Revenue (Million) Forecast, by Application 2019 & 2032
- Table 50: Saudi Arabia Industrial Gearbox Industry Volume (K Unit) Forecast, by Application 2019 & 2032
- Table 51: United Arab Emirates Industrial Gearbox Industry Revenue (Million) Forecast, by Application 2019 & 2032
- Table 52: United Arab Emirates Industrial Gearbox Industry Volume (K Unit) Forecast, by Application 2019 & 2032
- Table 53: South Africa Industrial Gearbox Industry Revenue (Million) Forecast, by Application 2019 & 2032
- Table 54: South Africa Industrial Gearbox Industry Volume (K Unit) Forecast, by Application 2019 & 2032
- Table 55: Rest of Middle East and Africa Industrial Gearbox Industry Revenue (Million) Forecast, by Application 2019 & 2032
- Table 56: Rest of Middle East and Africa Industrial Gearbox Industry Volume (K Unit) Forecast, by Application 2019 & 2032
- Table 57: Global Industrial Gearbox Industry Revenue Million Forecast, by Type 2019 & 2032
- Table 58: Global Industrial Gearbox Industry Volume K Unit Forecast, by Type 2019 & 2032
- Table 59: Global Industrial Gearbox Industry Revenue Million Forecast, by Application 2019 & 2032
- Table 60: Global Industrial Gearbox Industry Volume K Unit Forecast, by Application 2019 & 2032
- Table 61: Global Industrial Gearbox Industry Revenue Million Forecast, by Country 2019 & 2032
- Table 62: Global Industrial Gearbox Industry Volume K Unit Forecast, by Country 2019 & 2032
- Table 63: United States Industrial Gearbox Industry Revenue (Million) Forecast, by Application 2019 & 2032
- Table 64: United States Industrial Gearbox Industry Volume (K Unit) Forecast, by Application 2019 & 2032
- Table 65: Canada Industrial Gearbox Industry Revenue (Million) Forecast, by Application 2019 & 2032
- Table 66: Canada Industrial Gearbox Industry Volume (K Unit) Forecast, by Application 2019 & 2032
- Table 67: Rest of North America Industrial Gearbox Industry Revenue (Million) Forecast, by Application 2019 & 2032
- Table 68: Rest of North America Industrial Gearbox Industry Volume (K Unit) Forecast, by Application 2019 & 2032
- Table 69: Global Industrial Gearbox Industry Revenue Million Forecast, by Type 2019 & 2032
- Table 70: Global Industrial Gearbox Industry Volume K Unit Forecast, by Type 2019 & 2032
- Table 71: Global Industrial Gearbox Industry Revenue Million Forecast, by Application 2019 & 2032
- Table 72: Global Industrial Gearbox Industry Volume K Unit Forecast, by Application 2019 & 2032
- Table 73: Global Industrial Gearbox Industry Revenue Million Forecast, by Country 2019 & 2032
- Table 74: Global Industrial Gearbox Industry Volume K Unit Forecast, by Country 2019 & 2032
- Table 75: Germany Industrial Gearbox Industry Revenue (Million) Forecast, by Application 2019 & 2032
- Table 76: Germany Industrial Gearbox Industry Volume (K Unit) Forecast, by Application 2019 & 2032
- Table 77: France Industrial Gearbox Industry Revenue (Million) Forecast, by Application 2019 & 2032
- Table 78: France Industrial Gearbox Industry Volume (K Unit) Forecast, by Application 2019 & 2032
- Table 79: United Kingdom Industrial Gearbox Industry Revenue (Million) Forecast, by Application 2019 & 2032
- Table 80: United Kingdom Industrial Gearbox Industry Volume (K Unit) Forecast, by Application 2019 & 2032
- Table 81: Rest of Europe Industrial Gearbox Industry Revenue (Million) Forecast, by Application 2019 & 2032
- Table 82: Rest of Europe Industrial Gearbox Industry Volume (K Unit) Forecast, by Application 2019 & 2032
- Table 83: Global Industrial Gearbox Industry Revenue Million Forecast, by Type 2019 & 2032
- Table 84: Global Industrial Gearbox Industry Volume K Unit Forecast, by Type 2019 & 2032
- Table 85: Global Industrial Gearbox Industry Revenue Million Forecast, by Application 2019 & 2032
- Table 86: Global Industrial Gearbox Industry Volume K Unit Forecast, by Application 2019 & 2032
- Table 87: Global Industrial Gearbox Industry Revenue Million Forecast, by Country 2019 & 2032
- Table 88: Global Industrial Gearbox Industry Volume K Unit Forecast, by Country 2019 & 2032
- Table 89: China Industrial Gearbox Industry Revenue (Million) Forecast, by Application 2019 & 2032
- Table 90: China Industrial Gearbox Industry Volume (K Unit) Forecast, by Application 2019 & 2032
- Table 91: India Industrial Gearbox Industry Revenue (Million) Forecast, by Application 2019 & 2032
- Table 92: India Industrial Gearbox Industry Volume (K Unit) Forecast, by Application 2019 & 2032
- Table 93: Japan Industrial Gearbox Industry Revenue (Million) Forecast, by Application 2019 & 2032
- Table 94: Japan Industrial Gearbox Industry Volume (K Unit) Forecast, by Application 2019 & 2032
- Table 95: South Korea Industrial Gearbox Industry Revenue (Million) Forecast, by Application 2019 & 2032
- Table 96: South Korea Industrial Gearbox Industry Volume (K Unit) Forecast, by Application 2019 & 2032
- Table 97: Rest of Asia Pacific Industrial Gearbox Industry Revenue (Million) Forecast, by Application 2019 & 2032
- Table 98: Rest of Asia Pacific Industrial Gearbox Industry Volume (K Unit) Forecast, by Application 2019 & 2032
- Table 99: Global Industrial Gearbox Industry Revenue Million Forecast, by Type 2019 & 2032
- Table 100: Global Industrial Gearbox Industry Volume K Unit Forecast, by Type 2019 & 2032
- Table 101: Global Industrial Gearbox Industry Revenue Million Forecast, by Application 2019 & 2032
- Table 102: Global Industrial Gearbox Industry Volume K Unit Forecast, by Application 2019 & 2032
- Table 103: Global Industrial Gearbox Industry Revenue Million Forecast, by Country 2019 & 2032
- Table 104: Global Industrial Gearbox Industry Volume K Unit Forecast, by Country 2019 & 2032
- Table 105: Brazil Industrial Gearbox Industry Revenue (Million) Forecast, by Application 2019 & 2032
- Table 106: Brazil Industrial Gearbox Industry Volume (K Unit) Forecast, by Application 2019 & 2032
- Table 107: Argentina Industrial Gearbox Industry Revenue (Million) Forecast, by Application 2019 & 2032
- Table 108: Argentina Industrial Gearbox Industry Volume (K Unit) Forecast, by Application 2019 & 2032
- Table 109: Rest of South America Industrial Gearbox Industry Revenue (Million) Forecast, by Application 2019 & 2032
- Table 110: Rest of South America Industrial Gearbox Industry Volume (K Unit) Forecast, by Application 2019 & 2032
- Table 111: Global Industrial Gearbox Industry Revenue Million Forecast, by Type 2019 & 2032
- Table 112: Global Industrial Gearbox Industry Volume K Unit Forecast, by Type 2019 & 2032
- Table 113: Global Industrial Gearbox Industry Revenue Million Forecast, by Application 2019 & 2032
- Table 114: Global Industrial Gearbox Industry Volume K Unit Forecast, by Application 2019 & 2032
- Table 115: Global Industrial Gearbox Industry Revenue Million Forecast, by Country 2019 & 2032
- Table 116: Global Industrial Gearbox Industry Volume K Unit Forecast, by Country 2019 & 2032
- Table 117: Saudi Arabia Industrial Gearbox Industry Revenue (Million) Forecast, by Application 2019 & 2032
- Table 118: Saudi Arabia Industrial Gearbox Industry Volume (K Unit) Forecast, by Application 2019 & 2032
- Table 119: United Arab Emirates Industrial Gearbox Industry Revenue (Million) Forecast, by Application 2019 & 2032
- Table 120: United Arab Emirates Industrial Gearbox Industry Volume (K Unit) Forecast, by Application 2019 & 2032
- Table 121: South Africa Industrial Gearbox Industry Revenue (Million) Forecast, by Application 2019 & 2032
- Table 122: South Africa Industrial Gearbox Industry Volume (K Unit) Forecast, by Application 2019 & 2032
- Table 123: Rest of Middle East and Africa Industrial Gearbox Industry Revenue (Million) Forecast, by Application 2019 & 2032
- Table 124: Rest of Middle East and Africa Industrial Gearbox Industry Volume (K Unit) Forecast, by Application 2019 & 2032
Frequently Asked Questions
1. What is the projected Compound Annual Growth Rate (CAGR) of the Industrial Gearbox Industry?
The projected CAGR is approximately 4.20%.
2. Which companies are prominent players in the Industrial Gearbox Industry?
Key companies in the market include Flender Ltd, Sew-Eurodrive GmbH & Co KG, Bosch Rexroth AG, INGECO GEARS Pvt Ltd, Essential Power Transmission Pvt Ltd, Getriebebau NORD GmbH & Co KG, Nanjing High Accurate Drive Equipment Manufacturing Group Co Ltd, Zollern GmbH & Co KG, Lenze SE, Kngear, Elecon Engineering Company Limited, Bonfiglioli Drives Co Ltd.
3. What are the main segments of the Industrial Gearbox Industry?
The market segments include Type, Application.
4. Can you provide details about the market size?
The market size is estimated to be USD 28.33 Million as of 2022.
5. What are some drivers contributing to market growth?
4.; Growing Adoption of Industrial Automation across Various Industrial Sectors4.; Rising Sales for Automobiles across the World.
6. What are the notable trends driving market growth?
Helical Gearbox Type Segment to Dominate the Market.
7. Are there any restraints impacting market growth?
4.; Slow Down in Economic and Industrial Activities.
8. Can you provide examples of recent developments in the market?
May 2023: Triumph Group, Inc. announced that it had been awarded a long-term agreement from General Electric (GE) through its Geared Solutions business for LEAP-1A, LEAP-1B, and LEAP-1C programs. TRIUMPH has collaborated with GE on LEAP and CFM56 IGBs for over 35 years, shipping over 25,000 gearboxes till now. TRIUMPH will supply thousands of IGBs annually to GE into the next decade with this contract extension.
9. What pricing options are available for accessing the report?
Pricing options include single-user, multi-user, and enterprise licenses priced at USD 4750, USD 5250, and USD 8750 respectively.
10. Is the market size provided in terms of value or volume?
The market size is provided in terms of value, measured in Million and volume, measured in K Unit.
11. Are there any specific market keywords associated with the report?
Yes, the market keyword associated with the report is "Industrial Gearbox Industry," which aids in identifying and referencing the specific market segment covered.
12. How do I determine which pricing option suits my needs best?
The pricing options vary based on user requirements and access needs. Individual users may opt for single-user licenses, while businesses requiring broader access may choose multi-user or enterprise licenses for cost-effective access to the report.
13. Are there any additional resources or data provided in the Industrial Gearbox Industry report?
While the report offers comprehensive insights, it's advisable to review the specific contents or supplementary materials provided to ascertain if additional resources or data are available.
14. How can I stay updated on further developments or reports in the Industrial Gearbox Industry?
To stay informed about further developments, trends, and reports in the Industrial Gearbox Industry, consider subscribing to industry newsletters, following relevant companies and organizations, or regularly checking reputable industry news sources and publications.
Methodology
Step 1 - Identification of Relevant Samples Size from Population Database


Step 2 - Approaches for Defining Global Market Size (Value, Volume* & Price*)

Note*: In applicable scenarios
Step 3 - Data Sources
Primary Research
- Web Analytics
- Survey Reports
- Research Institute
- Latest Research Reports
- Opinion Leaders
Secondary Research
- Annual Reports
- White Paper
- Latest Press Release
- Industry Association
- Paid Database
- Investor Presentations

Step 4 - Data Triangulation
Involves using different sources of information in order to increase the validity of a study
These sources are likely to be stakeholders in a program - participants, other researchers, program staff, other community members, and so on.
Then we put all data in single framework & apply various statistical tools to find out the dynamic on the market.
During the analysis stage, feedback from the stakeholder groups would be compared to determine areas of agreement as well as areas of divergence
