

Key Insights
Indonesia's oil and gas market is projected for sustained growth, driven by escalating energy demand from a burgeoning population and ongoing industrial expansion. The market is expected to reach $758.7 million by 2025, with a Compound Annual Growth Rate (CAGR) of 1.46% from the base year 2025 to 2033. Key growth catalysts include increasing electricity consumption for power generation, rising transportation needs associated with economic development, and robust demand from the industrial sector. However, the market is subject to challenges such as volatile global oil prices, government regulations favoring renewable energy, and environmental considerations impacting exploration and production. The market is segmented by product (crude oil, natural gas, refined products), application (power generation, transportation, industrial, residential), and region (Sumatra, Java, Kalimantan, Papua, East Indonesia). Pertamina holds a dominant position, alongside international entities like Shell, ConocoPhillips, and ExxonMobil. Despite intense competition, the long-term outlook is positive, bolstered by Indonesia's substantial energy reserves and strategic geographic location.
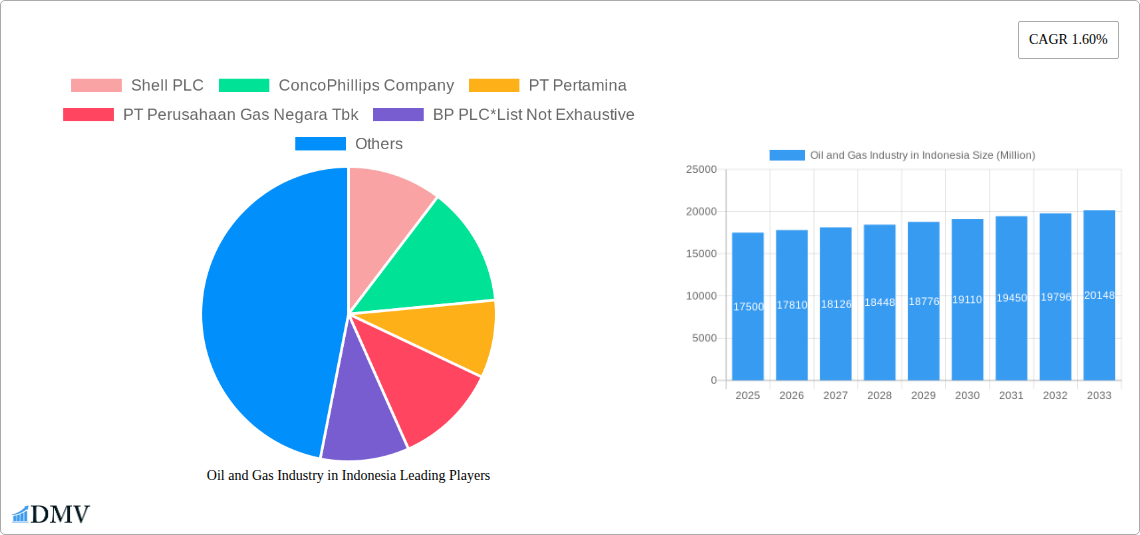
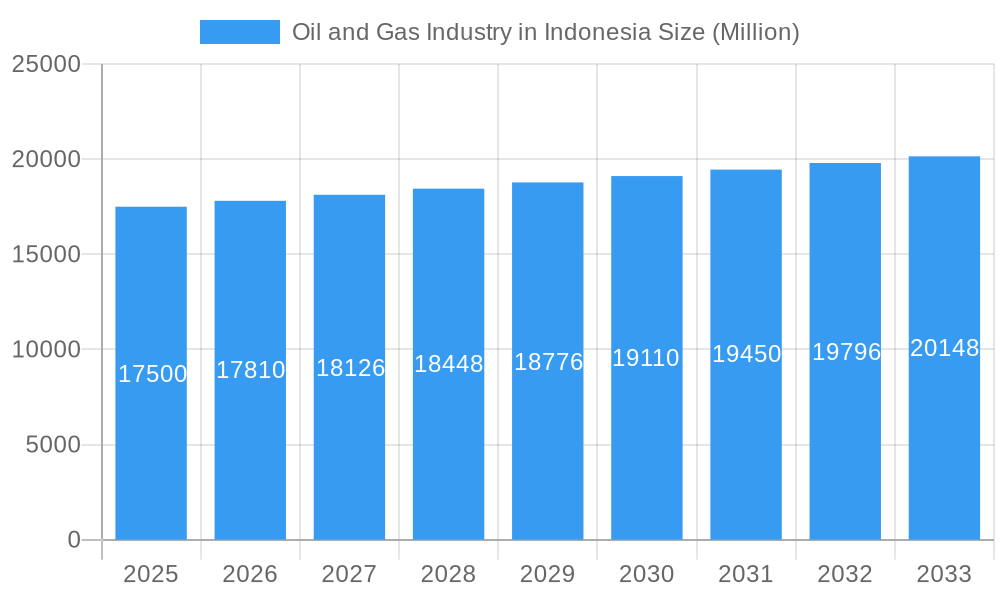
Oil and Gas Industry in Indonesia Market Size (In Million)
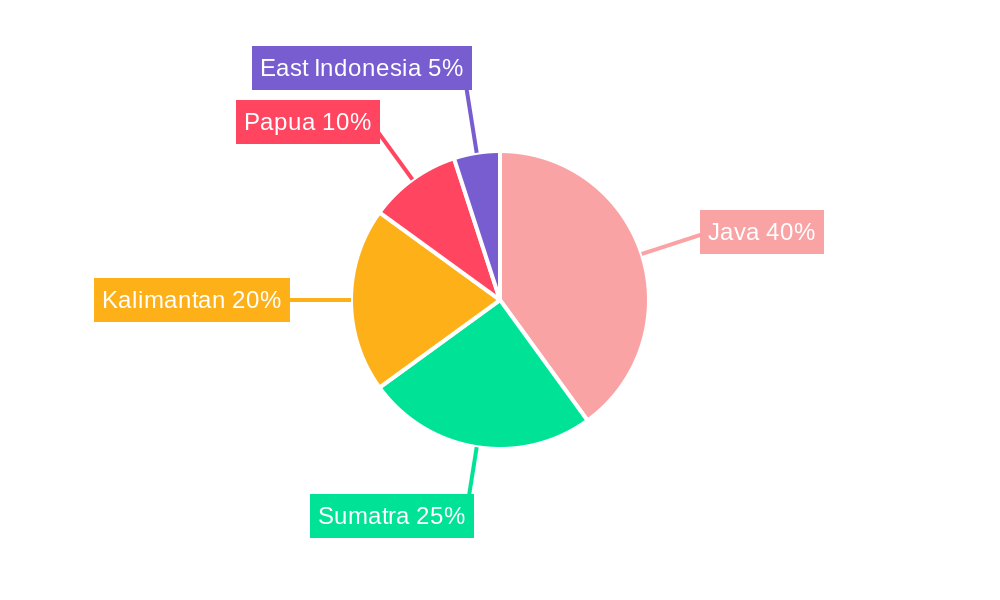
Regional market dynamics vary across Indonesia. Java, characterized by high population density and industrial activity, is anticipated to be a major contributor to market expansion, followed by Sumatra and Kalimantan. Papua and East Indonesia, despite significant reserves, may experience slower growth due to infrastructural limitations and remoteness. The refined products segment, particularly gasoline and diesel, is likely to see accelerated growth, driven by increasing vehicle ownership and industrial operations. A growing emphasis on sustainability and government promotion of renewable energy may necessitate strategic adaptations by oil and gas companies, potentially leading to investments in cleaner energy technologies and portfolio diversification. This strategic balance between economic advancement and environmental responsibility will shape the future trajectory of Indonesia's oil and gas market.
Oil and Gas Industry in Indonesia Company Market Share
Indonesia Oil and Gas Market Analysis: Trends, Key Players, and Future Growth (2019-2033)
This comprehensive report delivers an in-depth analysis of Indonesia's oil and gas industry, detailing market trends, leading participants, and future growth prospects. The study period spans 2019-2033, with a base year of 2025 and a forecast period of 2025-2033, offering crucial insights for stakeholders navigating this dynamic sector. Through extensive data analysis, the report presents a precise outlook on Indonesia's oil and gas landscape, focusing on key segments and major players. The total market value is estimated at 758.7 million in 2025, indicating substantial investment and growth potential in the coming years.
Oil and Gas Industry in Indonesia Market Composition & Trends
This section delves into the intricate composition of Indonesia's oil and gas market, analyzing key aspects such as market concentration, innovation, regulatory frameworks, substitute products, end-user profiles, and merger & acquisition (M&A) activities. The Indonesian oil and gas sector demonstrates a dynamic interplay of state-owned enterprises and international players, leading to a moderately concentrated market. Innovation is driven by the need for enhanced efficiency in extraction, processing, and distribution, while regulations constantly evolve to balance energy security with environmental concerns. The substitution of fossil fuels with renewables poses a medium-term challenge. End-users span diverse sectors, including power generation, transportation, industrial operations, and residential consumption. M&A activity showcases the ongoing consolidation and strategic positioning within the industry.
- Market Share Distribution (2025): PT Pertamina (xx%), Shell PLC (xx%), Chevron Corporation (xx%), Other Players (xx%). (Note: These figures are estimations due to unavailable data.)
- M&A Deal Values (2019-2024): Approximately xx Million USD in total deal value, with notable transactions involving both domestic and international entities.
- Key Regulatory Influences: The government's focus on energy security and increasing domestic gas utilization significantly impacts market dynamics.
Oil and Gas Industry in Indonesia Industry Evolution
This section presents a comprehensive analysis of the evolutionary trajectory of Indonesia's oil and gas industry, encompassing market growth patterns, technological improvements, and changing consumer preferences over the period 2019-2033. The industry has experienced a period of both growth and challenges. Technological advancements in exploration and extraction, such as enhanced oil recovery techniques and improved seismic imaging, have boosted production efficiency. Simultaneously, the rising adoption of renewable energy sources and evolving consumer expectations for sustainable practices present both opportunities and risks for the industry. Growth rates have fluctuated, with an estimated average annual growth rate (AAGR) of xx% during the historical period (2019-2024) and a projected AAGR of xx% during the forecast period (2025-2033). These projections factor in government policies, global energy prices, and technological changes. The growth trajectories reveal a significant need for investment in new technologies to maintain output and meet rising energy demand.
Leading Regions, Countries, or Segments in Oil and Gas Industry in Indonesia
This section identifies the leading regions, countries, and segments within Indonesia's oil and gas industry, providing a detailed analysis of their dominance.
Dominant Segments:
- Product Segmentation: Natural gas currently holds a dominant position, driven by strong domestic and export demand. Crude oil production remains significant, though facing challenges related to aging fields and exploration costs. Refined products are vital for domestic consumption.
- Application Segmentation: Power generation is a key consumer of natural gas, while transportation relies heavily on refined products. Industrial and residential consumption also contribute significantly to overall demand.
- Regional Segmentation: Java, with its high population density and industrial activity, leads in consumption. Kalimantan and Sumatra possess substantial reserves and production capacity. Papua also holds significant potential but faces infrastructural constraints.
Key Drivers of Dominance:
- Investment Trends: Significant investments in upstream activities, particularly in gas exploration and development, are driving growth in certain regions and segments.
- Regulatory Support: Government policies aimed at boosting domestic gas utilization and energy security are influencing market dynamics.
Oil and Gas Industry in Indonesia Product Innovations
Recent innovations focus on improving extraction efficiency from mature fields, employing advanced seismic imaging and enhanced oil recovery techniques. There's also a growing emphasis on developing cleaner energy sources, particularly by leveraging Indonesia's extensive natural gas reserves to power domestic needs and reduce reliance on coal. These advancements are aimed at maximizing production and minimizing environmental impact.
Propelling Factors for Oil and Gas Industry in Indonesia Growth
The growth of Indonesia's oil and gas industry is primarily fueled by strong domestic demand, particularly for natural gas in the power generation sector. Government policies promoting energy security and domestic gas utilization further drive market growth. The exploration and development of new resources, alongside technological advancements in extraction and processing, contribute significantly to expanding the sector's capacity.
Obstacles in the Oil and Gas Industry in Indonesia Market
Challenges include aging infrastructure, the need for substantial investment in upgrading facilities and technology, and increasing environmental regulations. The global shift toward renewable energy sources also presents a long-term challenge, requiring strategic adaptation from industry players.
Future Opportunities in Oil and Gas Industry in Indonesia
Significant opportunities exist in expanding natural gas infrastructure, developing new gas fields, and increasing the export of liquefied natural gas (LNG). Investments in renewable energy sources, while challenging the industry's existing model, offer opportunities for diversification and sustainability. Technological improvements, such as carbon capture and storage, provide avenues for mitigating environmental impact and attracting further investment.
Major Players in the Oil and Gas Industry in Indonesia Ecosystem
- Shell PLC
- ConocoPhillips Company
- PT Pertamina
- PT Perusahaan Gas Negara Tbk
- BP PLC
- Chevron Corporation
- Petroliam Nasional Berhad
- PT Connusa Energindo
- ExxonMobil Corporation
- China National Offshore Oil Corporation
Key Developments in Oil and Gas Industry in Indonesia Industry
- June 2023: Sembcorp Industries signed a USD 1.41 billion gas sales agreement with Medco Energi International, signifying the growing importance of Indonesian gas exports.
- November 2022: Medco Energy Internasional Tbk secured a five-year gas supply agreement with Singapore, highlighting the continued reliance on Indonesian gas resources in the region.
Strategic Oil and Gas Industry in Indonesia Market Forecast
The Indonesian oil and gas market presents significant potential for future growth, driven by strong domestic demand, exploration of new resources, and strategic investments in infrastructure. While the transition to renewable energy poses a long-term challenge, the industry's focus on gas exports and technological advancements positions it for sustained growth and adaptation in the coming years. The market is projected to reach xx Million USD by 2033.
Oil and Gas Industry in Indonesia Segmentation
- 1. Upstream
- 2. Midstream
- 3. Downstream
Oil and Gas Industry in Indonesia Segmentation By Geography
-
1. North America
- 1.1. United States
- 1.2. Canada
- 1.3. Mexico
-
2. South America
- 2.1. Brazil
- 2.2. Argentina
- 2.3. Rest of South America
-
3. Europe
- 3.1. United Kingdom
- 3.2. Germany
- 3.3. France
- 3.4. Italy
- 3.5. Spain
- 3.6. Russia
- 3.7. Benelux
- 3.8. Nordics
- 3.9. Rest of Europe
-
4. Middle East & Africa
- 4.1. Turkey
- 4.2. Israel
- 4.3. GCC
- 4.4. North Africa
- 4.5. South Africa
- 4.6. Rest of Middle East & Africa
-
5. Asia Pacific
- 5.1. China
- 5.2. India
- 5.3. Japan
- 5.4. South Korea
- 5.5. ASEAN
- 5.6. Oceania
- 5.7. Rest of Asia Pacific
Oil and Gas Industry in Indonesia Regional Market Share
Geographic Coverage of Oil and Gas Industry in Indonesia
Oil and Gas Industry in Indonesia REPORT HIGHLIGHTS
| Aspects | Details |
|---|---|
| Study Period | 2020-2034 |
| Base Year | 2025 |
| Estimated Year | 2026 |
| Forecast Period | 2026-2034 |
| Historical Period | 2020-2025 |
| Growth Rate | CAGR of 1.46% from 2020-2034 |
| Segmentation |
|
Table of Contents
- 1. Introduction
- 1.1. Research Scope
- 1.2. Market Segmentation
- 1.3. Research Objective
- 1.4. Definitions and Assumptions
- 2. Executive Summary
- 2.1. Market Snapshot
- 3. Market Dynamics
- 3.1. Market Drivers
- 3.2. Market Restrains
- 3.3. Market Trends
- 3.4. Market Opportunities
- 4. Market Factor Analysis
- 4.1. Porters Five Forces
- 4.1.1. Bargaining Power of Suppliers
- 4.1.2. Bargaining Power of Buyers
- 4.1.3. Threat of New Entrants
- 4.1.4. Threat of Substitutes
- 4.1.5. Competitive Rivalry
- 4.2. PESTEL analysis
- 4.3. BCG Analysis
- 4.3.1. Stars (High Growth, High Market Share)
- 4.3.2. Cash Cows (Low Growth, High Market Share)
- 4.3.3. Question Mark (High Growth, Low Market Share)
- 4.3.4. Dogs (Low Growth, Low Market Share)
- 4.4. Ansoff Matrix Analysis
- 4.5. Supply Chain Analysis
- 4.6. Regulatory Landscape
- 4.7. Current Market Potential and Opportunity Assessment (TAM–SAM–SOM Framework)
- 4.8. DMV Analyst Note
- 4.1. Porters Five Forces
- 5. Market Analysis, Insights and Forecast 2021-2033
- 5.1. Market Analysis, Insights and Forecast - by Upstream
- 5.2. Market Analysis, Insights and Forecast - by Midstream
- 5.3. Market Analysis, Insights and Forecast - by Downstream
- 5.4. Market Analysis, Insights and Forecast - by Region
- 5.4.1. North America
- 5.4.2. South America
- 5.4.3. Europe
- 5.4.4. Middle East & Africa
- 5.4.5. Asia Pacific
- 6. Global Oil and Gas Industry in Indonesia Analysis, Insights and Forecast, 2021-2033
- 6.1. Market Analysis, Insights and Forecast - by Upstream
- 6.2. Market Analysis, Insights and Forecast - by Midstream
- 6.3. Market Analysis, Insights and Forecast - by Downstream
- 7. North America Oil and Gas Industry in Indonesia Analysis, Insights and Forecast, 2020-2032
- 7.1. Market Analysis, Insights and Forecast - by Upstream
- 7.2. Market Analysis, Insights and Forecast - by Midstream
- 7.3. Market Analysis, Insights and Forecast - by Downstream
- 8. South America Oil and Gas Industry in Indonesia Analysis, Insights and Forecast, 2020-2032
- 8.1. Market Analysis, Insights and Forecast - by Upstream
- 8.2. Market Analysis, Insights and Forecast - by Midstream
- 8.3. Market Analysis, Insights and Forecast - by Downstream
- 9. Europe Oil and Gas Industry in Indonesia Analysis, Insights and Forecast, 2020-2032
- 9.1. Market Analysis, Insights and Forecast - by Upstream
- 9.2. Market Analysis, Insights and Forecast - by Midstream
- 9.3. Market Analysis, Insights and Forecast - by Downstream
- 10. Middle East & Africa Oil and Gas Industry in Indonesia Analysis, Insights and Forecast, 2020-2032
- 10.1. Market Analysis, Insights and Forecast - by Upstream
- 10.2. Market Analysis, Insights and Forecast - by Midstream
- 10.3. Market Analysis, Insights and Forecast - by Downstream
- 11. Asia Pacific Oil and Gas Industry in Indonesia Analysis, Insights and Forecast, 2020-2032
- 11.1. Market Analysis, Insights and Forecast - by Upstream
- 11.2. Market Analysis, Insights and Forecast - by Midstream
- 11.3. Market Analysis, Insights and Forecast - by Downstream
- 12. Competitive Analysis
- 12.1. Company Profiles
- 12.1.1 Shell PLC
- 12.1.1.1. Company Overview
- 12.1.1.2. Products
- 12.1.1.3. Company Financials
- 12.1.1.4. SWOT Analysis
- 12.1.2 ConcoPhillips Company
- 12.1.2.1. Company Overview
- 12.1.2.2. Products
- 12.1.2.3. Company Financials
- 12.1.2.4. SWOT Analysis
- 12.1.3 PT Pertamina
- 12.1.3.1. Company Overview
- 12.1.3.2. Products
- 12.1.3.3. Company Financials
- 12.1.3.4. SWOT Analysis
- 12.1.4 PT Perusahaan Gas Negara Tbk
- 12.1.4.1. Company Overview
- 12.1.4.2. Products
- 12.1.4.3. Company Financials
- 12.1.4.4. SWOT Analysis
- 12.1.5 BP PLC*List Not Exhaustive
- 12.1.5.1. Company Overview
- 12.1.5.2. Products
- 12.1.5.3. Company Financials
- 12.1.5.4. SWOT Analysis
- 12.1.6 Chevron Corporation
- 12.1.6.1. Company Overview
- 12.1.6.2. Products
- 12.1.6.3. Company Financials
- 12.1.6.4. SWOT Analysis
- 12.1.7 Petroliam Nasional Berhad
- 12.1.7.1. Company Overview
- 12.1.7.2. Products
- 12.1.7.3. Company Financials
- 12.1.7.4. SWOT Analysis
- 12.1.8 PT Connusa Energindo
- 12.1.8.1. Company Overview
- 12.1.8.2. Products
- 12.1.8.3. Company Financials
- 12.1.8.4. SWOT Analysis
- 12.1.9 ExxonMobil Corporatoin
- 12.1.9.1. Company Overview
- 12.1.9.2. Products
- 12.1.9.3. Company Financials
- 12.1.9.4. SWOT Analysis
- 12.1.10 China National Offshore Oil Corporation
- 12.1.10.1. Company Overview
- 12.1.10.2. Products
- 12.1.10.3. Company Financials
- 12.1.10.4. SWOT Analysis
- 12.1.1 Shell PLC
- 12.2. Market Entropy
- 12.2.1 Company's Key Areas Served
- 12.2.2 Recent Developments
- 12.3. Company Market Share Analysis 2025
- 12.3.1 Top 5 Companies Market Share Analysis
- 12.3.2 Top 3 Companies Market Share Analysis
- 12.4. List of Potential Customers
- 13. Research Methodology
List of Figures
- Figure 1: Global Oil and Gas Industry in Indonesia Revenue Breakdown (million, %) by Region 2025 & 2033
- Figure 2: Global Oil and Gas Industry in Indonesia Volume Breakdown (Thousand, %) by Region 2025 & 2033
- Figure 3: North America Oil and Gas Industry in Indonesia Revenue (million), by Upstream 2025 & 2033
- Figure 4: North America Oil and Gas Industry in Indonesia Volume (Thousand), by Upstream 2025 & 2033
- Figure 5: North America Oil and Gas Industry in Indonesia Revenue Share (%), by Upstream 2025 & 2033
- Figure 6: North America Oil and Gas Industry in Indonesia Volume Share (%), by Upstream 2025 & 2033
- Figure 7: North America Oil and Gas Industry in Indonesia Revenue (million), by Midstream 2025 & 2033
- Figure 8: North America Oil and Gas Industry in Indonesia Volume (Thousand), by Midstream 2025 & 2033
- Figure 9: North America Oil and Gas Industry in Indonesia Revenue Share (%), by Midstream 2025 & 2033
- Figure 10: North America Oil and Gas Industry in Indonesia Volume Share (%), by Midstream 2025 & 2033
- Figure 11: North America Oil and Gas Industry in Indonesia Revenue (million), by Downstream 2025 & 2033
- Figure 12: North America Oil and Gas Industry in Indonesia Volume (Thousand), by Downstream 2025 & 2033
- Figure 13: North America Oil and Gas Industry in Indonesia Revenue Share (%), by Downstream 2025 & 2033
- Figure 14: North America Oil and Gas Industry in Indonesia Volume Share (%), by Downstream 2025 & 2033
- Figure 15: North America Oil and Gas Industry in Indonesia Revenue (million), by Country 2025 & 2033
- Figure 16: North America Oil and Gas Industry in Indonesia Volume (Thousand), by Country 2025 & 2033
- Figure 17: North America Oil and Gas Industry in Indonesia Revenue Share (%), by Country 2025 & 2033
- Figure 18: North America Oil and Gas Industry in Indonesia Volume Share (%), by Country 2025 & 2033
- Figure 19: South America Oil and Gas Industry in Indonesia Revenue (million), by Upstream 2025 & 2033
- Figure 20: South America Oil and Gas Industry in Indonesia Volume (Thousand), by Upstream 2025 & 2033
- Figure 21: South America Oil and Gas Industry in Indonesia Revenue Share (%), by Upstream 2025 & 2033
- Figure 22: South America Oil and Gas Industry in Indonesia Volume Share (%), by Upstream 2025 & 2033
- Figure 23: South America Oil and Gas Industry in Indonesia Revenue (million), by Midstream 2025 & 2033
- Figure 24: South America Oil and Gas Industry in Indonesia Volume (Thousand), by Midstream 2025 & 2033
- Figure 25: South America Oil and Gas Industry in Indonesia Revenue Share (%), by Midstream 2025 & 2033
- Figure 26: South America Oil and Gas Industry in Indonesia Volume Share (%), by Midstream 2025 & 2033
- Figure 27: South America Oil and Gas Industry in Indonesia Revenue (million), by Downstream 2025 & 2033
- Figure 28: South America Oil and Gas Industry in Indonesia Volume (Thousand), by Downstream 2025 & 2033
- Figure 29: South America Oil and Gas Industry in Indonesia Revenue Share (%), by Downstream 2025 & 2033
- Figure 30: South America Oil and Gas Industry in Indonesia Volume Share (%), by Downstream 2025 & 2033
- Figure 31: South America Oil and Gas Industry in Indonesia Revenue (million), by Country 2025 & 2033
- Figure 32: South America Oil and Gas Industry in Indonesia Volume (Thousand), by Country 2025 & 2033
- Figure 33: South America Oil and Gas Industry in Indonesia Revenue Share (%), by Country 2025 & 2033
- Figure 34: South America Oil and Gas Industry in Indonesia Volume Share (%), by Country 2025 & 2033
- Figure 35: Europe Oil and Gas Industry in Indonesia Revenue (million), by Upstream 2025 & 2033
- Figure 36: Europe Oil and Gas Industry in Indonesia Volume (Thousand), by Upstream 2025 & 2033
- Figure 37: Europe Oil and Gas Industry in Indonesia Revenue Share (%), by Upstream 2025 & 2033
- Figure 38: Europe Oil and Gas Industry in Indonesia Volume Share (%), by Upstream 2025 & 2033
- Figure 39: Europe Oil and Gas Industry in Indonesia Revenue (million), by Midstream 2025 & 2033
- Figure 40: Europe Oil and Gas Industry in Indonesia Volume (Thousand), by Midstream 2025 & 2033
- Figure 41: Europe Oil and Gas Industry in Indonesia Revenue Share (%), by Midstream 2025 & 2033
- Figure 42: Europe Oil and Gas Industry in Indonesia Volume Share (%), by Midstream 2025 & 2033
- Figure 43: Europe Oil and Gas Industry in Indonesia Revenue (million), by Downstream 2025 & 2033
- Figure 44: Europe Oil and Gas Industry in Indonesia Volume (Thousand), by Downstream 2025 & 2033
- Figure 45: Europe Oil and Gas Industry in Indonesia Revenue Share (%), by Downstream 2025 & 2033
- Figure 46: Europe Oil and Gas Industry in Indonesia Volume Share (%), by Downstream 2025 & 2033
- Figure 47: Europe Oil and Gas Industry in Indonesia Revenue (million), by Country 2025 & 2033
- Figure 48: Europe Oil and Gas Industry in Indonesia Volume (Thousand), by Country 2025 & 2033
- Figure 49: Europe Oil and Gas Industry in Indonesia Revenue Share (%), by Country 2025 & 2033
- Figure 50: Europe Oil and Gas Industry in Indonesia Volume Share (%), by Country 2025 & 2033
- Figure 51: Middle East & Africa Oil and Gas Industry in Indonesia Revenue (million), by Upstream 2025 & 2033
- Figure 52: Middle East & Africa Oil and Gas Industry in Indonesia Volume (Thousand), by Upstream 2025 & 2033
- Figure 53: Middle East & Africa Oil and Gas Industry in Indonesia Revenue Share (%), by Upstream 2025 & 2033
- Figure 54: Middle East & Africa Oil and Gas Industry in Indonesia Volume Share (%), by Upstream 2025 & 2033
- Figure 55: Middle East & Africa Oil and Gas Industry in Indonesia Revenue (million), by Midstream 2025 & 2033
- Figure 56: Middle East & Africa Oil and Gas Industry in Indonesia Volume (Thousand), by Midstream 2025 & 2033
- Figure 57: Middle East & Africa Oil and Gas Industry in Indonesia Revenue Share (%), by Midstream 2025 & 2033
- Figure 58: Middle East & Africa Oil and Gas Industry in Indonesia Volume Share (%), by Midstream 2025 & 2033
- Figure 59: Middle East & Africa Oil and Gas Industry in Indonesia Revenue (million), by Downstream 2025 & 2033
- Figure 60: Middle East & Africa Oil and Gas Industry in Indonesia Volume (Thousand), by Downstream 2025 & 2033
- Figure 61: Middle East & Africa Oil and Gas Industry in Indonesia Revenue Share (%), by Downstream 2025 & 2033
- Figure 62: Middle East & Africa Oil and Gas Industry in Indonesia Volume Share (%), by Downstream 2025 & 2033
- Figure 63: Middle East & Africa Oil and Gas Industry in Indonesia Revenue (million), by Country 2025 & 2033
- Figure 64: Middle East & Africa Oil and Gas Industry in Indonesia Volume (Thousand), by Country 2025 & 2033
- Figure 65: Middle East & Africa Oil and Gas Industry in Indonesia Revenue Share (%), by Country 2025 & 2033
- Figure 66: Middle East & Africa Oil and Gas Industry in Indonesia Volume Share (%), by Country 2025 & 2033
- Figure 67: Asia Pacific Oil and Gas Industry in Indonesia Revenue (million), by Upstream 2025 & 2033
- Figure 68: Asia Pacific Oil and Gas Industry in Indonesia Volume (Thousand), by Upstream 2025 & 2033
- Figure 69: Asia Pacific Oil and Gas Industry in Indonesia Revenue Share (%), by Upstream 2025 & 2033
- Figure 70: Asia Pacific Oil and Gas Industry in Indonesia Volume Share (%), by Upstream 2025 & 2033
- Figure 71: Asia Pacific Oil and Gas Industry in Indonesia Revenue (million), by Midstream 2025 & 2033
- Figure 72: Asia Pacific Oil and Gas Industry in Indonesia Volume (Thousand), by Midstream 2025 & 2033
- Figure 73: Asia Pacific Oil and Gas Industry in Indonesia Revenue Share (%), by Midstream 2025 & 2033
- Figure 74: Asia Pacific Oil and Gas Industry in Indonesia Volume Share (%), by Midstream 2025 & 2033
- Figure 75: Asia Pacific Oil and Gas Industry in Indonesia Revenue (million), by Downstream 2025 & 2033
- Figure 76: Asia Pacific Oil and Gas Industry in Indonesia Volume (Thousand), by Downstream 2025 & 2033
- Figure 77: Asia Pacific Oil and Gas Industry in Indonesia Revenue Share (%), by Downstream 2025 & 2033
- Figure 78: Asia Pacific Oil and Gas Industry in Indonesia Volume Share (%), by Downstream 2025 & 2033
- Figure 79: Asia Pacific Oil and Gas Industry in Indonesia Revenue (million), by Country 2025 & 2033
- Figure 80: Asia Pacific Oil and Gas Industry in Indonesia Volume (Thousand), by Country 2025 & 2033
- Figure 81: Asia Pacific Oil and Gas Industry in Indonesia Revenue Share (%), by Country 2025 & 2033
- Figure 82: Asia Pacific Oil and Gas Industry in Indonesia Volume Share (%), by Country 2025 & 2033
List of Tables
- Table 1: Global Oil and Gas Industry in Indonesia Revenue million Forecast, by Upstream 2020 & 2033
- Table 2: Global Oil and Gas Industry in Indonesia Volume Thousand Forecast, by Upstream 2020 & 2033
- Table 3: Global Oil and Gas Industry in Indonesia Revenue million Forecast, by Midstream 2020 & 2033
- Table 4: Global Oil and Gas Industry in Indonesia Volume Thousand Forecast, by Midstream 2020 & 2033
- Table 5: Global Oil and Gas Industry in Indonesia Revenue million Forecast, by Downstream 2020 & 2033
- Table 6: Global Oil and Gas Industry in Indonesia Volume Thousand Forecast, by Downstream 2020 & 2033
- Table 7: Global Oil and Gas Industry in Indonesia Revenue million Forecast, by Region 2020 & 2033
- Table 8: Global Oil and Gas Industry in Indonesia Volume Thousand Forecast, by Region 2020 & 2033
- Table 9: Global Oil and Gas Industry in Indonesia Revenue million Forecast, by Upstream 2020 & 2033
- Table 10: Global Oil and Gas Industry in Indonesia Volume Thousand Forecast, by Upstream 2020 & 2033
- Table 11: Global Oil and Gas Industry in Indonesia Revenue million Forecast, by Midstream 2020 & 2033
- Table 12: Global Oil and Gas Industry in Indonesia Volume Thousand Forecast, by Midstream 2020 & 2033
- Table 13: Global Oil and Gas Industry in Indonesia Revenue million Forecast, by Downstream 2020 & 2033
- Table 14: Global Oil and Gas Industry in Indonesia Volume Thousand Forecast, by Downstream 2020 & 2033
- Table 15: Global Oil and Gas Industry in Indonesia Revenue million Forecast, by Country 2020 & 2033
- Table 16: Global Oil and Gas Industry in Indonesia Volume Thousand Forecast, by Country 2020 & 2033
- Table 17: United States Oil and Gas Industry in Indonesia Revenue (million) Forecast, by Application 2020 & 2033
- Table 18: United States Oil and Gas Industry in Indonesia Volume (Thousand) Forecast, by Application 2020 & 2033
- Table 19: Canada Oil and Gas Industry in Indonesia Revenue (million) Forecast, by Application 2020 & 2033
- Table 20: Canada Oil and Gas Industry in Indonesia Volume (Thousand) Forecast, by Application 2020 & 2033
- Table 21: Mexico Oil and Gas Industry in Indonesia Revenue (million) Forecast, by Application 2020 & 2033
- Table 22: Mexico Oil and Gas Industry in Indonesia Volume (Thousand) Forecast, by Application 2020 & 2033
- Table 23: Global Oil and Gas Industry in Indonesia Revenue million Forecast, by Upstream 2020 & 2033
- Table 24: Global Oil and Gas Industry in Indonesia Volume Thousand Forecast, by Upstream 2020 & 2033
- Table 25: Global Oil and Gas Industry in Indonesia Revenue million Forecast, by Midstream 2020 & 2033
- Table 26: Global Oil and Gas Industry in Indonesia Volume Thousand Forecast, by Midstream 2020 & 2033
- Table 27: Global Oil and Gas Industry in Indonesia Revenue million Forecast, by Downstream 2020 & 2033
- Table 28: Global Oil and Gas Industry in Indonesia Volume Thousand Forecast, by Downstream 2020 & 2033
- Table 29: Global Oil and Gas Industry in Indonesia Revenue million Forecast, by Country 2020 & 2033
- Table 30: Global Oil and Gas Industry in Indonesia Volume Thousand Forecast, by Country 2020 & 2033
- Table 31: Brazil Oil and Gas Industry in Indonesia Revenue (million) Forecast, by Application 2020 & 2033
- Table 32: Brazil Oil and Gas Industry in Indonesia Volume (Thousand) Forecast, by Application 2020 & 2033
- Table 33: Argentina Oil and Gas Industry in Indonesia Revenue (million) Forecast, by Application 2020 & 2033
- Table 34: Argentina Oil and Gas Industry in Indonesia Volume (Thousand) Forecast, by Application 2020 & 2033
- Table 35: Rest of South America Oil and Gas Industry in Indonesia Revenue (million) Forecast, by Application 2020 & 2033
- Table 36: Rest of South America Oil and Gas Industry in Indonesia Volume (Thousand) Forecast, by Application 2020 & 2033
- Table 37: Global Oil and Gas Industry in Indonesia Revenue million Forecast, by Upstream 2020 & 2033
- Table 38: Global Oil and Gas Industry in Indonesia Volume Thousand Forecast, by Upstream 2020 & 2033
- Table 39: Global Oil and Gas Industry in Indonesia Revenue million Forecast, by Midstream 2020 & 2033
- Table 40: Global Oil and Gas Industry in Indonesia Volume Thousand Forecast, by Midstream 2020 & 2033
- Table 41: Global Oil and Gas Industry in Indonesia Revenue million Forecast, by Downstream 2020 & 2033
- Table 42: Global Oil and Gas Industry in Indonesia Volume Thousand Forecast, by Downstream 2020 & 2033
- Table 43: Global Oil and Gas Industry in Indonesia Revenue million Forecast, by Country 2020 & 2033
- Table 44: Global Oil and Gas Industry in Indonesia Volume Thousand Forecast, by Country 2020 & 2033
- Table 45: United Kingdom Oil and Gas Industry in Indonesia Revenue (million) Forecast, by Application 2020 & 2033
- Table 46: United Kingdom Oil and Gas Industry in Indonesia Volume (Thousand) Forecast, by Application 2020 & 2033
- Table 47: Germany Oil and Gas Industry in Indonesia Revenue (million) Forecast, by Application 2020 & 2033
- Table 48: Germany Oil and Gas Industry in Indonesia Volume (Thousand) Forecast, by Application 2020 & 2033
- Table 49: France Oil and Gas Industry in Indonesia Revenue (million) Forecast, by Application 2020 & 2033
- Table 50: France Oil and Gas Industry in Indonesia Volume (Thousand) Forecast, by Application 2020 & 2033
- Table 51: Italy Oil and Gas Industry in Indonesia Revenue (million) Forecast, by Application 2020 & 2033
- Table 52: Italy Oil and Gas Industry in Indonesia Volume (Thousand) Forecast, by Application 2020 & 2033
- Table 53: Spain Oil and Gas Industry in Indonesia Revenue (million) Forecast, by Application 2020 & 2033
- Table 54: Spain Oil and Gas Industry in Indonesia Volume (Thousand) Forecast, by Application 2020 & 2033
- Table 55: Russia Oil and Gas Industry in Indonesia Revenue (million) Forecast, by Application 2020 & 2033
- Table 56: Russia Oil and Gas Industry in Indonesia Volume (Thousand) Forecast, by Application 2020 & 2033
- Table 57: Benelux Oil and Gas Industry in Indonesia Revenue (million) Forecast, by Application 2020 & 2033
- Table 58: Benelux Oil and Gas Industry in Indonesia Volume (Thousand) Forecast, by Application 2020 & 2033
- Table 59: Nordics Oil and Gas Industry in Indonesia Revenue (million) Forecast, by Application 2020 & 2033
- Table 60: Nordics Oil and Gas Industry in Indonesia Volume (Thousand) Forecast, by Application 2020 & 2033
- Table 61: Rest of Europe Oil and Gas Industry in Indonesia Revenue (million) Forecast, by Application 2020 & 2033
- Table 62: Rest of Europe Oil and Gas Industry in Indonesia Volume (Thousand) Forecast, by Application 2020 & 2033
- Table 63: Global Oil and Gas Industry in Indonesia Revenue million Forecast, by Upstream 2020 & 2033
- Table 64: Global Oil and Gas Industry in Indonesia Volume Thousand Forecast, by Upstream 2020 & 2033
- Table 65: Global Oil and Gas Industry in Indonesia Revenue million Forecast, by Midstream 2020 & 2033
- Table 66: Global Oil and Gas Industry in Indonesia Volume Thousand Forecast, by Midstream 2020 & 2033
- Table 67: Global Oil and Gas Industry in Indonesia Revenue million Forecast, by Downstream 2020 & 2033
- Table 68: Global Oil and Gas Industry in Indonesia Volume Thousand Forecast, by Downstream 2020 & 2033
- Table 69: Global Oil and Gas Industry in Indonesia Revenue million Forecast, by Country 2020 & 2033
- Table 70: Global Oil and Gas Industry in Indonesia Volume Thousand Forecast, by Country 2020 & 2033
- Table 71: Turkey Oil and Gas Industry in Indonesia Revenue (million) Forecast, by Application 2020 & 2033
- Table 72: Turkey Oil and Gas Industry in Indonesia Volume (Thousand) Forecast, by Application 2020 & 2033
- Table 73: Israel Oil and Gas Industry in Indonesia Revenue (million) Forecast, by Application 2020 & 2033
- Table 74: Israel Oil and Gas Industry in Indonesia Volume (Thousand) Forecast, by Application 2020 & 2033
- Table 75: GCC Oil and Gas Industry in Indonesia Revenue (million) Forecast, by Application 2020 & 2033
- Table 76: GCC Oil and Gas Industry in Indonesia Volume (Thousand) Forecast, by Application 2020 & 2033
- Table 77: North Africa Oil and Gas Industry in Indonesia Revenue (million) Forecast, by Application 2020 & 2033
- Table 78: North Africa Oil and Gas Industry in Indonesia Volume (Thousand) Forecast, by Application 2020 & 2033
- Table 79: South Africa Oil and Gas Industry in Indonesia Revenue (million) Forecast, by Application 2020 & 2033
- Table 80: South Africa Oil and Gas Industry in Indonesia Volume (Thousand) Forecast, by Application 2020 & 2033
- Table 81: Rest of Middle East & Africa Oil and Gas Industry in Indonesia Revenue (million) Forecast, by Application 2020 & 2033
- Table 82: Rest of Middle East & Africa Oil and Gas Industry in Indonesia Volume (Thousand) Forecast, by Application 2020 & 2033
- Table 83: Global Oil and Gas Industry in Indonesia Revenue million Forecast, by Upstream 2020 & 2033
- Table 84: Global Oil and Gas Industry in Indonesia Volume Thousand Forecast, by Upstream 2020 & 2033
- Table 85: Global Oil and Gas Industry in Indonesia Revenue million Forecast, by Midstream 2020 & 2033
- Table 86: Global Oil and Gas Industry in Indonesia Volume Thousand Forecast, by Midstream 2020 & 2033
- Table 87: Global Oil and Gas Industry in Indonesia Revenue million Forecast, by Downstream 2020 & 2033
- Table 88: Global Oil and Gas Industry in Indonesia Volume Thousand Forecast, by Downstream 2020 & 2033
- Table 89: Global Oil and Gas Industry in Indonesia Revenue million Forecast, by Country 2020 & 2033
- Table 90: Global Oil and Gas Industry in Indonesia Volume Thousand Forecast, by Country 2020 & 2033
- Table 91: China Oil and Gas Industry in Indonesia Revenue (million) Forecast, by Application 2020 & 2033
- Table 92: China Oil and Gas Industry in Indonesia Volume (Thousand) Forecast, by Application 2020 & 2033
- Table 93: India Oil and Gas Industry in Indonesia Revenue (million) Forecast, by Application 2020 & 2033
- Table 94: India Oil and Gas Industry in Indonesia Volume (Thousand) Forecast, by Application 2020 & 2033
- Table 95: Japan Oil and Gas Industry in Indonesia Revenue (million) Forecast, by Application 2020 & 2033
- Table 96: Japan Oil and Gas Industry in Indonesia Volume (Thousand) Forecast, by Application 2020 & 2033
- Table 97: South Korea Oil and Gas Industry in Indonesia Revenue (million) Forecast, by Application 2020 & 2033
- Table 98: South Korea Oil and Gas Industry in Indonesia Volume (Thousand) Forecast, by Application 2020 & 2033
- Table 99: ASEAN Oil and Gas Industry in Indonesia Revenue (million) Forecast, by Application 2020 & 2033
- Table 100: ASEAN Oil and Gas Industry in Indonesia Volume (Thousand) Forecast, by Application 2020 & 2033
- Table 101: Oceania Oil and Gas Industry in Indonesia Revenue (million) Forecast, by Application 2020 & 2033
- Table 102: Oceania Oil and Gas Industry in Indonesia Volume (Thousand) Forecast, by Application 2020 & 2033
- Table 103: Rest of Asia Pacific Oil and Gas Industry in Indonesia Revenue (million) Forecast, by Application 2020 & 2033
- Table 104: Rest of Asia Pacific Oil and Gas Industry in Indonesia Volume (Thousand) Forecast, by Application 2020 & 2033
Frequently Asked Questions
1. What is the projected Compound Annual Growth Rate (CAGR) of the Oil and Gas Industry in Indonesia?
The projected CAGR is approximately 1.46%.
2. Which companies are prominent players in the Oil and Gas Industry in Indonesia?
Key companies in the market include Shell PLC, ConcoPhillips Company, PT Pertamina, PT Perusahaan Gas Negara Tbk, BP PLC*List Not Exhaustive, Chevron Corporation, Petroliam Nasional Berhad, PT Connusa Energindo, ExxonMobil Corporatoin, China National Offshore Oil Corporation.
3. What are the main segments of the Oil and Gas Industry in Indonesia?
The market segments include Upstream, Midstream, Downstream.
4. Can you provide details about the market size?
The market size is estimated to be USD 758.7 million as of 2022.
5. What are some drivers contributing to market growth?
4.; Increasing Demand for Petroleum Products Due to the Growth of the Local Economy4.; Government Initiatives to Boost the Production of Crude Oil and Natural Gas.
6. What are the notable trends driving market growth?
Upstream Sector Expected to Witness Significant Growth.
7. Are there any restraints impacting market growth?
4.; Increasing Adoption of Renewable Energy.
8. Can you provide examples of recent developments in the market?
June 2023: Sembcorp Industries signed a USD 1.41 billion gas sales agreement with Medco Energi International to import gas from an offshore play in Indonesia to Singapore. Gas will be obtained from the West Natuna gas field and dispatched to Singapore through the West Natuna-Singapore gas pipeline.
9. What pricing options are available for accessing the report?
Pricing options include single-user, multi-user, and enterprise licenses priced at USD 3800, USD 4500, and USD 5800 respectively.
10. Is the market size provided in terms of value or volume?
The market size is provided in terms of value, measured in million and volume, measured in Thousand.
11. Are there any specific market keywords associated with the report?
Yes, the market keyword associated with the report is "Oil and Gas Industry in Indonesia," which aids in identifying and referencing the specific market segment covered.
12. How do I determine which pricing option suits my needs best?
The pricing options vary based on user requirements and access needs. Individual users may opt for single-user licenses, while businesses requiring broader access may choose multi-user or enterprise licenses for cost-effective access to the report.
13. Are there any additional resources or data provided in the Oil and Gas Industry in Indonesia report?
While the report offers comprehensive insights, it's advisable to review the specific contents or supplementary materials provided to ascertain if additional resources or data are available.
14. How can I stay updated on further developments or reports in the Oil and Gas Industry in Indonesia?
To stay informed about further developments, trends, and reports in the Oil and Gas Industry in Indonesia, consider subscribing to industry newsletters, following relevant companies and organizations, or regularly checking reputable industry news sources and publications.
Methodology
Step 1 - Identification of Relevant Samples Size from Population Database


Step 2 - Approaches for Defining Global Market Size (Value, Volume* & Price*)

Note*: In applicable scenarios
Step 3 - Data Sources
Primary Research
- Web Analytics
- Survey Reports
- Research Institute
- Latest Research Reports
- Opinion Leaders
Secondary Research
- Annual Reports
- White Paper
- Latest Press Release
- Industry Association
- Paid Database
- Investor Presentations

Step 4 - Data Triangulation
Involves using different sources of information in order to increase the validity of a study
These sources are likely to be stakeholders in a program - participants, other researchers, program staff, other community members, and so on.
Then we put all data in single framework & apply various statistical tools to find out the dynamic on the market.
During the analysis stage, feedback from the stakeholder groups would be compared to determine areas of agreement as well as areas of divergence