

Key Insights
The global Clean Coal Technology market is projected to reach $4.57 billion by 2025, driven by a CAGR of 6.39% from its 2025 base year. This significant growth is fueled by escalating global energy requirements and stringent environmental regulations targeting greenhouse gas reduction and air quality improvement. Key innovations in Carbon Capture and Storage (CCS), advanced combustion methods, Flue Gas Desulfurization (FGD), and Selective Catalytic Reduction (SCR) are primary growth enablers. The power generation sector leads in application, followed by industrial processes, with residential and commercial heating representing smaller segments. Geographically, North America (led by the US), Europe (Germany, UK), and Asia-Pacific (China, India) are key growth regions. However, substantial capital investment for technology implementation and ongoing discussions on coal's long-term sustainability present market challenges. Despite these, continuous technological advancements and supportive government policies are expected to sustain market expansion through the forecast period.
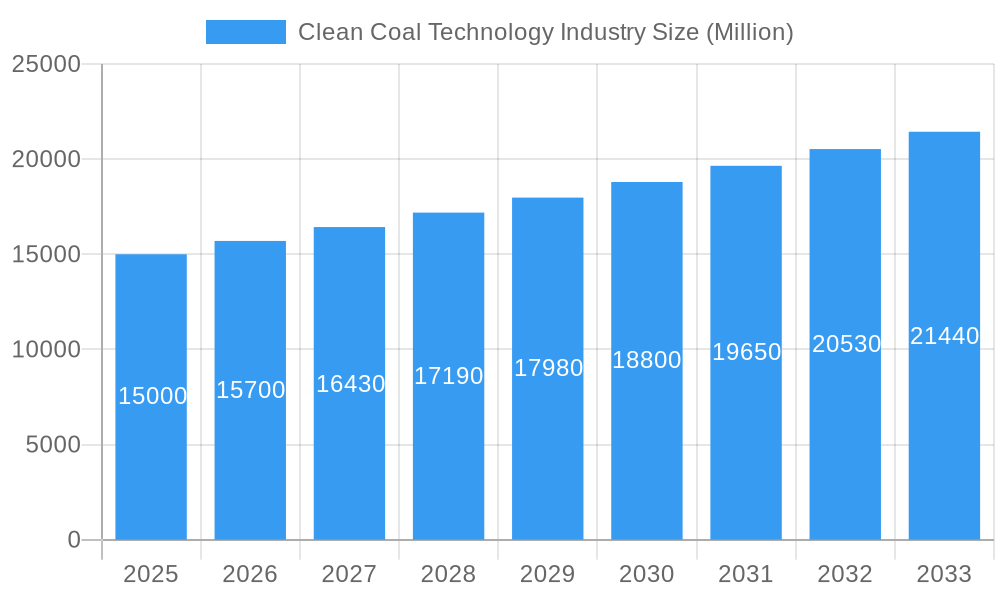
Clean Coal Technology Industry Market Size (In Billion)
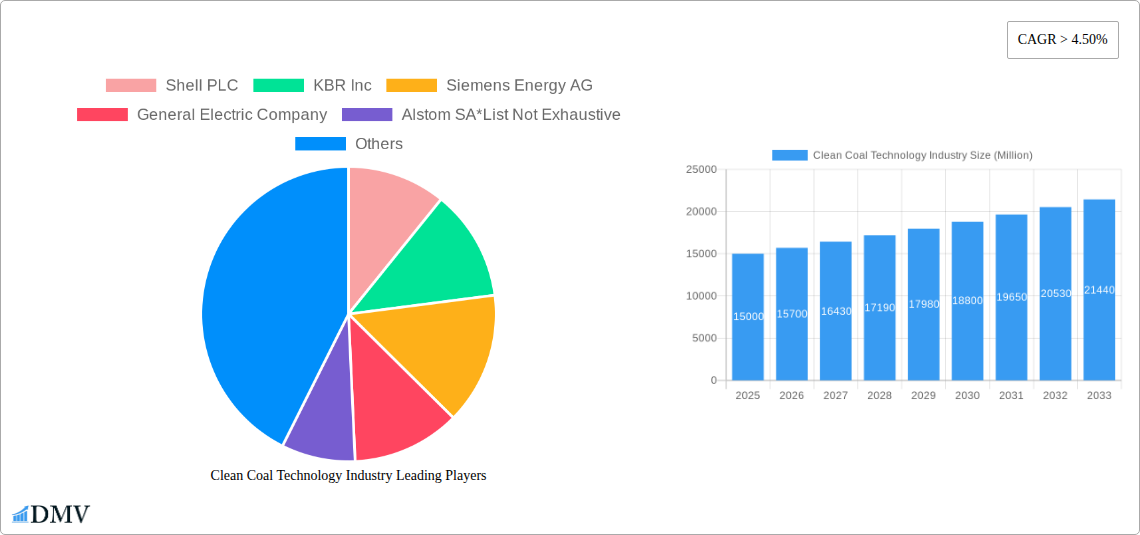
The competitive arena features prominent entities such as Shell PLC, KBR Inc., Siemens Energy AG, General Electric Company, and Alstom SA. These leaders actively drive innovation and deployment of advanced clean coal solutions, fostering market competition. Future expansion will depend on research and development focused on cost reduction, efficiency gains, and improved carbon capture technologies. Government incentives, international partnerships, and a sustained commitment to environmental stewardship will shape the market's long-term trajectory. As technologies mature and become more economically feasible, expect broader adoption across diverse industrial sectors.
Clean Coal Technology Industry Company Market Share
Clean Coal Technology Industry Market Report: 2019-2033
This comprehensive report provides a detailed analysis of the Clean Coal Technology (CCT) industry, offering invaluable insights for stakeholders seeking to navigate this evolving market. The report covers the period 2019-2033, with a base year of 2025 and a forecast period spanning 2025-2033. The study encompasses a deep dive into market dynamics, technological advancements, and key players, providing a robust foundation for informed decision-making. The global market size is projected to reach xx Million by 2033, exhibiting a CAGR of xx% during the forecast period.
Clean Coal Technology Industry Market Composition & Trends
This section evaluates the competitive landscape of the Clean Coal Technology industry, examining market concentration, innovation drivers, regulatory frameworks, substitute technologies, and end-user characteristics. We analyze mergers and acquisitions (M&A) activity, quantifying deal values and their impact on market share distribution.
The market is moderately concentrated, with several large players holding significant shares. However, the entry of innovative startups and the growing importance of niche technologies are fostering a dynamic competitive environment.
Market Share Distribution (2024): Shell PLC (xx%), KBR Inc (xx%), Siemens Energy AG (xx%), General Electric Company (xx%), Alstom SA (xx%), Others (xx%). These figures are estimates based on available data and expert analysis.
Innovation Catalysts: Stringent environmental regulations, the pursuit of energy security, and advancements in CCS technology are driving significant innovation within the industry.
Regulatory Landscape: Government policies promoting clean energy and reducing carbon emissions are shaping the market trajectory, with varying levels of support and regulation across different regions.
Substitute Products: Renewable energy sources such as solar, wind, and hydropower pose a competitive threat, although coal remains a significant energy source, particularly in developing economies. The increasing focus on decarbonization is influencing the balance between these options.
End-User Profiles: The key end-users are power generation companies, industrial facilities, and, to a lesser extent, residential and commercial heating systems. Large-scale power plants remain the largest consumers of CCT.
M&A Activity (2019-2024): A total of xx M&A deals were recorded, with an estimated total value of xx Million. These deals demonstrate consolidation trends within the industry and underscore the growing strategic importance of CCT.
Clean Coal Technology Industry Evolution
This section examines the historical and projected growth trajectory of the clean coal technology industry, tracing technological advancements and their influence on consumer demand. We explore the factors shaping market expansion and the evolution of dominant technologies.
From 2019 to 2024, the industry experienced a period of moderate growth, influenced by global economic conditions and fluctuating energy prices. However, the forecast period (2025-2033) anticipates accelerated growth fueled by increasingly stringent environmental regulations, technological breakthroughs in CCS and other technologies, and a rising global awareness of the climate crisis. We project a CAGR of xx% from 2025 to 2033, reaching a market valuation of xx Million by the end of the forecast period. Technological advancements, particularly in carbon capture and storage (CCS), are expected to be a key driver of this growth, enhancing the viability and appeal of coal-based energy production. Furthermore, increasing government incentives and investments in research and development are likely to accelerate the adoption of advanced clean coal technologies. While renewable energy sources continue to gain traction, coal is still expected to play a significant role in the global energy mix for the foreseeable future, fostering demand for clean coal technologies to mitigate its environmental impact. Consumer demand for cleaner energy sources is also pushing the industry towards innovative solutions that prioritize sustainability.
Leading Regions, Countries, or Segments in Clean Coal Technology Industry
This section identifies the dominant regions, countries, and segments within the clean coal technology market.
By Technology:
- Power Generation: This segment holds the largest market share, driven by the need to reduce emissions from existing and new coal-fired power plants.
- CCS (Carbon Capture and Storage): This technology is witnessing rapid growth, with significant investment in research and development, leading to improved efficiency and cost-effectiveness.
- Advanced Combustion Technologies: These technologies are becoming increasingly important for improving the efficiency and reducing the emissions of coal-fired power plants.
- Flue Gas Desulfurization (FGD): This mature technology remains crucial for controlling sulfur dioxide emissions and will continue to hold a significant market share.
- Selective Catalytic Reduction (SCR): This technology, used for reducing nitrogen oxide emissions, is crucial for regulatory compliance and maintaining air quality.
By Application:
- Power Generation: This sector remains the primary driver of CCT demand, accounting for a substantial majority of the market share.
- Industrial Processes: Industrial applications of CCT are growing steadily, particularly in sectors like cement and steel production.
- Residential and Commercial Heating: This segment, though smaller than others, shows potential for growth in regions relying heavily on coal for heating.
Key Drivers:
- Significant government investment in research, development, and deployment of CCT technologies, particularly in countries with large coal reserves.
- Stricter environmental regulations globally, mandating the adoption of cleaner coal technologies to meet emission reduction targets.
- The continued reliance on coal as a major energy source, particularly in developing nations, necessitates the development and use of CCT for environmental sustainability.
The Asia-Pacific region, particularly China and India, is expected to remain the dominant market due to their vast coal reserves and ongoing investments in infrastructure development.
Clean Coal Technology Industry Product Innovations
Recent innovations in CCT focus on enhancing the efficiency of carbon capture and storage systems, integrating advanced combustion techniques to minimize emissions, and developing more cost-effective flue gas treatment technologies. These advancements are aimed at improving the environmental performance of coal-fired power plants while increasing overall efficiency. Unique selling propositions frequently emphasize lower capital and operating costs, enhanced carbon capture rates, and reduced environmental footprint.
Propelling Factors for Clean Coal Technology Industry Growth
Several factors are driving the growth of the clean coal technology industry. Stringent environmental regulations worldwide are forcing power generation companies to adopt cleaner technologies. Furthermore, technological advancements, such as improvements in CCS technology, are making clean coal more economically viable. Government incentives and subsidies further promote the adoption of clean coal technologies. For instance, the Indian government's focus on sustainable mining and CCT, as illustrated by the IICT-NCL collaboration, highlights a major market driver.
Obstacles in the Clean Coal Technology Industry Market
Despite the growth potential, the industry faces significant challenges. The high capital cost of implementing CCS technology and other advanced clean coal technologies remains a major barrier to widespread adoption. Supply chain disruptions can impact the availability of critical components, hindering project timelines and escalating costs. Intense competition from renewable energy sources, supported by substantial government investment, poses a threat to the long-term viability of clean coal.
Future Opportunities in Clean Coal Technology Industry
Future opportunities lie in the development and commercialization of next-generation CCS technologies with higher capture rates and reduced costs. The integration of CCT with renewable energy sources to create hybrid power systems offers significant potential. Expanding into new geographical markets, particularly in developing countries with abundant coal reserves, presents further opportunities for growth.
Major Players in the Clean Coal Technology Industry Ecosystem
- Shell PLC
- KBR Inc
- Siemens Energy AG
- General Electric Company
- Alstom SA
- List Not Exhaustive
Key Developments in Clean Coal Technology Industry Industry
- October 2021: Adani Power Limited announced plans to commission the Godda Ultra Super Critical coal thermal power project, increasing demand for CCT.
- February 2022: The Indian Institute of Chemical Technology (IICT) launched a collaborative research project focusing on sustainable mining and clean coal technologies.
Strategic Clean Coal Technology Industry Market Forecast
The clean coal technology market is poised for significant growth driven by environmental regulations, technological advancements, and continued reliance on coal in the global energy mix. While challenges remain, the industry's focus on innovation, cost reduction, and integration with renewable energy sources will shape its future trajectory and unlock considerable market potential in the coming years. The continued development of more efficient and cost-effective CCS technologies, coupled with supportive government policies, will propel the market towards a sustainable and environmentally responsible future.
Clean Coal Technology Industry Segmentation
- 1. Production Analysis
- 2. Consumption Analysis
- 3. Import Market Analysis (Value & Volume)
- 4. Export Market Analysis (Value & Volume)
- 5. Price Trend Analysis
Clean Coal Technology Industry Segmentation By Geography
- 1. North America
- 2. Europe
- 3. Asia Pacific
- 4. Middle East and Africa
- 5. South America
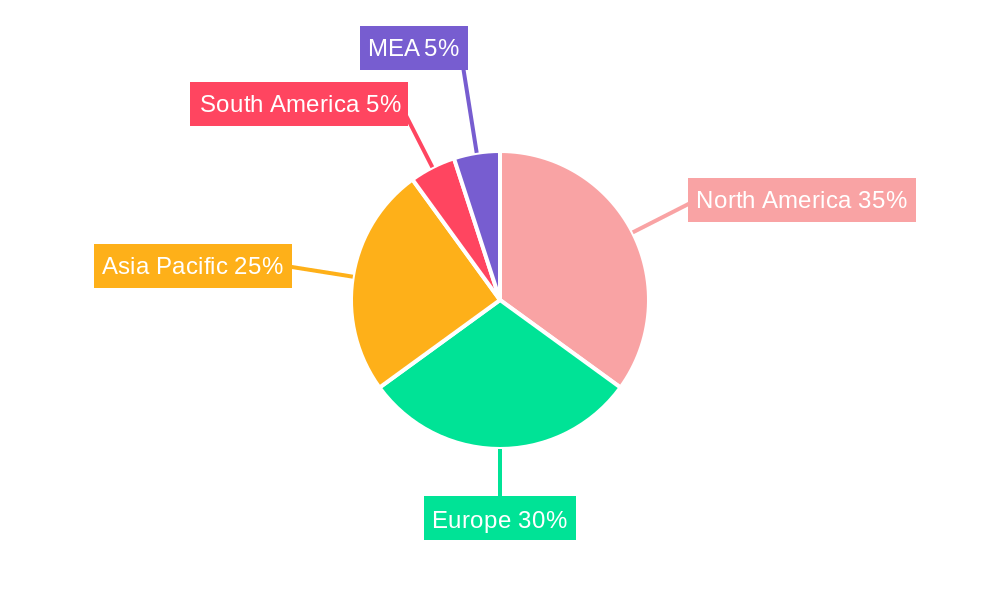
Clean Coal Technology Industry Regional Market Share
Geographic Coverage of Clean Coal Technology Industry
Clean Coal Technology Industry REPORT HIGHLIGHTS
| Aspects | Details |
|---|---|
| Study Period | 2020-2034 |
| Base Year | 2025 |
| Estimated Year | 2026 |
| Forecast Period | 2026-2034 |
| Historical Period | 2020-2025 |
| Growth Rate | CAGR of 6.39% from 2020-2034 |
| Segmentation |
|
Table of Contents
- 1. Introduction
- 1.1. Research Scope
- 1.2. Market Segmentation
- 1.3. Research Objective
- 1.4. Definitions and Assumptions
- 2. Executive Summary
- 2.1. Market Snapshot
- 3. Market Dynamics
- 3.1. Market Drivers
- 3.2. Market Restrains
- 3.3. Market Trends
- 3.4. Market Opportunities
- 4. Market Factor Analysis
- 4.1. Porters Five Forces
- 4.1.1. Bargaining Power of Suppliers
- 4.1.2. Bargaining Power of Buyers
- 4.1.3. Threat of New Entrants
- 4.1.4. Threat of Substitutes
- 4.1.5. Competitive Rivalry
- 4.2. PESTEL analysis
- 4.3. BCG Analysis
- 4.3.1. Stars (High Growth, High Market Share)
- 4.3.2. Cash Cows (Low Growth, High Market Share)
- 4.3.3. Question Mark (High Growth, Low Market Share)
- 4.3.4. Dogs (Low Growth, Low Market Share)
- 4.4. Ansoff Matrix Analysis
- 4.5. Supply Chain Analysis
- 4.6. Regulatory Landscape
- 4.7. Current Market Potential and Opportunity Assessment (TAM–SAM–SOM Framework)
- 4.8. DMV Analyst Note
- 4.1. Porters Five Forces
- 5. Market Analysis, Insights and Forecast 2021-2033
- 5.1. Market Analysis, Insights and Forecast - by Production Analysis
- 5.2. Market Analysis, Insights and Forecast - by Consumption Analysis
- 5.3. Market Analysis, Insights and Forecast - by Import Market Analysis (Value & Volume)
- 5.4. Market Analysis, Insights and Forecast - by Export Market Analysis (Value & Volume)
- 5.5. Market Analysis, Insights and Forecast - by Price Trend Analysis
- 5.6. Market Analysis, Insights and Forecast - by Region
- 5.6.1. North America
- 5.6.2. Europe
- 5.6.3. Asia Pacific
- 5.6.4. Middle East and Africa
- 5.6.5. South America
- 6. Global Clean Coal Technology Industry Analysis, Insights and Forecast, 2021-2033
- 6.1. Market Analysis, Insights and Forecast - by Production Analysis
- 6.2. Market Analysis, Insights and Forecast - by Consumption Analysis
- 6.3. Market Analysis, Insights and Forecast - by Import Market Analysis (Value & Volume)
- 6.4. Market Analysis, Insights and Forecast - by Export Market Analysis (Value & Volume)
- 6.5. Market Analysis, Insights and Forecast - by Price Trend Analysis
- 7. North America Clean Coal Technology Industry Analysis, Insights and Forecast, 2020-2032
- 7.1. Market Analysis, Insights and Forecast - by Production Analysis
- 7.2. Market Analysis, Insights and Forecast - by Consumption Analysis
- 7.3. Market Analysis, Insights and Forecast - by Import Market Analysis (Value & Volume)
- 7.4. Market Analysis, Insights and Forecast - by Export Market Analysis (Value & Volume)
- 7.5. Market Analysis, Insights and Forecast - by Price Trend Analysis
- 8. Europe Clean Coal Technology Industry Analysis, Insights and Forecast, 2020-2032
- 8.1. Market Analysis, Insights and Forecast - by Production Analysis
- 8.2. Market Analysis, Insights and Forecast - by Consumption Analysis
- 8.3. Market Analysis, Insights and Forecast - by Import Market Analysis (Value & Volume)
- 8.4. Market Analysis, Insights and Forecast - by Export Market Analysis (Value & Volume)
- 8.5. Market Analysis, Insights and Forecast - by Price Trend Analysis
- 9. Asia Pacific Clean Coal Technology Industry Analysis, Insights and Forecast, 2020-2032
- 9.1. Market Analysis, Insights and Forecast - by Production Analysis
- 9.2. Market Analysis, Insights and Forecast - by Consumption Analysis
- 9.3. Market Analysis, Insights and Forecast - by Import Market Analysis (Value & Volume)
- 9.4. Market Analysis, Insights and Forecast - by Export Market Analysis (Value & Volume)
- 9.5. Market Analysis, Insights and Forecast - by Price Trend Analysis
- 10. Middle East and Africa Clean Coal Technology Industry Analysis, Insights and Forecast, 2020-2032
- 10.1. Market Analysis, Insights and Forecast - by Production Analysis
- 10.2. Market Analysis, Insights and Forecast - by Consumption Analysis
- 10.3. Market Analysis, Insights and Forecast - by Import Market Analysis (Value & Volume)
- 10.4. Market Analysis, Insights and Forecast - by Export Market Analysis (Value & Volume)
- 10.5. Market Analysis, Insights and Forecast - by Price Trend Analysis
- 11. South America Clean Coal Technology Industry Analysis, Insights and Forecast, 2020-2032
- 11.1. Market Analysis, Insights and Forecast - by Production Analysis
- 11.2. Market Analysis, Insights and Forecast - by Consumption Analysis
- 11.3. Market Analysis, Insights and Forecast - by Import Market Analysis (Value & Volume)
- 11.4. Market Analysis, Insights and Forecast - by Export Market Analysis (Value & Volume)
- 11.5. Market Analysis, Insights and Forecast - by Price Trend Analysis
- 12. Competitive Analysis
- 12.1. Company Profiles
- 12.1.1 Shell PLC
- 12.1.1.1. Company Overview
- 12.1.1.2. Products
- 12.1.1.3. Company Financials
- 12.1.1.4. SWOT Analysis
- 12.1.2 KBR Inc
- 12.1.2.1. Company Overview
- 12.1.2.2. Products
- 12.1.2.3. Company Financials
- 12.1.2.4. SWOT Analysis
- 12.1.3 Siemens Energy AG
- 12.1.3.1. Company Overview
- 12.1.3.2. Products
- 12.1.3.3. Company Financials
- 12.1.3.4. SWOT Analysis
- 12.1.4 General Electric Company
- 12.1.4.1. Company Overview
- 12.1.4.2. Products
- 12.1.4.3. Company Financials
- 12.1.4.4. SWOT Analysis
- 12.1.5 Alstom SA*List Not Exhaustive
- 12.1.5.1. Company Overview
- 12.1.5.2. Products
- 12.1.5.3. Company Financials
- 12.1.5.4. SWOT Analysis
- 12.1.1 Shell PLC
- 12.2. Market Entropy
- 12.2.1 Company's Key Areas Served
- 12.2.2 Recent Developments
- 12.3. Company Market Share Analysis 2025
- 12.3.1 Top 5 Companies Market Share Analysis
- 12.3.2 Top 3 Companies Market Share Analysis
- 12.4. List of Potential Customers
- 13. Research Methodology
List of Figures
- Figure 1: Global Clean Coal Technology Industry Revenue Breakdown (billion, %) by Region 2025 & 2033
- Figure 2: North America Clean Coal Technology Industry Revenue (billion), by Production Analysis 2025 & 2033
- Figure 3: North America Clean Coal Technology Industry Revenue Share (%), by Production Analysis 2025 & 2033
- Figure 4: North America Clean Coal Technology Industry Revenue (billion), by Consumption Analysis 2025 & 2033
- Figure 5: North America Clean Coal Technology Industry Revenue Share (%), by Consumption Analysis 2025 & 2033
- Figure 6: North America Clean Coal Technology Industry Revenue (billion), by Import Market Analysis (Value & Volume) 2025 & 2033
- Figure 7: North America Clean Coal Technology Industry Revenue Share (%), by Import Market Analysis (Value & Volume) 2025 & 2033
- Figure 8: North America Clean Coal Technology Industry Revenue (billion), by Export Market Analysis (Value & Volume) 2025 & 2033
- Figure 9: North America Clean Coal Technology Industry Revenue Share (%), by Export Market Analysis (Value & Volume) 2025 & 2033
- Figure 10: North America Clean Coal Technology Industry Revenue (billion), by Price Trend Analysis 2025 & 2033
- Figure 11: North America Clean Coal Technology Industry Revenue Share (%), by Price Trend Analysis 2025 & 2033
- Figure 12: North America Clean Coal Technology Industry Revenue (billion), by Country 2025 & 2033
- Figure 13: North America Clean Coal Technology Industry Revenue Share (%), by Country 2025 & 2033
- Figure 14: Europe Clean Coal Technology Industry Revenue (billion), by Production Analysis 2025 & 2033
- Figure 15: Europe Clean Coal Technology Industry Revenue Share (%), by Production Analysis 2025 & 2033
- Figure 16: Europe Clean Coal Technology Industry Revenue (billion), by Consumption Analysis 2025 & 2033
- Figure 17: Europe Clean Coal Technology Industry Revenue Share (%), by Consumption Analysis 2025 & 2033
- Figure 18: Europe Clean Coal Technology Industry Revenue (billion), by Import Market Analysis (Value & Volume) 2025 & 2033
- Figure 19: Europe Clean Coal Technology Industry Revenue Share (%), by Import Market Analysis (Value & Volume) 2025 & 2033
- Figure 20: Europe Clean Coal Technology Industry Revenue (billion), by Export Market Analysis (Value & Volume) 2025 & 2033
- Figure 21: Europe Clean Coal Technology Industry Revenue Share (%), by Export Market Analysis (Value & Volume) 2025 & 2033
- Figure 22: Europe Clean Coal Technology Industry Revenue (billion), by Price Trend Analysis 2025 & 2033
- Figure 23: Europe Clean Coal Technology Industry Revenue Share (%), by Price Trend Analysis 2025 & 2033
- Figure 24: Europe Clean Coal Technology Industry Revenue (billion), by Country 2025 & 2033
- Figure 25: Europe Clean Coal Technology Industry Revenue Share (%), by Country 2025 & 2033
- Figure 26: Asia Pacific Clean Coal Technology Industry Revenue (billion), by Production Analysis 2025 & 2033
- Figure 27: Asia Pacific Clean Coal Technology Industry Revenue Share (%), by Production Analysis 2025 & 2033
- Figure 28: Asia Pacific Clean Coal Technology Industry Revenue (billion), by Consumption Analysis 2025 & 2033
- Figure 29: Asia Pacific Clean Coal Technology Industry Revenue Share (%), by Consumption Analysis 2025 & 2033
- Figure 30: Asia Pacific Clean Coal Technology Industry Revenue (billion), by Import Market Analysis (Value & Volume) 2025 & 2033
- Figure 31: Asia Pacific Clean Coal Technology Industry Revenue Share (%), by Import Market Analysis (Value & Volume) 2025 & 2033
- Figure 32: Asia Pacific Clean Coal Technology Industry Revenue (billion), by Export Market Analysis (Value & Volume) 2025 & 2033
- Figure 33: Asia Pacific Clean Coal Technology Industry Revenue Share (%), by Export Market Analysis (Value & Volume) 2025 & 2033
- Figure 34: Asia Pacific Clean Coal Technology Industry Revenue (billion), by Price Trend Analysis 2025 & 2033
- Figure 35: Asia Pacific Clean Coal Technology Industry Revenue Share (%), by Price Trend Analysis 2025 & 2033
- Figure 36: Asia Pacific Clean Coal Technology Industry Revenue (billion), by Country 2025 & 2033
- Figure 37: Asia Pacific Clean Coal Technology Industry Revenue Share (%), by Country 2025 & 2033
- Figure 38: Middle East and Africa Clean Coal Technology Industry Revenue (billion), by Production Analysis 2025 & 2033
- Figure 39: Middle East and Africa Clean Coal Technology Industry Revenue Share (%), by Production Analysis 2025 & 2033
- Figure 40: Middle East and Africa Clean Coal Technology Industry Revenue (billion), by Consumption Analysis 2025 & 2033
- Figure 41: Middle East and Africa Clean Coal Technology Industry Revenue Share (%), by Consumption Analysis 2025 & 2033
- Figure 42: Middle East and Africa Clean Coal Technology Industry Revenue (billion), by Import Market Analysis (Value & Volume) 2025 & 2033
- Figure 43: Middle East and Africa Clean Coal Technology Industry Revenue Share (%), by Import Market Analysis (Value & Volume) 2025 & 2033
- Figure 44: Middle East and Africa Clean Coal Technology Industry Revenue (billion), by Export Market Analysis (Value & Volume) 2025 & 2033
- Figure 45: Middle East and Africa Clean Coal Technology Industry Revenue Share (%), by Export Market Analysis (Value & Volume) 2025 & 2033
- Figure 46: Middle East and Africa Clean Coal Technology Industry Revenue (billion), by Price Trend Analysis 2025 & 2033
- Figure 47: Middle East and Africa Clean Coal Technology Industry Revenue Share (%), by Price Trend Analysis 2025 & 2033
- Figure 48: Middle East and Africa Clean Coal Technology Industry Revenue (billion), by Country 2025 & 2033
- Figure 49: Middle East and Africa Clean Coal Technology Industry Revenue Share (%), by Country 2025 & 2033
- Figure 50: South America Clean Coal Technology Industry Revenue (billion), by Production Analysis 2025 & 2033
- Figure 51: South America Clean Coal Technology Industry Revenue Share (%), by Production Analysis 2025 & 2033
- Figure 52: South America Clean Coal Technology Industry Revenue (billion), by Consumption Analysis 2025 & 2033
- Figure 53: South America Clean Coal Technology Industry Revenue Share (%), by Consumption Analysis 2025 & 2033
- Figure 54: South America Clean Coal Technology Industry Revenue (billion), by Import Market Analysis (Value & Volume) 2025 & 2033
- Figure 55: South America Clean Coal Technology Industry Revenue Share (%), by Import Market Analysis (Value & Volume) 2025 & 2033
- Figure 56: South America Clean Coal Technology Industry Revenue (billion), by Export Market Analysis (Value & Volume) 2025 & 2033
- Figure 57: South America Clean Coal Technology Industry Revenue Share (%), by Export Market Analysis (Value & Volume) 2025 & 2033
- Figure 58: South America Clean Coal Technology Industry Revenue (billion), by Price Trend Analysis 2025 & 2033
- Figure 59: South America Clean Coal Technology Industry Revenue Share (%), by Price Trend Analysis 2025 & 2033
- Figure 60: South America Clean Coal Technology Industry Revenue (billion), by Country 2025 & 2033
- Figure 61: South America Clean Coal Technology Industry Revenue Share (%), by Country 2025 & 2033
List of Tables
- Table 1: Global Clean Coal Technology Industry Revenue billion Forecast, by Production Analysis 2020 & 2033
- Table 2: Global Clean Coal Technology Industry Revenue billion Forecast, by Consumption Analysis 2020 & 2033
- Table 3: Global Clean Coal Technology Industry Revenue billion Forecast, by Import Market Analysis (Value & Volume) 2020 & 2033
- Table 4: Global Clean Coal Technology Industry Revenue billion Forecast, by Export Market Analysis (Value & Volume) 2020 & 2033
- Table 5: Global Clean Coal Technology Industry Revenue billion Forecast, by Price Trend Analysis 2020 & 2033
- Table 6: Global Clean Coal Technology Industry Revenue billion Forecast, by Region 2020 & 2033
- Table 7: Global Clean Coal Technology Industry Revenue billion Forecast, by Production Analysis 2020 & 2033
- Table 8: Global Clean Coal Technology Industry Revenue billion Forecast, by Consumption Analysis 2020 & 2033
- Table 9: Global Clean Coal Technology Industry Revenue billion Forecast, by Import Market Analysis (Value & Volume) 2020 & 2033
- Table 10: Global Clean Coal Technology Industry Revenue billion Forecast, by Export Market Analysis (Value & Volume) 2020 & 2033
- Table 11: Global Clean Coal Technology Industry Revenue billion Forecast, by Price Trend Analysis 2020 & 2033
- Table 12: Global Clean Coal Technology Industry Revenue billion Forecast, by Country 2020 & 2033
- Table 13: Global Clean Coal Technology Industry Revenue billion Forecast, by Production Analysis 2020 & 2033
- Table 14: Global Clean Coal Technology Industry Revenue billion Forecast, by Consumption Analysis 2020 & 2033
- Table 15: Global Clean Coal Technology Industry Revenue billion Forecast, by Import Market Analysis (Value & Volume) 2020 & 2033
- Table 16: Global Clean Coal Technology Industry Revenue billion Forecast, by Export Market Analysis (Value & Volume) 2020 & 2033
- Table 17: Global Clean Coal Technology Industry Revenue billion Forecast, by Price Trend Analysis 2020 & 2033
- Table 18: Global Clean Coal Technology Industry Revenue billion Forecast, by Country 2020 & 2033
- Table 19: Global Clean Coal Technology Industry Revenue billion Forecast, by Production Analysis 2020 & 2033
- Table 20: Global Clean Coal Technology Industry Revenue billion Forecast, by Consumption Analysis 2020 & 2033
- Table 21: Global Clean Coal Technology Industry Revenue billion Forecast, by Import Market Analysis (Value & Volume) 2020 & 2033
- Table 22: Global Clean Coal Technology Industry Revenue billion Forecast, by Export Market Analysis (Value & Volume) 2020 & 2033
- Table 23: Global Clean Coal Technology Industry Revenue billion Forecast, by Price Trend Analysis 2020 & 2033
- Table 24: Global Clean Coal Technology Industry Revenue billion Forecast, by Country 2020 & 2033
- Table 25: Global Clean Coal Technology Industry Revenue billion Forecast, by Production Analysis 2020 & 2033
- Table 26: Global Clean Coal Technology Industry Revenue billion Forecast, by Consumption Analysis 2020 & 2033
- Table 27: Global Clean Coal Technology Industry Revenue billion Forecast, by Import Market Analysis (Value & Volume) 2020 & 2033
- Table 28: Global Clean Coal Technology Industry Revenue billion Forecast, by Export Market Analysis (Value & Volume) 2020 & 2033
- Table 29: Global Clean Coal Technology Industry Revenue billion Forecast, by Price Trend Analysis 2020 & 2033
- Table 30: Global Clean Coal Technology Industry Revenue billion Forecast, by Country 2020 & 2033
- Table 31: Global Clean Coal Technology Industry Revenue billion Forecast, by Production Analysis 2020 & 2033
- Table 32: Global Clean Coal Technology Industry Revenue billion Forecast, by Consumption Analysis 2020 & 2033
- Table 33: Global Clean Coal Technology Industry Revenue billion Forecast, by Import Market Analysis (Value & Volume) 2020 & 2033
- Table 34: Global Clean Coal Technology Industry Revenue billion Forecast, by Export Market Analysis (Value & Volume) 2020 & 2033
- Table 35: Global Clean Coal Technology Industry Revenue billion Forecast, by Price Trend Analysis 2020 & 2033
- Table 36: Global Clean Coal Technology Industry Revenue billion Forecast, by Country 2020 & 2033
Frequently Asked Questions
1. What is the projected Compound Annual Growth Rate (CAGR) of the Clean Coal Technology Industry?
The projected CAGR is approximately 6.39%.
2. Which companies are prominent players in the Clean Coal Technology Industry?
Key companies in the market include Shell PLC, KBR Inc, Siemens Energy AG, General Electric Company, Alstom SA*List Not Exhaustive.
3. What are the main segments of the Clean Coal Technology Industry?
The market segments include Production Analysis, Consumption Analysis, Import Market Analysis (Value & Volume), Export Market Analysis (Value & Volume), Price Trend Analysis.
4. Can you provide details about the market size?
The market size is estimated to be USD 4.57 billion as of 2022.
5. What are some drivers contributing to market growth?
4.; Modernization and Upgrades of Existing Military Aircraft Fleets4.; Increasing Defense Budgets.
6. What are the notable trends driving market growth?
Growth in Power Consumption is Likely to Drive the Market.
7. Are there any restraints impacting market growth?
4.; Shift Toward Unmanned Aircraft.
8. Can you provide examples of recent developments in the market?
In February 2022, the Indian Institute of Chemical Technology (IICT) announced a collaborative project of approximately INR 7.31 core with Northern Coalfields Limits (NCL), Madhya Pradesh (MP), to take up research and development in the field of sustainable mining and clean coal technologies (CCT).
9. What pricing options are available for accessing the report?
Pricing options include single-user, multi-user, and enterprise licenses priced at USD 4750, USD 5250, and USD 8750 respectively.
10. Is the market size provided in terms of value or volume?
The market size is provided in terms of value, measured in billion.
11. Are there any specific market keywords associated with the report?
Yes, the market keyword associated with the report is "Clean Coal Technology Industry," which aids in identifying and referencing the specific market segment covered.
12. How do I determine which pricing option suits my needs best?
The pricing options vary based on user requirements and access needs. Individual users may opt for single-user licenses, while businesses requiring broader access may choose multi-user or enterprise licenses for cost-effective access to the report.
13. Are there any additional resources or data provided in the Clean Coal Technology Industry report?
While the report offers comprehensive insights, it's advisable to review the specific contents or supplementary materials provided to ascertain if additional resources or data are available.
14. How can I stay updated on further developments or reports in the Clean Coal Technology Industry?
To stay informed about further developments, trends, and reports in the Clean Coal Technology Industry, consider subscribing to industry newsletters, following relevant companies and organizations, or regularly checking reputable industry news sources and publications.
Methodology
Step 1 - Identification of Relevant Samples Size from Population Database


Step 2 - Approaches for Defining Global Market Size (Value, Volume* & Price*)

Note*: In applicable scenarios
Step 3 - Data Sources
Primary Research
- Web Analytics
- Survey Reports
- Research Institute
- Latest Research Reports
- Opinion Leaders
Secondary Research
- Annual Reports
- White Paper
- Latest Press Release
- Industry Association
- Paid Database
- Investor Presentations

Step 4 - Data Triangulation
Involves using different sources of information in order to increase the validity of a study
These sources are likely to be stakeholders in a program - participants, other researchers, program staff, other community members, and so on.
Then we put all data in single framework & apply various statistical tools to find out the dynamic on the market.
During the analysis stage, feedback from the stakeholder groups would be compared to determine areas of agreement as well as areas of divergence