

Key Insights
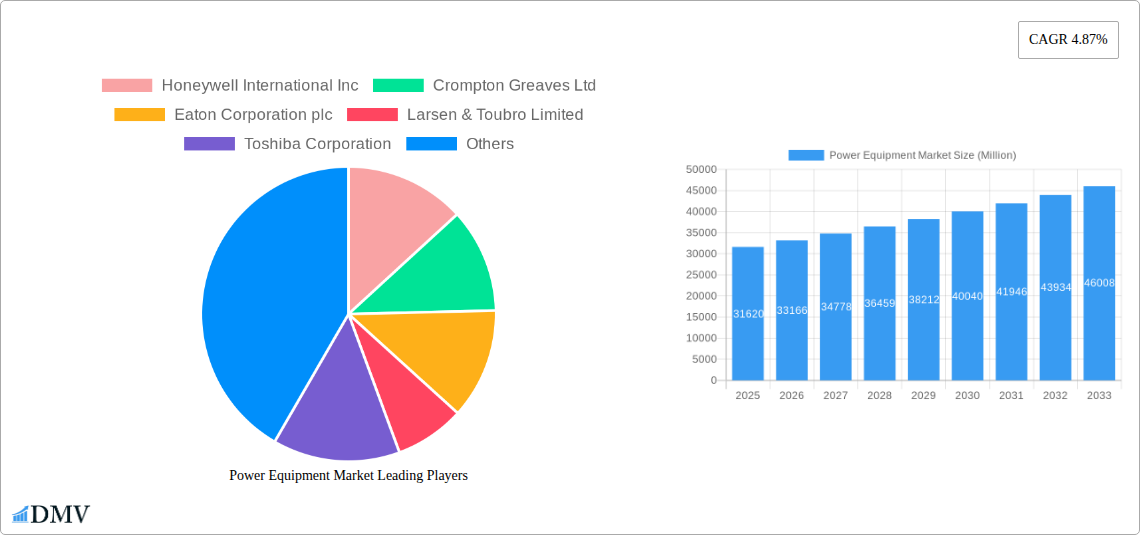
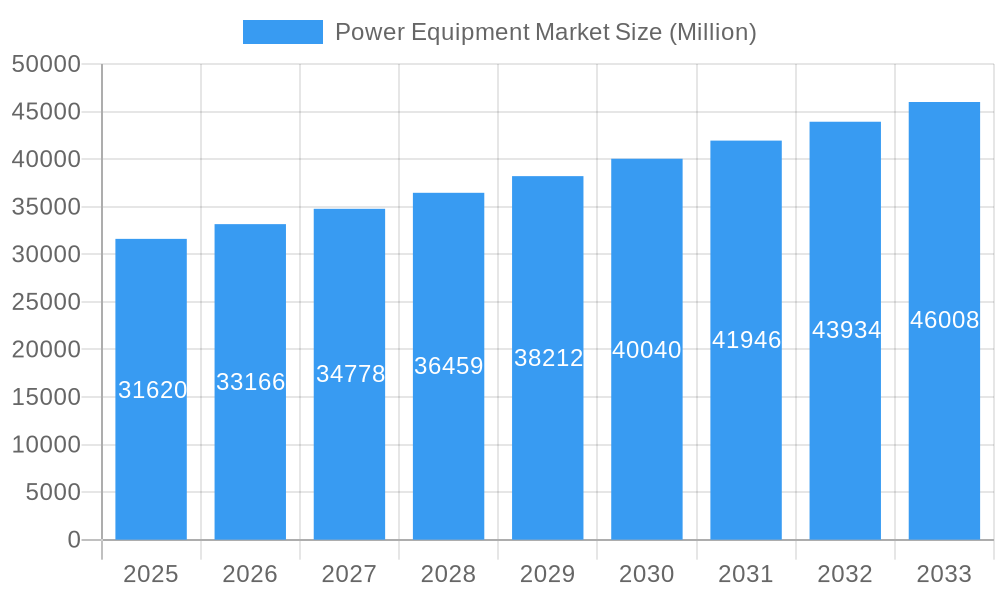
The global power equipment market, valued at $31.62 billion in 2025, is projected to experience robust growth, driven by increasing energy demand, expanding renewable energy adoption, and the modernization of aging power infrastructure. A compound annual growth rate (CAGR) of 4.87% from 2025 to 2033 indicates a substantial market expansion. Key growth drivers include the global shift towards renewable energy sources like solar and wind power, necessitating substantial investments in related equipment. Furthermore, the burgeoning industrial sector, particularly in developing economies of Asia-Pacific, fuels demand for reliable and efficient power equipment. Government initiatives promoting grid modernization and energy efficiency also contribute significantly to market expansion. While challenges exist, such as fluctuating raw material prices and supply chain disruptions, the overall market outlook remains positive. Technological advancements in power electronics and smart grid technologies are creating new market opportunities. Segment-wise, the renewable energy-based power generation source is expected to witness significant growth, surpassing the fossil fuel-based segment in the latter half of the forecast period. Similarly, the industrial and commercial end-user segment will likely dominate the market, followed by the utility sector.
Power Equipment Market Market Size (In Billion)
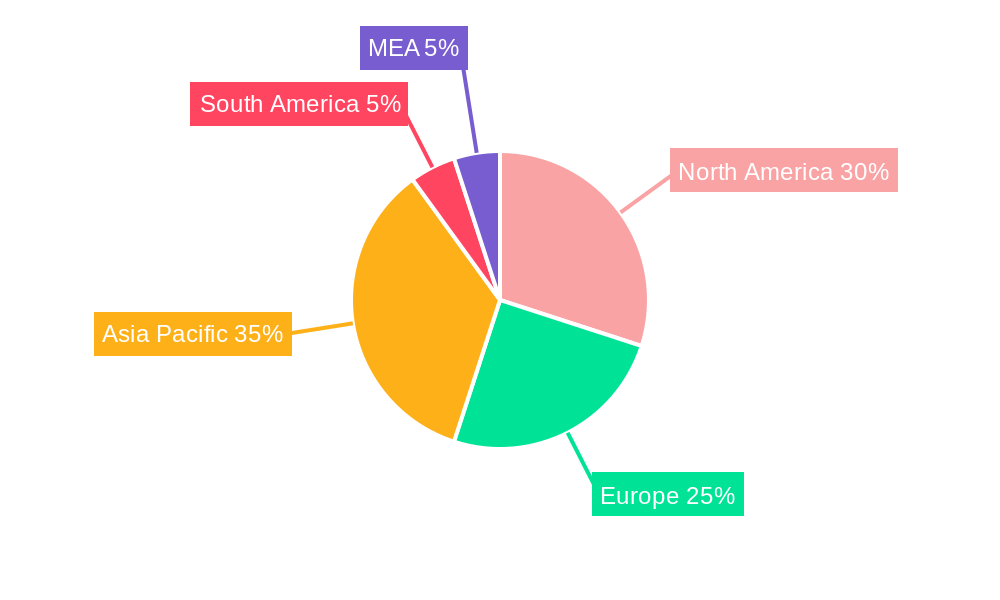
The regional market landscape demonstrates diverse growth patterns. North America and Europe, characterized by mature power infrastructure and ongoing grid upgrades, will exhibit steady growth. However, the Asia-Pacific region, experiencing rapid industrialization and urbanization, is anticipated to be the fastest-growing market, driven by strong demand from countries like China and India. Strong governmental support for renewable energy projects will further enhance this growth trajectory. Competition within the market is intense, with major players like ABB, Siemens, General Electric, and Schneider Electric dominating market share. These companies continuously invest in R&D, strategic partnerships, and mergers & acquisitions to maintain a competitive edge and expand their global reach. The market's future success hinges on addressing sustainability concerns, integrating smart technologies, and navigating evolving regulatory landscapes.
Power Equipment Market Company Market Share
Power Equipment Market Report: 2019-2033
This comprehensive report provides an in-depth analysis of the global Power Equipment Market, offering invaluable insights for stakeholders seeking to navigate this dynamic landscape. The study period covers 2019-2033, with a base year of 2025 and a forecast period of 2025-2033. The report leverages extensive data analysis from the historical period (2019-2024) to provide accurate projections and actionable recommendations. The market is segmented by Equipment Type (Generator, Transformer, Switchgears, Circuit Breakers, Power Cable, Other Equipment Types), Power Generation Source (Fossil Fuel Based, Solar, Wind, Nuclear, Hydro), End-User (Residential, Industrial and Commercial, Utility), and Application (Power Generation, Transmission, Distribution). Key players analyzed include Honeywell International Inc, Crompton Greaves Ltd, Eaton Corporation plc, Larsen & Toubro Limited, Toshiba Corporation, Fuji Electric Co Ltd, Bharat Heavy Electricals Limited, Mitsubishi Electric Corporation, Siemens AG, Schneider Electric SE, ABB Ltd, Rockwell Automation Inc, and General Electric Company. The total market size is estimated to reach xx Million by 2033.
Power Equipment Market Composition & Trends
This section analyzes the competitive landscape, highlighting market share distribution among key players. We delve into the factors driving innovation, including technological advancements and regulatory pressures. The impact of substitute products and evolving end-user preferences is also examined. Finally, the report explores merger and acquisition (M&A) activities, providing insights into deal values and their influence on market consolidation.
- Market Concentration: The market exhibits a moderately concentrated structure, with the top five players accounting for approximately xx% of the global market share in 2024.
- Innovation Catalysts: Stringent emission regulations and the growing adoption of renewable energy sources are driving innovation in energy-efficient power equipment.
- Regulatory Landscape: Government policies promoting renewable energy integration and grid modernization significantly influence market growth.
- Substitute Products: The emergence of alternative energy technologies and storage solutions poses a potential threat, impacting the demand for certain equipment types.
- End-User Profiles: The industrial and commercial sectors are projected to dominate the market due to increasing infrastructure development and energy needs.
- M&A Activities: The past five years have witnessed xx M&A deals, valued at approximately xx Million, primarily driven by strategies to expand market share and access new technologies.
Power Equipment Market Industry Evolution
This section details the market's growth trajectory since 2019, examining technological advancements and shifts in consumer demand. We analyze growth rates across different segments and regions, and explore the adoption rates of new technologies such as smart grids and energy storage systems. The global power equipment market experienced a CAGR of xx% during the historical period (2019-2024) and is projected to maintain a CAGR of xx% during the forecast period (2025-2033). This growth is primarily attributed to increasing energy demand, infrastructure development, and the global transition towards cleaner energy sources. The adoption of advanced technologies like AI and IoT in power equipment is further accelerating market growth.
Leading Regions, Countries, or Segments in Power Equipment Market
This section identifies the leading regions, countries, and segments within the power equipment market. Growth drivers such as investment trends and regulatory support are highlighted for each dominant segment.
- Dominant Region: Asia Pacific is projected to be the leading region, driven by rapid industrialization and infrastructure development, particularly in countries like India and China.
- Dominant Equipment Type: Transformers and switchgears are expected to hold the largest market share, owing to their critical role in power transmission and distribution.
- Dominant Power Generation Source: While fossil fuel-based power generation continues to dominate, the market share of renewable sources, particularly solar and wind, is rapidly growing due to governmental incentives and environmental concerns.
- Dominant End-User: The utility sector will remain a key driver of market growth, due to the ongoing expansion and modernization of power grids worldwide.
- Key Drivers: Increased investments in renewable energy projects, supportive government policies, and improving grid infrastructure are key drivers for growth in the leading segments and regions.
Power Equipment Market Product Innovations
Recent years have witnessed significant innovation in power equipment, focusing on improved efficiency, reliability, and smart functionalities. The introduction of advanced materials, enhanced control systems, and digital technologies has resulted in products with higher power output, longer lifespans, and reduced operational costs. For example, the new CAT 60 Volt range, launched in May 2023, showcases the integration of intelligent battery management systems for enhanced performance and safety. These innovations are attracting investments and driving market growth.
Propelling Factors for Power Equipment Market Growth
Several factors are driving the growth of the power equipment market. Increased investments in renewable energy infrastructure, coupled with government policies promoting energy efficiency and grid modernization, are significantly contributing to this growth. Furthermore, rapid urbanization and industrialization across developing economies are creating a substantial demand for power equipment. The rising adoption of smart grids and smart meters is also boosting market expansion.
Obstacles in the Power Equipment Market
Despite the positive outlook, the power equipment market faces certain challenges. Supply chain disruptions and fluctuations in raw material prices can negatively impact production and profitability. Stringent environmental regulations and increasing competition from new market entrants also pose significant challenges for existing players. The unpredictable nature of renewable energy sources adds complexity to grid management, requiring advanced equipment and solutions.
Future Opportunities in Power Equipment Market
Future growth opportunities lie in the expanding adoption of renewable energy technologies, the development of smart grids, and the increasing demand for energy storage solutions. Emerging markets in developing economies present substantial growth potential. Furthermore, the integration of advanced technologies, such as AI and IoT, into power equipment is expected to unlock new market opportunities.
Major Players in the Power Equipment Market Ecosystem
Key Developments in Power Equipment Market Industry
- May 2023: CAT launched its new power equipment product, the CAT 60 Volt range, featuring advanced lithium-ion batteries with intelligent management systems. This launch signifies a move towards higher efficiency and smarter power tools.
- May 2022: The Indian government proposed a scheme to establish three manufacturing zones for power equipment by 2026-27, boosting domestic manufacturing and potentially attracting significant foreign investment.
Strategic Power Equipment Market Forecast
The power equipment market is poised for robust growth over the next decade, driven by increasing energy demand, the global transition to renewable energy, and advancements in smart grid technologies. The continuous innovation in product design and functionalities, coupled with favorable government policies, will further accelerate market expansion. The market presents lucrative opportunities for players who can adapt to evolving technologies and cater to the growing demand for sustainable and efficient power solutions.
Power Equipment Market Segmentation
-
1. Equipment Type
- 1.1. Generator
- 1.2. Transformer
- 1.3. Switchgears
- 1.4. Circuit Breakers
- 1.5. Power Cable
- 1.6. Other Equipment Types
-
2. Power Generation Source
- 2.1. Fossil Fuel Based
- 2.2. Solar
- 2.3. Wind
- 2.4. Nuclear
- 2.5. Hydro
-
3. End-User
- 3.1. Residential
- 3.2. Industrial and Commercial
- 3.3. Utility
-
4. Application
- 4.1. Power Generation
- 4.2. Transmission
- 4.3. Distribution
Power Equipment Market Segmentation By Geography
-
1. North America
- 1.1. United States
- 1.2. Canada
- 1.3. Rest of North America
-
2. Europe
- 2.1. Germany
- 2.2. France
- 2.3. United Kingdom
- 2.4. Russia
- 2.5. Rest of Europe
-
3. Asia Pacific
- 3.1. China
- 3.2. India
- 3.3. Australia
- 3.4. Japan
- 3.5. Rest of Asia Pacific
-
4. Middle East and Africa
- 4.1. Saudi Arabia
- 4.2. United Arab Emirates
- 4.3. Nigeria
- 4.4. South Africa
- 4.5. Rest of Middle East and Africa
-
5. South America
- 5.1. Brazil
- 5.2. Argentina
- 5.3. Chile
- 5.4. Rest of South America
Power Equipment Market Regional Market Share
Geographic Coverage of Power Equipment Market
Power Equipment Market REPORT HIGHLIGHTS
| Aspects | Details |
|---|---|
| Study Period | 2020-2034 |
| Base Year | 2025 |
| Estimated Year | 2026 |
| Forecast Period | 2026-2034 |
| Historical Period | 2020-2025 |
| Growth Rate | CAGR of 4.87% from 2020-2034 |
| Segmentation |
|
Table of Contents
- 1. Introduction
- 1.1. Research Scope
- 1.2. Market Segmentation
- 1.3. Research Objective
- 1.4. Definitions and Assumptions
- 2. Executive Summary
- 2.1. Market Snapshot
- 3. Market Dynamics
- 3.1. Market Drivers
- 3.2. Market Restrains
- 3.3. Market Trends
- 3.4. Market Opportunities
- 4. Market Factor Analysis
- 4.1. Porters Five Forces
- 4.1.1. Bargaining Power of Suppliers
- 4.1.2. Bargaining Power of Buyers
- 4.1.3. Threat of New Entrants
- 4.1.4. Threat of Substitutes
- 4.1.5. Competitive Rivalry
- 4.2. PESTEL analysis
- 4.3. BCG Analysis
- 4.3.1. Stars (High Growth, High Market Share)
- 4.3.2. Cash Cows (Low Growth, High Market Share)
- 4.3.3. Question Mark (High Growth, Low Market Share)
- 4.3.4. Dogs (Low Growth, Low Market Share)
- 4.4. Ansoff Matrix Analysis
- 4.5. Supply Chain Analysis
- 4.6. Regulatory Landscape
- 4.7. Current Market Potential and Opportunity Assessment (TAM–SAM–SOM Framework)
- 4.8. DMV Analyst Note
- 4.1. Porters Five Forces
- 5. Market Analysis, Insights and Forecast 2021-2033
- 5.1. Market Analysis, Insights and Forecast - by Equipment Type
- 5.1.1. Generator
- 5.1.2. Transformer
- 5.1.3. Switchgears
- 5.1.4. Circuit Breakers
- 5.1.5. Power Cable
- 5.1.6. Other Equipment Types
- 5.2. Market Analysis, Insights and Forecast - by Power Generation Source
- 5.2.1. Fossil Fuel Based
- 5.2.2. Solar
- 5.2.3. Wind
- 5.2.4. Nuclear
- 5.2.5. Hydro
- 5.3. Market Analysis, Insights and Forecast - by End-User
- 5.3.1. Residential
- 5.3.2. Industrial and Commercial
- 5.3.3. Utility
- 5.4. Market Analysis, Insights and Forecast - by Application
- 5.4.1. Power Generation
- 5.4.2. Transmission
- 5.4.3. Distribution
- 5.5. Market Analysis, Insights and Forecast - by Region
- 5.5.1. North America
- 5.5.2. Europe
- 5.5.3. Asia Pacific
- 5.5.4. Middle East and Africa
- 5.5.5. South America
- 5.1. Market Analysis, Insights and Forecast - by Equipment Type
- 6. Global Power Equipment Market Analysis, Insights and Forecast, 2021-2033
- 6.1. Market Analysis, Insights and Forecast - by Equipment Type
- 6.1.1. Generator
- 6.1.2. Transformer
- 6.1.3. Switchgears
- 6.1.4. Circuit Breakers
- 6.1.5. Power Cable
- 6.1.6. Other Equipment Types
- 6.2. Market Analysis, Insights and Forecast - by Power Generation Source
- 6.2.1. Fossil Fuel Based
- 6.2.2. Solar
- 6.2.3. Wind
- 6.2.4. Nuclear
- 6.2.5. Hydro
- 6.3. Market Analysis, Insights and Forecast - by End-User
- 6.3.1. Residential
- 6.3.2. Industrial and Commercial
- 6.3.3. Utility
- 6.4. Market Analysis, Insights and Forecast - by Application
- 6.4.1. Power Generation
- 6.4.2. Transmission
- 6.4.3. Distribution
- 6.1. Market Analysis, Insights and Forecast - by Equipment Type
- 7. North America Power Equipment Market Analysis, Insights and Forecast, 2020-2032
- 7.1. Market Analysis, Insights and Forecast - by Equipment Type
- 7.1.1. Generator
- 7.1.2. Transformer
- 7.1.3. Switchgears
- 7.1.4. Circuit Breakers
- 7.1.5. Power Cable
- 7.1.6. Other Equipment Types
- 7.2. Market Analysis, Insights and Forecast - by Power Generation Source
- 7.2.1. Fossil Fuel Based
- 7.2.2. Solar
- 7.2.3. Wind
- 7.2.4. Nuclear
- 7.2.5. Hydro
- 7.3. Market Analysis, Insights and Forecast - by End-User
- 7.3.1. Residential
- 7.3.2. Industrial and Commercial
- 7.3.3. Utility
- 7.4. Market Analysis, Insights and Forecast - by Application
- 7.4.1. Power Generation
- 7.4.2. Transmission
- 7.4.3. Distribution
- 7.1. Market Analysis, Insights and Forecast - by Equipment Type
- 8. Europe Power Equipment Market Analysis, Insights and Forecast, 2020-2032
- 8.1. Market Analysis, Insights and Forecast - by Equipment Type
- 8.1.1. Generator
- 8.1.2. Transformer
- 8.1.3. Switchgears
- 8.1.4. Circuit Breakers
- 8.1.5. Power Cable
- 8.1.6. Other Equipment Types
- 8.2. Market Analysis, Insights and Forecast - by Power Generation Source
- 8.2.1. Fossil Fuel Based
- 8.2.2. Solar
- 8.2.3. Wind
- 8.2.4. Nuclear
- 8.2.5. Hydro
- 8.3. Market Analysis, Insights and Forecast - by End-User
- 8.3.1. Residential
- 8.3.2. Industrial and Commercial
- 8.3.3. Utility
- 8.4. Market Analysis, Insights and Forecast - by Application
- 8.4.1. Power Generation
- 8.4.2. Transmission
- 8.4.3. Distribution
- 8.1. Market Analysis, Insights and Forecast - by Equipment Type
- 9. Asia Pacific Power Equipment Market Analysis, Insights and Forecast, 2020-2032
- 9.1. Market Analysis, Insights and Forecast - by Equipment Type
- 9.1.1. Generator
- 9.1.2. Transformer
- 9.1.3. Switchgears
- 9.1.4. Circuit Breakers
- 9.1.5. Power Cable
- 9.1.6. Other Equipment Types
- 9.2. Market Analysis, Insights and Forecast - by Power Generation Source
- 9.2.1. Fossil Fuel Based
- 9.2.2. Solar
- 9.2.3. Wind
- 9.2.4. Nuclear
- 9.2.5. Hydro
- 9.3. Market Analysis, Insights and Forecast - by End-User
- 9.3.1. Residential
- 9.3.2. Industrial and Commercial
- 9.3.3. Utility
- 9.4. Market Analysis, Insights and Forecast - by Application
- 9.4.1. Power Generation
- 9.4.2. Transmission
- 9.4.3. Distribution
- 9.1. Market Analysis, Insights and Forecast - by Equipment Type
- 10. Middle East and Africa Power Equipment Market Analysis, Insights and Forecast, 2020-2032
- 10.1. Market Analysis, Insights and Forecast - by Equipment Type
- 10.1.1. Generator
- 10.1.2. Transformer
- 10.1.3. Switchgears
- 10.1.4. Circuit Breakers
- 10.1.5. Power Cable
- 10.1.6. Other Equipment Types
- 10.2. Market Analysis, Insights and Forecast - by Power Generation Source
- 10.2.1. Fossil Fuel Based
- 10.2.2. Solar
- 10.2.3. Wind
- 10.2.4. Nuclear
- 10.2.5. Hydro
- 10.3. Market Analysis, Insights and Forecast - by End-User
- 10.3.1. Residential
- 10.3.2. Industrial and Commercial
- 10.3.3. Utility
- 10.4. Market Analysis, Insights and Forecast - by Application
- 10.4.1. Power Generation
- 10.4.2. Transmission
- 10.4.3. Distribution
- 10.1. Market Analysis, Insights and Forecast - by Equipment Type
- 11. South America Power Equipment Market Analysis, Insights and Forecast, 2020-2032
- 11.1. Market Analysis, Insights and Forecast - by Equipment Type
- 11.1.1. Generator
- 11.1.2. Transformer
- 11.1.3. Switchgears
- 11.1.4. Circuit Breakers
- 11.1.5. Power Cable
- 11.1.6. Other Equipment Types
- 11.2. Market Analysis, Insights and Forecast - by Power Generation Source
- 11.2.1. Fossil Fuel Based
- 11.2.2. Solar
- 11.2.3. Wind
- 11.2.4. Nuclear
- 11.2.5. Hydro
- 11.3. Market Analysis, Insights and Forecast - by End-User
- 11.3.1. Residential
- 11.3.2. Industrial and Commercial
- 11.3.3. Utility
- 11.4. Market Analysis, Insights and Forecast - by Application
- 11.4.1. Power Generation
- 11.4.2. Transmission
- 11.4.3. Distribution
- 11.1. Market Analysis, Insights and Forecast - by Equipment Type
- 12. Competitive Analysis
- 12.1. Company Profiles
- 12.1.1 Honeywell International Inc
- 12.1.1.1. Company Overview
- 12.1.1.2. Products
- 12.1.1.3. Company Financials
- 12.1.1.4. SWOT Analysis
- 12.1.2 Crompton Greaves Ltd
- 12.1.2.1. Company Overview
- 12.1.2.2. Products
- 12.1.2.3. Company Financials
- 12.1.2.4. SWOT Analysis
- 12.1.3 Eaton Corporation plc
- 12.1.3.1. Company Overview
- 12.1.3.2. Products
- 12.1.3.3. Company Financials
- 12.1.3.4. SWOT Analysis
- 12.1.4 Larsen & Toubro Limited
- 12.1.4.1. Company Overview
- 12.1.4.2. Products
- 12.1.4.3. Company Financials
- 12.1.4.4. SWOT Analysis
- 12.1.5 Toshiba Corporation
- 12.1.5.1. Company Overview
- 12.1.5.2. Products
- 12.1.5.3. Company Financials
- 12.1.5.4. SWOT Analysis
- 12.1.6 Fuji Electric Co Ltd
- 12.1.6.1. Company Overview
- 12.1.6.2. Products
- 12.1.6.3. Company Financials
- 12.1.6.4. SWOT Analysis
- 12.1.7 Bharat Heavy Electricals Limited
- 12.1.7.1. Company Overview
- 12.1.7.2. Products
- 12.1.7.3. Company Financials
- 12.1.7.4. SWOT Analysis
- 12.1.8 Mitsubishi Electric Corporation
- 12.1.8.1. Company Overview
- 12.1.8.2. Products
- 12.1.8.3. Company Financials
- 12.1.8.4. SWOT Analysis
- 12.1.9 Siemens AG
- 12.1.9.1. Company Overview
- 12.1.9.2. Products
- 12.1.9.3. Company Financials
- 12.1.9.4. SWOT Analysis
- 12.1.10 Schneider Electric SE
- 12.1.10.1. Company Overview
- 12.1.10.2. Products
- 12.1.10.3. Company Financials
- 12.1.10.4. SWOT Analysis
- 12.1.11 ABB Ltd
- 12.1.11.1. Company Overview
- 12.1.11.2. Products
- 12.1.11.3. Company Financials
- 12.1.11.4. SWOT Analysis
- 12.1.12 Rockwell Automation Inc
- 12.1.12.1. Company Overview
- 12.1.12.2. Products
- 12.1.12.3. Company Financials
- 12.1.12.4. SWOT Analysis
- 12.1.13 General Electric Company
- 12.1.13.1. Company Overview
- 12.1.13.2. Products
- 12.1.13.3. Company Financials
- 12.1.13.4. SWOT Analysis
- 12.1.1 Honeywell International Inc
- 12.2. Market Entropy
- 12.2.1 Company's Key Areas Served
- 12.2.2 Recent Developments
- 12.3. Company Market Share Analysis 2025
- 12.3.1 Top 5 Companies Market Share Analysis
- 12.3.2 Top 3 Companies Market Share Analysis
- 12.4. List of Potential Customers
- 13. Research Methodology
List of Figures
- Figure 1: Global Power Equipment Market Revenue Breakdown (Million, %) by Region 2025 & 2033
- Figure 2: Global Power Equipment Market Volume Breakdown (K Unit, %) by Region 2025 & 2033
- Figure 3: North America Power Equipment Market Revenue (Million), by Equipment Type 2025 & 2033
- Figure 4: North America Power Equipment Market Volume (K Unit), by Equipment Type 2025 & 2033
- Figure 5: North America Power Equipment Market Revenue Share (%), by Equipment Type 2025 & 2033
- Figure 6: North America Power Equipment Market Volume Share (%), by Equipment Type 2025 & 2033
- Figure 7: North America Power Equipment Market Revenue (Million), by Power Generation Source 2025 & 2033
- Figure 8: North America Power Equipment Market Volume (K Unit), by Power Generation Source 2025 & 2033
- Figure 9: North America Power Equipment Market Revenue Share (%), by Power Generation Source 2025 & 2033
- Figure 10: North America Power Equipment Market Volume Share (%), by Power Generation Source 2025 & 2033
- Figure 11: North America Power Equipment Market Revenue (Million), by End-User 2025 & 2033
- Figure 12: North America Power Equipment Market Volume (K Unit), by End-User 2025 & 2033
- Figure 13: North America Power Equipment Market Revenue Share (%), by End-User 2025 & 2033
- Figure 14: North America Power Equipment Market Volume Share (%), by End-User 2025 & 2033
- Figure 15: North America Power Equipment Market Revenue (Million), by Application 2025 & 2033
- Figure 16: North America Power Equipment Market Volume (K Unit), by Application 2025 & 2033
- Figure 17: North America Power Equipment Market Revenue Share (%), by Application 2025 & 2033
- Figure 18: North America Power Equipment Market Volume Share (%), by Application 2025 & 2033
- Figure 19: North America Power Equipment Market Revenue (Million), by Country 2025 & 2033
- Figure 20: North America Power Equipment Market Volume (K Unit), by Country 2025 & 2033
- Figure 21: North America Power Equipment Market Revenue Share (%), by Country 2025 & 2033
- Figure 22: North America Power Equipment Market Volume Share (%), by Country 2025 & 2033
- Figure 23: Europe Power Equipment Market Revenue (Million), by Equipment Type 2025 & 2033
- Figure 24: Europe Power Equipment Market Volume (K Unit), by Equipment Type 2025 & 2033
- Figure 25: Europe Power Equipment Market Revenue Share (%), by Equipment Type 2025 & 2033
- Figure 26: Europe Power Equipment Market Volume Share (%), by Equipment Type 2025 & 2033
- Figure 27: Europe Power Equipment Market Revenue (Million), by Power Generation Source 2025 & 2033
- Figure 28: Europe Power Equipment Market Volume (K Unit), by Power Generation Source 2025 & 2033
- Figure 29: Europe Power Equipment Market Revenue Share (%), by Power Generation Source 2025 & 2033
- Figure 30: Europe Power Equipment Market Volume Share (%), by Power Generation Source 2025 & 2033
- Figure 31: Europe Power Equipment Market Revenue (Million), by End-User 2025 & 2033
- Figure 32: Europe Power Equipment Market Volume (K Unit), by End-User 2025 & 2033
- Figure 33: Europe Power Equipment Market Revenue Share (%), by End-User 2025 & 2033
- Figure 34: Europe Power Equipment Market Volume Share (%), by End-User 2025 & 2033
- Figure 35: Europe Power Equipment Market Revenue (Million), by Application 2025 & 2033
- Figure 36: Europe Power Equipment Market Volume (K Unit), by Application 2025 & 2033
- Figure 37: Europe Power Equipment Market Revenue Share (%), by Application 2025 & 2033
- Figure 38: Europe Power Equipment Market Volume Share (%), by Application 2025 & 2033
- Figure 39: Europe Power Equipment Market Revenue (Million), by Country 2025 & 2033
- Figure 40: Europe Power Equipment Market Volume (K Unit), by Country 2025 & 2033
- Figure 41: Europe Power Equipment Market Revenue Share (%), by Country 2025 & 2033
- Figure 42: Europe Power Equipment Market Volume Share (%), by Country 2025 & 2033
- Figure 43: Asia Pacific Power Equipment Market Revenue (Million), by Equipment Type 2025 & 2033
- Figure 44: Asia Pacific Power Equipment Market Volume (K Unit), by Equipment Type 2025 & 2033
- Figure 45: Asia Pacific Power Equipment Market Revenue Share (%), by Equipment Type 2025 & 2033
- Figure 46: Asia Pacific Power Equipment Market Volume Share (%), by Equipment Type 2025 & 2033
- Figure 47: Asia Pacific Power Equipment Market Revenue (Million), by Power Generation Source 2025 & 2033
- Figure 48: Asia Pacific Power Equipment Market Volume (K Unit), by Power Generation Source 2025 & 2033
- Figure 49: Asia Pacific Power Equipment Market Revenue Share (%), by Power Generation Source 2025 & 2033
- Figure 50: Asia Pacific Power Equipment Market Volume Share (%), by Power Generation Source 2025 & 2033
- Figure 51: Asia Pacific Power Equipment Market Revenue (Million), by End-User 2025 & 2033
- Figure 52: Asia Pacific Power Equipment Market Volume (K Unit), by End-User 2025 & 2033
- Figure 53: Asia Pacific Power Equipment Market Revenue Share (%), by End-User 2025 & 2033
- Figure 54: Asia Pacific Power Equipment Market Volume Share (%), by End-User 2025 & 2033
- Figure 55: Asia Pacific Power Equipment Market Revenue (Million), by Application 2025 & 2033
- Figure 56: Asia Pacific Power Equipment Market Volume (K Unit), by Application 2025 & 2033
- Figure 57: Asia Pacific Power Equipment Market Revenue Share (%), by Application 2025 & 2033
- Figure 58: Asia Pacific Power Equipment Market Volume Share (%), by Application 2025 & 2033
- Figure 59: Asia Pacific Power Equipment Market Revenue (Million), by Country 2025 & 2033
- Figure 60: Asia Pacific Power Equipment Market Volume (K Unit), by Country 2025 & 2033
- Figure 61: Asia Pacific Power Equipment Market Revenue Share (%), by Country 2025 & 2033
- Figure 62: Asia Pacific Power Equipment Market Volume Share (%), by Country 2025 & 2033
- Figure 63: Middle East and Africa Power Equipment Market Revenue (Million), by Equipment Type 2025 & 2033
- Figure 64: Middle East and Africa Power Equipment Market Volume (K Unit), by Equipment Type 2025 & 2033
- Figure 65: Middle East and Africa Power Equipment Market Revenue Share (%), by Equipment Type 2025 & 2033
- Figure 66: Middle East and Africa Power Equipment Market Volume Share (%), by Equipment Type 2025 & 2033
- Figure 67: Middle East and Africa Power Equipment Market Revenue (Million), by Power Generation Source 2025 & 2033
- Figure 68: Middle East and Africa Power Equipment Market Volume (K Unit), by Power Generation Source 2025 & 2033
- Figure 69: Middle East and Africa Power Equipment Market Revenue Share (%), by Power Generation Source 2025 & 2033
- Figure 70: Middle East and Africa Power Equipment Market Volume Share (%), by Power Generation Source 2025 & 2033
- Figure 71: Middle East and Africa Power Equipment Market Revenue (Million), by End-User 2025 & 2033
- Figure 72: Middle East and Africa Power Equipment Market Volume (K Unit), by End-User 2025 & 2033
- Figure 73: Middle East and Africa Power Equipment Market Revenue Share (%), by End-User 2025 & 2033
- Figure 74: Middle East and Africa Power Equipment Market Volume Share (%), by End-User 2025 & 2033
- Figure 75: Middle East and Africa Power Equipment Market Revenue (Million), by Application 2025 & 2033
- Figure 76: Middle East and Africa Power Equipment Market Volume (K Unit), by Application 2025 & 2033
- Figure 77: Middle East and Africa Power Equipment Market Revenue Share (%), by Application 2025 & 2033
- Figure 78: Middle East and Africa Power Equipment Market Volume Share (%), by Application 2025 & 2033
- Figure 79: Middle East and Africa Power Equipment Market Revenue (Million), by Country 2025 & 2033
- Figure 80: Middle East and Africa Power Equipment Market Volume (K Unit), by Country 2025 & 2033
- Figure 81: Middle East and Africa Power Equipment Market Revenue Share (%), by Country 2025 & 2033
- Figure 82: Middle East and Africa Power Equipment Market Volume Share (%), by Country 2025 & 2033
- Figure 83: South America Power Equipment Market Revenue (Million), by Equipment Type 2025 & 2033
- Figure 84: South America Power Equipment Market Volume (K Unit), by Equipment Type 2025 & 2033
- Figure 85: South America Power Equipment Market Revenue Share (%), by Equipment Type 2025 & 2033
- Figure 86: South America Power Equipment Market Volume Share (%), by Equipment Type 2025 & 2033
- Figure 87: South America Power Equipment Market Revenue (Million), by Power Generation Source 2025 & 2033
- Figure 88: South America Power Equipment Market Volume (K Unit), by Power Generation Source 2025 & 2033
- Figure 89: South America Power Equipment Market Revenue Share (%), by Power Generation Source 2025 & 2033
- Figure 90: South America Power Equipment Market Volume Share (%), by Power Generation Source 2025 & 2033
- Figure 91: South America Power Equipment Market Revenue (Million), by End-User 2025 & 2033
- Figure 92: South America Power Equipment Market Volume (K Unit), by End-User 2025 & 2033
- Figure 93: South America Power Equipment Market Revenue Share (%), by End-User 2025 & 2033
- Figure 94: South America Power Equipment Market Volume Share (%), by End-User 2025 & 2033
- Figure 95: South America Power Equipment Market Revenue (Million), by Application 2025 & 2033
- Figure 96: South America Power Equipment Market Volume (K Unit), by Application 2025 & 2033
- Figure 97: South America Power Equipment Market Revenue Share (%), by Application 2025 & 2033
- Figure 98: South America Power Equipment Market Volume Share (%), by Application 2025 & 2033
- Figure 99: South America Power Equipment Market Revenue (Million), by Country 2025 & 2033
- Figure 100: South America Power Equipment Market Volume (K Unit), by Country 2025 & 2033
- Figure 101: South America Power Equipment Market Revenue Share (%), by Country 2025 & 2033
- Figure 102: South America Power Equipment Market Volume Share (%), by Country 2025 & 2033
List of Tables
- Table 1: Global Power Equipment Market Revenue Million Forecast, by Equipment Type 2020 & 2033
- Table 2: Global Power Equipment Market Volume K Unit Forecast, by Equipment Type 2020 & 2033
- Table 3: Global Power Equipment Market Revenue Million Forecast, by Power Generation Source 2020 & 2033
- Table 4: Global Power Equipment Market Volume K Unit Forecast, by Power Generation Source 2020 & 2033
- Table 5: Global Power Equipment Market Revenue Million Forecast, by End-User 2020 & 2033
- Table 6: Global Power Equipment Market Volume K Unit Forecast, by End-User 2020 & 2033
- Table 7: Global Power Equipment Market Revenue Million Forecast, by Application 2020 & 2033
- Table 8: Global Power Equipment Market Volume K Unit Forecast, by Application 2020 & 2033
- Table 9: Global Power Equipment Market Revenue Million Forecast, by Region 2020 & 2033
- Table 10: Global Power Equipment Market Volume K Unit Forecast, by Region 2020 & 2033
- Table 11: Global Power Equipment Market Revenue Million Forecast, by Equipment Type 2020 & 2033
- Table 12: Global Power Equipment Market Volume K Unit Forecast, by Equipment Type 2020 & 2033
- Table 13: Global Power Equipment Market Revenue Million Forecast, by Power Generation Source 2020 & 2033
- Table 14: Global Power Equipment Market Volume K Unit Forecast, by Power Generation Source 2020 & 2033
- Table 15: Global Power Equipment Market Revenue Million Forecast, by End-User 2020 & 2033
- Table 16: Global Power Equipment Market Volume K Unit Forecast, by End-User 2020 & 2033
- Table 17: Global Power Equipment Market Revenue Million Forecast, by Application 2020 & 2033
- Table 18: Global Power Equipment Market Volume K Unit Forecast, by Application 2020 & 2033
- Table 19: Global Power Equipment Market Revenue Million Forecast, by Country 2020 & 2033
- Table 20: Global Power Equipment Market Volume K Unit Forecast, by Country 2020 & 2033
- Table 21: United States Power Equipment Market Revenue (Million) Forecast, by Application 2020 & 2033
- Table 22: United States Power Equipment Market Volume (K Unit) Forecast, by Application 2020 & 2033
- Table 23: Canada Power Equipment Market Revenue (Million) Forecast, by Application 2020 & 2033
- Table 24: Canada Power Equipment Market Volume (K Unit) Forecast, by Application 2020 & 2033
- Table 25: Rest of North America Power Equipment Market Revenue (Million) Forecast, by Application 2020 & 2033
- Table 26: Rest of North America Power Equipment Market Volume (K Unit) Forecast, by Application 2020 & 2033
- Table 27: Global Power Equipment Market Revenue Million Forecast, by Equipment Type 2020 & 2033
- Table 28: Global Power Equipment Market Volume K Unit Forecast, by Equipment Type 2020 & 2033
- Table 29: Global Power Equipment Market Revenue Million Forecast, by Power Generation Source 2020 & 2033
- Table 30: Global Power Equipment Market Volume K Unit Forecast, by Power Generation Source 2020 & 2033
- Table 31: Global Power Equipment Market Revenue Million Forecast, by End-User 2020 & 2033
- Table 32: Global Power Equipment Market Volume K Unit Forecast, by End-User 2020 & 2033
- Table 33: Global Power Equipment Market Revenue Million Forecast, by Application 2020 & 2033
- Table 34: Global Power Equipment Market Volume K Unit Forecast, by Application 2020 & 2033
- Table 35: Global Power Equipment Market Revenue Million Forecast, by Country 2020 & 2033
- Table 36: Global Power Equipment Market Volume K Unit Forecast, by Country 2020 & 2033
- Table 37: Germany Power Equipment Market Revenue (Million) Forecast, by Application 2020 & 2033
- Table 38: Germany Power Equipment Market Volume (K Unit) Forecast, by Application 2020 & 2033
- Table 39: France Power Equipment Market Revenue (Million) Forecast, by Application 2020 & 2033
- Table 40: France Power Equipment Market Volume (K Unit) Forecast, by Application 2020 & 2033
- Table 41: United Kingdom Power Equipment Market Revenue (Million) Forecast, by Application 2020 & 2033
- Table 42: United Kingdom Power Equipment Market Volume (K Unit) Forecast, by Application 2020 & 2033
- Table 43: Russia Power Equipment Market Revenue (Million) Forecast, by Application 2020 & 2033
- Table 44: Russia Power Equipment Market Volume (K Unit) Forecast, by Application 2020 & 2033
- Table 45: Rest of Europe Power Equipment Market Revenue (Million) Forecast, by Application 2020 & 2033
- Table 46: Rest of Europe Power Equipment Market Volume (K Unit) Forecast, by Application 2020 & 2033
- Table 47: Global Power Equipment Market Revenue Million Forecast, by Equipment Type 2020 & 2033
- Table 48: Global Power Equipment Market Volume K Unit Forecast, by Equipment Type 2020 & 2033
- Table 49: Global Power Equipment Market Revenue Million Forecast, by Power Generation Source 2020 & 2033
- Table 50: Global Power Equipment Market Volume K Unit Forecast, by Power Generation Source 2020 & 2033
- Table 51: Global Power Equipment Market Revenue Million Forecast, by End-User 2020 & 2033
- Table 52: Global Power Equipment Market Volume K Unit Forecast, by End-User 2020 & 2033
- Table 53: Global Power Equipment Market Revenue Million Forecast, by Application 2020 & 2033
- Table 54: Global Power Equipment Market Volume K Unit Forecast, by Application 2020 & 2033
- Table 55: Global Power Equipment Market Revenue Million Forecast, by Country 2020 & 2033
- Table 56: Global Power Equipment Market Volume K Unit Forecast, by Country 2020 & 2033
- Table 57: China Power Equipment Market Revenue (Million) Forecast, by Application 2020 & 2033
- Table 58: China Power Equipment Market Volume (K Unit) Forecast, by Application 2020 & 2033
- Table 59: India Power Equipment Market Revenue (Million) Forecast, by Application 2020 & 2033
- Table 60: India Power Equipment Market Volume (K Unit) Forecast, by Application 2020 & 2033
- Table 61: Australia Power Equipment Market Revenue (Million) Forecast, by Application 2020 & 2033
- Table 62: Australia Power Equipment Market Volume (K Unit) Forecast, by Application 2020 & 2033
- Table 63: Japan Power Equipment Market Revenue (Million) Forecast, by Application 2020 & 2033
- Table 64: Japan Power Equipment Market Volume (K Unit) Forecast, by Application 2020 & 2033
- Table 65: Rest of Asia Pacific Power Equipment Market Revenue (Million) Forecast, by Application 2020 & 2033
- Table 66: Rest of Asia Pacific Power Equipment Market Volume (K Unit) Forecast, by Application 2020 & 2033
- Table 67: Global Power Equipment Market Revenue Million Forecast, by Equipment Type 2020 & 2033
- Table 68: Global Power Equipment Market Volume K Unit Forecast, by Equipment Type 2020 & 2033
- Table 69: Global Power Equipment Market Revenue Million Forecast, by Power Generation Source 2020 & 2033
- Table 70: Global Power Equipment Market Volume K Unit Forecast, by Power Generation Source 2020 & 2033
- Table 71: Global Power Equipment Market Revenue Million Forecast, by End-User 2020 & 2033
- Table 72: Global Power Equipment Market Volume K Unit Forecast, by End-User 2020 & 2033
- Table 73: Global Power Equipment Market Revenue Million Forecast, by Application 2020 & 2033
- Table 74: Global Power Equipment Market Volume K Unit Forecast, by Application 2020 & 2033
- Table 75: Global Power Equipment Market Revenue Million Forecast, by Country 2020 & 2033
- Table 76: Global Power Equipment Market Volume K Unit Forecast, by Country 2020 & 2033
- Table 77: Saudi Arabia Power Equipment Market Revenue (Million) Forecast, by Application 2020 & 2033
- Table 78: Saudi Arabia Power Equipment Market Volume (K Unit) Forecast, by Application 2020 & 2033
- Table 79: United Arab Emirates Power Equipment Market Revenue (Million) Forecast, by Application 2020 & 2033
- Table 80: United Arab Emirates Power Equipment Market Volume (K Unit) Forecast, by Application 2020 & 2033
- Table 81: Nigeria Power Equipment Market Revenue (Million) Forecast, by Application 2020 & 2033
- Table 82: Nigeria Power Equipment Market Volume (K Unit) Forecast, by Application 2020 & 2033
- Table 83: South Africa Power Equipment Market Revenue (Million) Forecast, by Application 2020 & 2033
- Table 84: South Africa Power Equipment Market Volume (K Unit) Forecast, by Application 2020 & 2033
- Table 85: Rest of Middle East and Africa Power Equipment Market Revenue (Million) Forecast, by Application 2020 & 2033
- Table 86: Rest of Middle East and Africa Power Equipment Market Volume (K Unit) Forecast, by Application 2020 & 2033
- Table 87: Global Power Equipment Market Revenue Million Forecast, by Equipment Type 2020 & 2033
- Table 88: Global Power Equipment Market Volume K Unit Forecast, by Equipment Type 2020 & 2033
- Table 89: Global Power Equipment Market Revenue Million Forecast, by Power Generation Source 2020 & 2033
- Table 90: Global Power Equipment Market Volume K Unit Forecast, by Power Generation Source 2020 & 2033
- Table 91: Global Power Equipment Market Revenue Million Forecast, by End-User 2020 & 2033
- Table 92: Global Power Equipment Market Volume K Unit Forecast, by End-User 2020 & 2033
- Table 93: Global Power Equipment Market Revenue Million Forecast, by Application 2020 & 2033
- Table 94: Global Power Equipment Market Volume K Unit Forecast, by Application 2020 & 2033
- Table 95: Global Power Equipment Market Revenue Million Forecast, by Country 2020 & 2033
- Table 96: Global Power Equipment Market Volume K Unit Forecast, by Country 2020 & 2033
- Table 97: Brazil Power Equipment Market Revenue (Million) Forecast, by Application 2020 & 2033
- Table 98: Brazil Power Equipment Market Volume (K Unit) Forecast, by Application 2020 & 2033
- Table 99: Argentina Power Equipment Market Revenue (Million) Forecast, by Application 2020 & 2033
- Table 100: Argentina Power Equipment Market Volume (K Unit) Forecast, by Application 2020 & 2033
- Table 101: Chile Power Equipment Market Revenue (Million) Forecast, by Application 2020 & 2033
- Table 102: Chile Power Equipment Market Volume (K Unit) Forecast, by Application 2020 & 2033
- Table 103: Rest of South America Power Equipment Market Revenue (Million) Forecast, by Application 2020 & 2033
- Table 104: Rest of South America Power Equipment Market Volume (K Unit) Forecast, by Application 2020 & 2033
Frequently Asked Questions
1. What is the projected Compound Annual Growth Rate (CAGR) of the Power Equipment Market?
The projected CAGR is approximately 4.87%.
2. Which companies are prominent players in the Power Equipment Market?
Key companies in the market include Honeywell International Inc, Crompton Greaves Ltd, Eaton Corporation plc, Larsen & Toubro Limited, Toshiba Corporation, Fuji Electric Co Ltd, Bharat Heavy Electricals Limited, Mitsubishi Electric Corporation, Siemens AG, Schneider Electric SE, ABB Ltd, Rockwell Automation Inc, General Electric Company.
3. What are the main segments of the Power Equipment Market?
The market segments include Equipment Type, Power Generation Source, End-User, Application.
4. Can you provide details about the market size?
The market size is estimated to be USD 31.62 Million as of 2022.
5. What are some drivers contributing to market growth?
4.; Increasing Population Growth and Infrastructure Development.
6. What are the notable trends driving market growth?
Power Generation Expected to Dominate the Market.
7. Are there any restraints impacting market growth?
4.; High Operational and Maintenance Costs.
8. Can you provide examples of recent developments in the market?
May 2023: CAT launched its new power equipment product, the new CAT 60 Volt range. These power tools have advanced CAT 60V lithium-ion batteries with intelligent management systems. This system oversees various aspects, including charging and discharging, voltage control, temperature reporting, and monitoring the current state of health.
9. What pricing options are available for accessing the report?
Pricing options include single-user, multi-user, and enterprise licenses priced at USD 4750, USD 5250, and USD 8750 respectively.
10. Is the market size provided in terms of value or volume?
The market size is provided in terms of value, measured in Million and volume, measured in K Unit.
11. Are there any specific market keywords associated with the report?
Yes, the market keyword associated with the report is "Power Equipment Market," which aids in identifying and referencing the specific market segment covered.
12. How do I determine which pricing option suits my needs best?
The pricing options vary based on user requirements and access needs. Individual users may opt for single-user licenses, while businesses requiring broader access may choose multi-user or enterprise licenses for cost-effective access to the report.
13. Are there any additional resources or data provided in the Power Equipment Market report?
While the report offers comprehensive insights, it's advisable to review the specific contents or supplementary materials provided to ascertain if additional resources or data are available.
14. How can I stay updated on further developments or reports in the Power Equipment Market?
To stay informed about further developments, trends, and reports in the Power Equipment Market, consider subscribing to industry newsletters, following relevant companies and organizations, or regularly checking reputable industry news sources and publications.
Methodology
Step 1 - Identification of Relevant Samples Size from Population Database


Step 2 - Approaches for Defining Global Market Size (Value, Volume* & Price*)

Note*: In applicable scenarios
Step 3 - Data Sources
Primary Research
- Web Analytics
- Survey Reports
- Research Institute
- Latest Research Reports
- Opinion Leaders
Secondary Research
- Annual Reports
- White Paper
- Latest Press Release
- Industry Association
- Paid Database
- Investor Presentations

Step 4 - Data Triangulation
Involves using different sources of information in order to increase the validity of a study
These sources are likely to be stakeholders in a program - participants, other researchers, program staff, other community members, and so on.
Then we put all data in single framework & apply various statistical tools to find out the dynamic on the market.
During the analysis stage, feedback from the stakeholder groups would be compared to determine areas of agreement as well as areas of divergence