

Key Insights
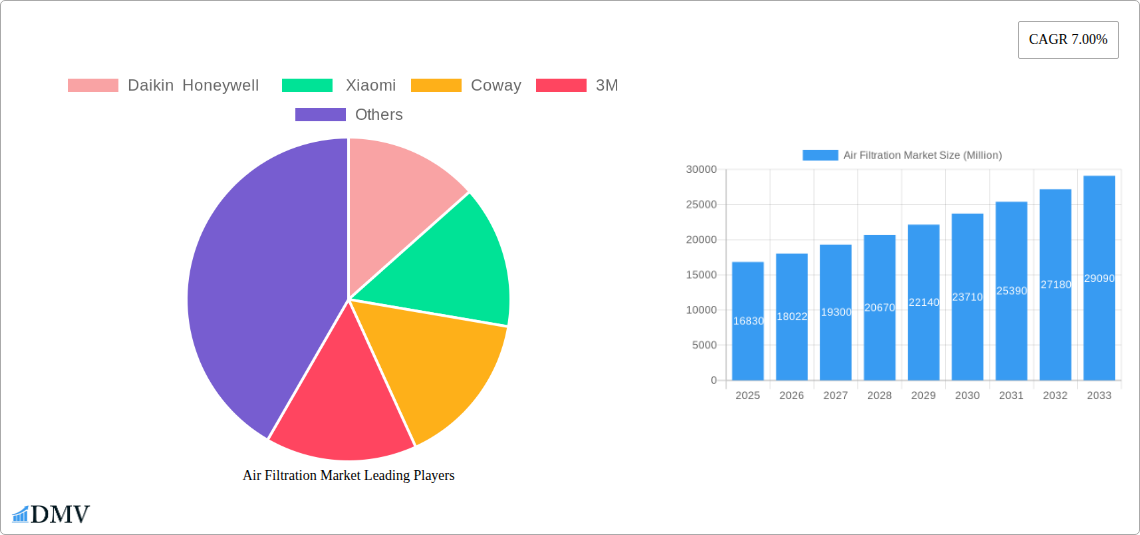
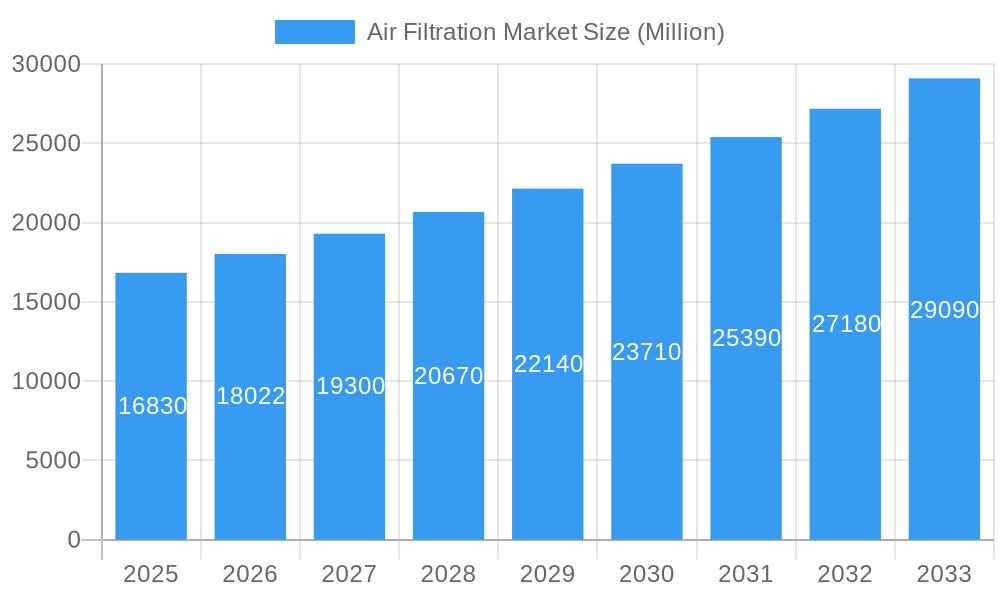
The global air filtration market, valued at $16.83 billion in 2025, is projected to experience robust growth, driven by a compound annual growth rate (CAGR) of 7.00% from 2025 to 2033. This expansion is fueled by several key factors. Rising awareness of indoor air quality (IAQ) and its impact on human health is a primary driver, particularly in urban areas with high pollution levels. Increasing prevalence of respiratory illnesses and allergies further boosts demand for effective air filtration systems across residential, commercial, and industrial settings. Technological advancements, such as the development of more efficient HEPA filters and smart air purifiers with integrated sensors and connectivity features, are also contributing significantly to market growth. The growing adoption of green building practices and stricter regulations on indoor air quality in various regions further stimulate market expansion. The market is segmented by filtration technology (HEPA, electrostatic precipitators, ionizers, ozone generators, etc.), type (stand-alone, in-duct), and end-user (residential, commercial, industrial). HEPA filtration dominates the technology segment due to its superior particle removal capabilities. The stand-alone segment holds a significant share in the type segment, owing to its ease of installation and portability. The commercial segment is expected to witness substantial growth due to increasing awareness of IAQ in workplaces and public spaces. Key players like Daikin, Honeywell, Xiaomi, Coway, and 3M are actively involved in product innovation and market expansion strategies.
Air Filtration Market Market Size (In Billion)
Geographic distribution reveals significant regional variations. North America and Europe currently hold larger market shares, attributed to higher disposable incomes, stringent environmental regulations, and greater awareness of air quality issues. However, the Asia-Pacific region is poised for rapid growth, driven by urbanization, rising middle-class incomes, and increasing demand for improved air quality in densely populated areas. The market's future growth will be influenced by factors such as technological innovations, regulatory changes, economic conditions, and public health concerns. The continued focus on improving IAQ and addressing air pollution issues will remain a crucial catalyst for market expansion throughout the forecast period. Competition among major players is expected to intensify, driving innovation and price competitiveness.
Air Filtration Market Company Market Share
Air Filtration Market Report: 2019-2033
This comprehensive report provides an in-depth analysis of the Air Filtration Market, covering the period from 2019 to 2033. With a focus on market size, growth drivers, and key players, this report is an essential resource for stakeholders seeking to understand and capitalize on opportunities within this dynamic sector. The report utilizes data from the historical period (2019-2024), the base year (2025), and the estimated year (2025) to project market trends through 2033. The market is valued at xx Million in 2025 and is projected to reach xx Million by 2033.
Air Filtration Market Composition & Trends
This section delves into the competitive landscape of the air filtration market, evaluating market concentration, innovation drivers, regulatory frameworks, substitute products, end-user profiles, and mergers & acquisitions (M&A) activities. The market exhibits a moderately concentrated structure, with key players such as Daikin, Honeywell, Xiaomi, Coway, and 3M holding significant market share. However, the emergence of smaller, innovative companies is also noteworthy.
- Market Share Distribution: Daikin holds an estimated xx% market share in 2025, followed by Honeywell at xx%, 3M at xx%, Xiaomi at xx%, and Coway at xx%. The remaining market share is distributed among numerous smaller players.
- Innovation Catalysts: Stringent environmental regulations, growing health concerns, and technological advancements in filtration technologies are driving innovation. The development of highly efficient filtration systems, such as HEPA filters and electrostatic precipitators, is a key factor.
- Regulatory Landscape: Government regulations concerning air quality and indoor air pollution significantly impact market growth. Stringent standards and incentives for adopting air filtration technologies are prevalent in several regions.
- Substitute Products: While air filtration systems are the primary solution for air purification, natural ventilation and other air cleaning methods serve as partial substitutes.
- End-User Profiles: The market is segmented across residential, commercial, and industrial end-users, with the residential segment currently dominating. However, increasing awareness of indoor air quality in commercial and industrial settings is driving growth in these sectors.
- M&A Activities: The air filtration market has witnessed a moderate level of M&A activity in recent years, with deal values totaling approximately xx Million in 2024. These activities are primarily driven by strategic expansion and technological acquisitions.
Air Filtration Market Industry Evolution
This section examines the evolution of the air filtration market, analyzing growth trajectories, technological advancements, and evolving consumer preferences from 2019 to 2033. The market has witnessed robust growth, driven by increasing awareness of indoor air quality and the prevalence of respiratory illnesses. Technological advancements, such as the development of smart air purifiers with integrated sensors and connectivity features, have significantly enhanced product capabilities and consumer acceptance. The market experienced a Compound Annual Growth Rate (CAGR) of xx% during the historical period (2019-2024) and is projected to maintain a CAGR of xx% during the forecast period (2025-2033). This growth is fueled by rising disposable incomes, particularly in developing economies, leading to increased demand for advanced air purification solutions. Furthermore, the shift toward sustainable and energy-efficient technologies is influencing product design and adoption rates. The adoption rate of HEPA filter technology, for instance, has grown by xx% since 2019.
Leading Regions, Countries, or Segments in Air Filtration Market
North America and Asia Pacific currently dominate the air filtration market.
- Key Drivers:
- North America: Stringent environmental regulations, high disposable incomes, and increased awareness of indoor air quality are key drivers in North America.
- Asia Pacific: Rapid urbanization, rising disposable incomes, and a growing middle class are fueling demand in Asia Pacific.
- Filtration Technology: HEPA filtration systems hold a significant market share, driven by their high efficiency in removing particulate matter. However, other filtration technologies, such as electrostatic precipitators and ionizers, are gaining traction due to their cost-effectiveness and specific applications.
- Type: Stand-alone air purifiers represent the largest segment, offering flexibility and convenience. In-duct systems are increasingly adopted in new constructions and renovations for integrated air purification solutions.
- End User: The residential sector dominates the market, followed by the commercial and industrial sectors. The industrial sector is experiencing growth due to the increasing need for clean air in manufacturing facilities and other industrial settings.
Air Filtration Market Product Innovations
Recent innovations include smart air purifiers with features such as real-time air quality monitoring, app-based control, and automated filter replacement alerts. These advancements enhance user experience and optimize air purification effectiveness. Furthermore, advancements in filtration technology have led to the development of smaller, more efficient, and quieter air purifiers, addressing consumer preferences for space-saving and quieter operation. The focus is shifting toward energy-efficient designs and sustainable materials, aligned with growing environmental consciousness.
Propelling Factors for Air Filtration Market Growth
Several factors propel market growth, including:
- Technological Advancements: Innovations in filtration technology, smart features, and energy efficiency are driving market expansion.
- Economic Growth: Rising disposable incomes in developing economies are increasing demand for air purification systems.
- Regulatory Support: Government regulations and incentives for improved air quality are stimulating market growth. For example, stringent air quality standards in many countries are prompting increased adoption of air filtration systems.
Obstacles in the Air Filtration Market Market
Challenges to market growth include:
- Regulatory Challenges: Varying regulatory landscapes across different regions can create complexities for manufacturers and distributors.
- Supply Chain Disruptions: Global supply chain disruptions can impact the availability and pricing of raw materials and components.
- Competitive Pressure: The market is becoming increasingly competitive, with the emergence of new players and intense competition among established brands. This pressure can lead to price wars and reduced profit margins.
Future Opportunities in Air Filtration Market
Future opportunities lie in:
- Emerging Markets: Expanding into untapped markets in developing economies presents significant growth potential.
- Technological Advancements: Continued innovation in filtration technologies and smart features will unlock new market segments.
- Consumer Trends: Growing awareness of air quality and health concerns will drive demand for high-performance air purification systems.
Key Developments in Air Filtration Market Industry
- March 2023: Xiaomi Corp. launched the MIJIA full-effect air purifier in China, boasting 12,500 liters/minute air volume and approximately 99% virus removal capacity. This launch is expected to significantly boost sales in the Chinese market.
- March 2023: Blueair introduced the Blue Pure Max air purifier, highlighting minimal noise, robust design, and enhanced performance to purify 1,524 square feet in about 30 minutes. This underscores the trend toward quieter and more efficient air purifiers.
Strategic Air Filtration Market Market Forecast
The air filtration market is poised for continued expansion driven by technological advancements, growing environmental concerns, and rising disposable incomes globally. The market's future growth will be significantly influenced by the adoption of smart air purifiers and the development of more efficient and sustainable filtration technologies. The expanding awareness of indoor air quality and its impact on health will continue to fuel demand across all market segments, particularly in rapidly urbanizing regions. The forecast period shows significant potential for market growth, presenting lucrative opportunities for both established and emerging players.
Air Filtration Market Segmentation
-
1. Filtration Technology
- 1.1. High-efficiency Particulate Air (HEPA)
- 1.2. Other Fi
-
2. Type
- 2.1. Stand-alone
- 2.2. In-duct
-
3. End User
- 3.1. Residential
- 3.2. Commercial
- 3.3. Industrial
Air Filtration Market Segmentation By Geography
-
1. North America
- 1.1. United States
- 1.2. Canada
- 1.3. Rest of North America
-
2. Europe
- 2.1. United Kingdom
- 2.2. Germany
- 2.3. Spain
- 2.4. NORDIC
- 2.5. Russia
- 2.6. Turkey
- 2.7. Italy
- 2.8. Rest of Europe
-
3. Asia Pacific
- 3.1. China
- 3.2. India
- 3.3. Japan
- 3.4. Malaysia
- 3.5. Thailand
- 3.6. Indonesia
- 3.7. Vietnam
- 3.8. Rest of Asia Pacific
-
4. South America
- 4.1. Brazil
- 4.2. Argentina
- 4.3. Colombia
- 4.4. Rest of South America
-
5. Middle East and Africa
- 5.1. United Arab Emirates
- 5.2. Saudi Arabia
- 5.3. South Africa
- 5.4. Nigeria
- 5.5. Qatar
- 5.6. Egypt
- 5.7. Rest of Middle East and Africa
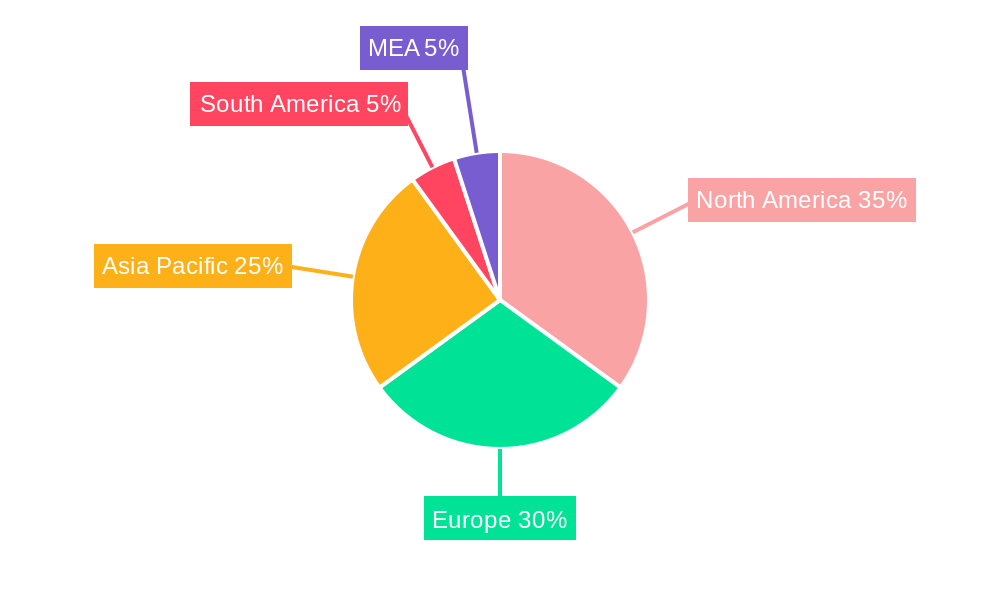
Air Filtration Market Regional Market Share
Geographic Coverage of Air Filtration Market
Air Filtration Market REPORT HIGHLIGHTS
| Aspects | Details |
|---|---|
| Study Period | 2020-2034 |
| Base Year | 2025 |
| Estimated Year | 2026 |
| Forecast Period | 2026-2034 |
| Historical Period | 2020-2025 |
| Growth Rate | CAGR of 7.00% from 2020-2034 |
| Segmentation |
|
Table of Contents
- 1. Introduction
- 1.1. Research Scope
- 1.2. Market Segmentation
- 1.3. Research Objective
- 1.4. Definitions and Assumptions
- 2. Executive Summary
- 2.1. Market Snapshot
- 3. Market Dynamics
- 3.1. Market Drivers
- 3.2. Market Restrains
- 3.3. Market Trends
- 3.4. Market Opportunities
- 4. Market Factor Analysis
- 4.1. Porters Five Forces
- 4.1.1. Bargaining Power of Suppliers
- 4.1.2. Bargaining Power of Buyers
- 4.1.3. Threat of New Entrants
- 4.1.4. Threat of Substitutes
- 4.1.5. Competitive Rivalry
- 4.2. PESTEL analysis
- 4.3. BCG Analysis
- 4.3.1. Stars (High Growth, High Market Share)
- 4.3.2. Cash Cows (Low Growth, High Market Share)
- 4.3.3. Question Mark (High Growth, Low Market Share)
- 4.3.4. Dogs (Low Growth, Low Market Share)
- 4.4. Ansoff Matrix Analysis
- 4.5. Supply Chain Analysis
- 4.6. Regulatory Landscape
- 4.7. Current Market Potential and Opportunity Assessment (TAM–SAM–SOM Framework)
- 4.8. DMV Analyst Note
- 4.1. Porters Five Forces
- 5. Market Analysis, Insights and Forecast 2021-2033
- 5.1. Market Analysis, Insights and Forecast - by Filtration Technology
- 5.1.1. High-efficiency Particulate Air (HEPA)
- 5.1.2. Other Fi
- 5.2. Market Analysis, Insights and Forecast - by Type
- 5.2.1. Stand-alone
- 5.2.2. In-duct
- 5.3. Market Analysis, Insights and Forecast - by End User
- 5.3.1. Residential
- 5.3.2. Commercial
- 5.3.3. Industrial
- 5.4. Market Analysis, Insights and Forecast - by Region
- 5.4.1. North America
- 5.4.2. Europe
- 5.4.3. Asia Pacific
- 5.4.4. South America
- 5.4.5. Middle East and Africa
- 5.1. Market Analysis, Insights and Forecast - by Filtration Technology
- 6. Global Air Filtration Market Analysis, Insights and Forecast, 2021-2033
- 6.1. Market Analysis, Insights and Forecast - by Filtration Technology
- 6.1.1. High-efficiency Particulate Air (HEPA)
- 6.1.2. Other Fi
- 6.2. Market Analysis, Insights and Forecast - by Type
- 6.2.1. Stand-alone
- 6.2.2. In-duct
- 6.3. Market Analysis, Insights and Forecast - by End User
- 6.3.1. Residential
- 6.3.2. Commercial
- 6.3.3. Industrial
- 6.1. Market Analysis, Insights and Forecast - by Filtration Technology
- 7. North America Air Filtration Market Analysis, Insights and Forecast, 2020-2032
- 7.1. Market Analysis, Insights and Forecast - by Filtration Technology
- 7.1.1. High-efficiency Particulate Air (HEPA)
- 7.1.2. Other Fi
- 7.2. Market Analysis, Insights and Forecast - by Type
- 7.2.1. Stand-alone
- 7.2.2. In-duct
- 7.3. Market Analysis, Insights and Forecast - by End User
- 7.3.1. Residential
- 7.3.2. Commercial
- 7.3.3. Industrial
- 7.1. Market Analysis, Insights and Forecast - by Filtration Technology
- 8. Europe Air Filtration Market Analysis, Insights and Forecast, 2020-2032
- 8.1. Market Analysis, Insights and Forecast - by Filtration Technology
- 8.1.1. High-efficiency Particulate Air (HEPA)
- 8.1.2. Other Fi
- 8.2. Market Analysis, Insights and Forecast - by Type
- 8.2.1. Stand-alone
- 8.2.2. In-duct
- 8.3. Market Analysis, Insights and Forecast - by End User
- 8.3.1. Residential
- 8.3.2. Commercial
- 8.3.3. Industrial
- 8.1. Market Analysis, Insights and Forecast - by Filtration Technology
- 9. Asia Pacific Air Filtration Market Analysis, Insights and Forecast, 2020-2032
- 9.1. Market Analysis, Insights and Forecast - by Filtration Technology
- 9.1.1. High-efficiency Particulate Air (HEPA)
- 9.1.2. Other Fi
- 9.2. Market Analysis, Insights and Forecast - by Type
- 9.2.1. Stand-alone
- 9.2.2. In-duct
- 9.3. Market Analysis, Insights and Forecast - by End User
- 9.3.1. Residential
- 9.3.2. Commercial
- 9.3.3. Industrial
- 9.1. Market Analysis, Insights and Forecast - by Filtration Technology
- 10. South America Air Filtration Market Analysis, Insights and Forecast, 2020-2032
- 10.1. Market Analysis, Insights and Forecast - by Filtration Technology
- 10.1.1. High-efficiency Particulate Air (HEPA)
- 10.1.2. Other Fi
- 10.2. Market Analysis, Insights and Forecast - by Type
- 10.2.1. Stand-alone
- 10.2.2. In-duct
- 10.3. Market Analysis, Insights and Forecast - by End User
- 10.3.1. Residential
- 10.3.2. Commercial
- 10.3.3. Industrial
- 10.1. Market Analysis, Insights and Forecast - by Filtration Technology
- 11. Middle East and Africa Air Filtration Market Analysis, Insights and Forecast, 2020-2032
- 11.1. Market Analysis, Insights and Forecast - by Filtration Technology
- 11.1.1. High-efficiency Particulate Air (HEPA)
- 11.1.2. Other Fi
- 11.2. Market Analysis, Insights and Forecast - by Type
- 11.2.1. Stand-alone
- 11.2.2. In-duct
- 11.3. Market Analysis, Insights and Forecast - by End User
- 11.3.1. Residential
- 11.3.2. Commercial
- 11.3.3. Industrial
- 11.1. Market Analysis, Insights and Forecast - by Filtration Technology
- 12. Competitive Analysis
- 12.1. Company Profiles
- 12.1.1 Daikin Honeywell
- 12.1.1.1. Company Overview
- 12.1.1.2. Products
- 12.1.1.3. Company Financials
- 12.1.1.4. SWOT Analysis
- 12.1.2 Xiaomi
- 12.1.2.1. Company Overview
- 12.1.2.2. Products
- 12.1.2.3. Company Financials
- 12.1.2.4. SWOT Analysis
- 12.1.3 Coway
- 12.1.3.1. Company Overview
- 12.1.3.2. Products
- 12.1.3.3. Company Financials
- 12.1.3.4. SWOT Analysis
- 12.1.4 3M
- 12.1.4.1. Company Overview
- 12.1.4.2. Products
- 12.1.4.3. Company Financials
- 12.1.4.4. SWOT Analysis
- 12.1.1 Daikin Honeywell
- 12.2. Market Entropy
- 12.2.1 Company's Key Areas Served
- 12.2.2 Recent Developments
- 12.3. Company Market Share Analysis 2025
- 12.3.1 Top 5 Companies Market Share Analysis
- 12.3.2 Top 3 Companies Market Share Analysis
- 12.4. List of Potential Customers
- 13. Research Methodology
List of Figures
- Figure 1: Global Air Filtration Market Revenue Breakdown (Million, %) by Region 2025 & 2033
- Figure 2: Global Air Filtration Market Volume Breakdown (K Unit, %) by Region 2025 & 2033
- Figure 3: North America Air Filtration Market Revenue (Million), by Filtration Technology 2025 & 2033
- Figure 4: North America Air Filtration Market Volume (K Unit), by Filtration Technology 2025 & 2033
- Figure 5: North America Air Filtration Market Revenue Share (%), by Filtration Technology 2025 & 2033
- Figure 6: North America Air Filtration Market Volume Share (%), by Filtration Technology 2025 & 2033
- Figure 7: North America Air Filtration Market Revenue (Million), by Type 2025 & 2033
- Figure 8: North America Air Filtration Market Volume (K Unit), by Type 2025 & 2033
- Figure 9: North America Air Filtration Market Revenue Share (%), by Type 2025 & 2033
- Figure 10: North America Air Filtration Market Volume Share (%), by Type 2025 & 2033
- Figure 11: North America Air Filtration Market Revenue (Million), by End User 2025 & 2033
- Figure 12: North America Air Filtration Market Volume (K Unit), by End User 2025 & 2033
- Figure 13: North America Air Filtration Market Revenue Share (%), by End User 2025 & 2033
- Figure 14: North America Air Filtration Market Volume Share (%), by End User 2025 & 2033
- Figure 15: North America Air Filtration Market Revenue (Million), by Country 2025 & 2033
- Figure 16: North America Air Filtration Market Volume (K Unit), by Country 2025 & 2033
- Figure 17: North America Air Filtration Market Revenue Share (%), by Country 2025 & 2033
- Figure 18: North America Air Filtration Market Volume Share (%), by Country 2025 & 2033
- Figure 19: Europe Air Filtration Market Revenue (Million), by Filtration Technology 2025 & 2033
- Figure 20: Europe Air Filtration Market Volume (K Unit), by Filtration Technology 2025 & 2033
- Figure 21: Europe Air Filtration Market Revenue Share (%), by Filtration Technology 2025 & 2033
- Figure 22: Europe Air Filtration Market Volume Share (%), by Filtration Technology 2025 & 2033
- Figure 23: Europe Air Filtration Market Revenue (Million), by Type 2025 & 2033
- Figure 24: Europe Air Filtration Market Volume (K Unit), by Type 2025 & 2033
- Figure 25: Europe Air Filtration Market Revenue Share (%), by Type 2025 & 2033
- Figure 26: Europe Air Filtration Market Volume Share (%), by Type 2025 & 2033
- Figure 27: Europe Air Filtration Market Revenue (Million), by End User 2025 & 2033
- Figure 28: Europe Air Filtration Market Volume (K Unit), by End User 2025 & 2033
- Figure 29: Europe Air Filtration Market Revenue Share (%), by End User 2025 & 2033
- Figure 30: Europe Air Filtration Market Volume Share (%), by End User 2025 & 2033
- Figure 31: Europe Air Filtration Market Revenue (Million), by Country 2025 & 2033
- Figure 32: Europe Air Filtration Market Volume (K Unit), by Country 2025 & 2033
- Figure 33: Europe Air Filtration Market Revenue Share (%), by Country 2025 & 2033
- Figure 34: Europe Air Filtration Market Volume Share (%), by Country 2025 & 2033
- Figure 35: Asia Pacific Air Filtration Market Revenue (Million), by Filtration Technology 2025 & 2033
- Figure 36: Asia Pacific Air Filtration Market Volume (K Unit), by Filtration Technology 2025 & 2033
- Figure 37: Asia Pacific Air Filtration Market Revenue Share (%), by Filtration Technology 2025 & 2033
- Figure 38: Asia Pacific Air Filtration Market Volume Share (%), by Filtration Technology 2025 & 2033
- Figure 39: Asia Pacific Air Filtration Market Revenue (Million), by Type 2025 & 2033
- Figure 40: Asia Pacific Air Filtration Market Volume (K Unit), by Type 2025 & 2033
- Figure 41: Asia Pacific Air Filtration Market Revenue Share (%), by Type 2025 & 2033
- Figure 42: Asia Pacific Air Filtration Market Volume Share (%), by Type 2025 & 2033
- Figure 43: Asia Pacific Air Filtration Market Revenue (Million), by End User 2025 & 2033
- Figure 44: Asia Pacific Air Filtration Market Volume (K Unit), by End User 2025 & 2033
- Figure 45: Asia Pacific Air Filtration Market Revenue Share (%), by End User 2025 & 2033
- Figure 46: Asia Pacific Air Filtration Market Volume Share (%), by End User 2025 & 2033
- Figure 47: Asia Pacific Air Filtration Market Revenue (Million), by Country 2025 & 2033
- Figure 48: Asia Pacific Air Filtration Market Volume (K Unit), by Country 2025 & 2033
- Figure 49: Asia Pacific Air Filtration Market Revenue Share (%), by Country 2025 & 2033
- Figure 50: Asia Pacific Air Filtration Market Volume Share (%), by Country 2025 & 2033
- Figure 51: South America Air Filtration Market Revenue (Million), by Filtration Technology 2025 & 2033
- Figure 52: South America Air Filtration Market Volume (K Unit), by Filtration Technology 2025 & 2033
- Figure 53: South America Air Filtration Market Revenue Share (%), by Filtration Technology 2025 & 2033
- Figure 54: South America Air Filtration Market Volume Share (%), by Filtration Technology 2025 & 2033
- Figure 55: South America Air Filtration Market Revenue (Million), by Type 2025 & 2033
- Figure 56: South America Air Filtration Market Volume (K Unit), by Type 2025 & 2033
- Figure 57: South America Air Filtration Market Revenue Share (%), by Type 2025 & 2033
- Figure 58: South America Air Filtration Market Volume Share (%), by Type 2025 & 2033
- Figure 59: South America Air Filtration Market Revenue (Million), by End User 2025 & 2033
- Figure 60: South America Air Filtration Market Volume (K Unit), by End User 2025 & 2033
- Figure 61: South America Air Filtration Market Revenue Share (%), by End User 2025 & 2033
- Figure 62: South America Air Filtration Market Volume Share (%), by End User 2025 & 2033
- Figure 63: South America Air Filtration Market Revenue (Million), by Country 2025 & 2033
- Figure 64: South America Air Filtration Market Volume (K Unit), by Country 2025 & 2033
- Figure 65: South America Air Filtration Market Revenue Share (%), by Country 2025 & 2033
- Figure 66: South America Air Filtration Market Volume Share (%), by Country 2025 & 2033
- Figure 67: Middle East and Africa Air Filtration Market Revenue (Million), by Filtration Technology 2025 & 2033
- Figure 68: Middle East and Africa Air Filtration Market Volume (K Unit), by Filtration Technology 2025 & 2033
- Figure 69: Middle East and Africa Air Filtration Market Revenue Share (%), by Filtration Technology 2025 & 2033
- Figure 70: Middle East and Africa Air Filtration Market Volume Share (%), by Filtration Technology 2025 & 2033
- Figure 71: Middle East and Africa Air Filtration Market Revenue (Million), by Type 2025 & 2033
- Figure 72: Middle East and Africa Air Filtration Market Volume (K Unit), by Type 2025 & 2033
- Figure 73: Middle East and Africa Air Filtration Market Revenue Share (%), by Type 2025 & 2033
- Figure 74: Middle East and Africa Air Filtration Market Volume Share (%), by Type 2025 & 2033
- Figure 75: Middle East and Africa Air Filtration Market Revenue (Million), by End User 2025 & 2033
- Figure 76: Middle East and Africa Air Filtration Market Volume (K Unit), by End User 2025 & 2033
- Figure 77: Middle East and Africa Air Filtration Market Revenue Share (%), by End User 2025 & 2033
- Figure 78: Middle East and Africa Air Filtration Market Volume Share (%), by End User 2025 & 2033
- Figure 79: Middle East and Africa Air Filtration Market Revenue (Million), by Country 2025 & 2033
- Figure 80: Middle East and Africa Air Filtration Market Volume (K Unit), by Country 2025 & 2033
- Figure 81: Middle East and Africa Air Filtration Market Revenue Share (%), by Country 2025 & 2033
- Figure 82: Middle East and Africa Air Filtration Market Volume Share (%), by Country 2025 & 2033
List of Tables
- Table 1: Global Air Filtration Market Revenue Million Forecast, by Filtration Technology 2020 & 2033
- Table 2: Global Air Filtration Market Volume K Unit Forecast, by Filtration Technology 2020 & 2033
- Table 3: Global Air Filtration Market Revenue Million Forecast, by Type 2020 & 2033
- Table 4: Global Air Filtration Market Volume K Unit Forecast, by Type 2020 & 2033
- Table 5: Global Air Filtration Market Revenue Million Forecast, by End User 2020 & 2033
- Table 6: Global Air Filtration Market Volume K Unit Forecast, by End User 2020 & 2033
- Table 7: Global Air Filtration Market Revenue Million Forecast, by Region 2020 & 2033
- Table 8: Global Air Filtration Market Volume K Unit Forecast, by Region 2020 & 2033
- Table 9: Global Air Filtration Market Revenue Million Forecast, by Filtration Technology 2020 & 2033
- Table 10: Global Air Filtration Market Volume K Unit Forecast, by Filtration Technology 2020 & 2033
- Table 11: Global Air Filtration Market Revenue Million Forecast, by Type 2020 & 2033
- Table 12: Global Air Filtration Market Volume K Unit Forecast, by Type 2020 & 2033
- Table 13: Global Air Filtration Market Revenue Million Forecast, by End User 2020 & 2033
- Table 14: Global Air Filtration Market Volume K Unit Forecast, by End User 2020 & 2033
- Table 15: Global Air Filtration Market Revenue Million Forecast, by Country 2020 & 2033
- Table 16: Global Air Filtration Market Volume K Unit Forecast, by Country 2020 & 2033
- Table 17: United States Air Filtration Market Revenue (Million) Forecast, by Application 2020 & 2033
- Table 18: United States Air Filtration Market Volume (K Unit) Forecast, by Application 2020 & 2033
- Table 19: Canada Air Filtration Market Revenue (Million) Forecast, by Application 2020 & 2033
- Table 20: Canada Air Filtration Market Volume (K Unit) Forecast, by Application 2020 & 2033
- Table 21: Rest of North America Air Filtration Market Revenue (Million) Forecast, by Application 2020 & 2033
- Table 22: Rest of North America Air Filtration Market Volume (K Unit) Forecast, by Application 2020 & 2033
- Table 23: Global Air Filtration Market Revenue Million Forecast, by Filtration Technology 2020 & 2033
- Table 24: Global Air Filtration Market Volume K Unit Forecast, by Filtration Technology 2020 & 2033
- Table 25: Global Air Filtration Market Revenue Million Forecast, by Type 2020 & 2033
- Table 26: Global Air Filtration Market Volume K Unit Forecast, by Type 2020 & 2033
- Table 27: Global Air Filtration Market Revenue Million Forecast, by End User 2020 & 2033
- Table 28: Global Air Filtration Market Volume K Unit Forecast, by End User 2020 & 2033
- Table 29: Global Air Filtration Market Revenue Million Forecast, by Country 2020 & 2033
- Table 30: Global Air Filtration Market Volume K Unit Forecast, by Country 2020 & 2033
- Table 31: United Kingdom Air Filtration Market Revenue (Million) Forecast, by Application 2020 & 2033
- Table 32: United Kingdom Air Filtration Market Volume (K Unit) Forecast, by Application 2020 & 2033
- Table 33: Germany Air Filtration Market Revenue (Million) Forecast, by Application 2020 & 2033
- Table 34: Germany Air Filtration Market Volume (K Unit) Forecast, by Application 2020 & 2033
- Table 35: Spain Air Filtration Market Revenue (Million) Forecast, by Application 2020 & 2033
- Table 36: Spain Air Filtration Market Volume (K Unit) Forecast, by Application 2020 & 2033
- Table 37: NORDIC Air Filtration Market Revenue (Million) Forecast, by Application 2020 & 2033
- Table 38: NORDIC Air Filtration Market Volume (K Unit) Forecast, by Application 2020 & 2033
- Table 39: Russia Air Filtration Market Revenue (Million) Forecast, by Application 2020 & 2033
- Table 40: Russia Air Filtration Market Volume (K Unit) Forecast, by Application 2020 & 2033
- Table 41: Turkey Air Filtration Market Revenue (Million) Forecast, by Application 2020 & 2033
- Table 42: Turkey Air Filtration Market Volume (K Unit) Forecast, by Application 2020 & 2033
- Table 43: Italy Air Filtration Market Revenue (Million) Forecast, by Application 2020 & 2033
- Table 44: Italy Air Filtration Market Volume (K Unit) Forecast, by Application 2020 & 2033
- Table 45: Rest of Europe Air Filtration Market Revenue (Million) Forecast, by Application 2020 & 2033
- Table 46: Rest of Europe Air Filtration Market Volume (K Unit) Forecast, by Application 2020 & 2033
- Table 47: Global Air Filtration Market Revenue Million Forecast, by Filtration Technology 2020 & 2033
- Table 48: Global Air Filtration Market Volume K Unit Forecast, by Filtration Technology 2020 & 2033
- Table 49: Global Air Filtration Market Revenue Million Forecast, by Type 2020 & 2033
- Table 50: Global Air Filtration Market Volume K Unit Forecast, by Type 2020 & 2033
- Table 51: Global Air Filtration Market Revenue Million Forecast, by End User 2020 & 2033
- Table 52: Global Air Filtration Market Volume K Unit Forecast, by End User 2020 & 2033
- Table 53: Global Air Filtration Market Revenue Million Forecast, by Country 2020 & 2033
- Table 54: Global Air Filtration Market Volume K Unit Forecast, by Country 2020 & 2033
- Table 55: China Air Filtration Market Revenue (Million) Forecast, by Application 2020 & 2033
- Table 56: China Air Filtration Market Volume (K Unit) Forecast, by Application 2020 & 2033
- Table 57: India Air Filtration Market Revenue (Million) Forecast, by Application 2020 & 2033
- Table 58: India Air Filtration Market Volume (K Unit) Forecast, by Application 2020 & 2033
- Table 59: Japan Air Filtration Market Revenue (Million) Forecast, by Application 2020 & 2033
- Table 60: Japan Air Filtration Market Volume (K Unit) Forecast, by Application 2020 & 2033
- Table 61: Malaysia Air Filtration Market Revenue (Million) Forecast, by Application 2020 & 2033
- Table 62: Malaysia Air Filtration Market Volume (K Unit) Forecast, by Application 2020 & 2033
- Table 63: Thailand Air Filtration Market Revenue (Million) Forecast, by Application 2020 & 2033
- Table 64: Thailand Air Filtration Market Volume (K Unit) Forecast, by Application 2020 & 2033
- Table 65: Indonesia Air Filtration Market Revenue (Million) Forecast, by Application 2020 & 2033
- Table 66: Indonesia Air Filtration Market Volume (K Unit) Forecast, by Application 2020 & 2033
- Table 67: Vietnam Air Filtration Market Revenue (Million) Forecast, by Application 2020 & 2033
- Table 68: Vietnam Air Filtration Market Volume (K Unit) Forecast, by Application 2020 & 2033
- Table 69: Rest of Asia Pacific Air Filtration Market Revenue (Million) Forecast, by Application 2020 & 2033
- Table 70: Rest of Asia Pacific Air Filtration Market Volume (K Unit) Forecast, by Application 2020 & 2033
- Table 71: Global Air Filtration Market Revenue Million Forecast, by Filtration Technology 2020 & 2033
- Table 72: Global Air Filtration Market Volume K Unit Forecast, by Filtration Technology 2020 & 2033
- Table 73: Global Air Filtration Market Revenue Million Forecast, by Type 2020 & 2033
- Table 74: Global Air Filtration Market Volume K Unit Forecast, by Type 2020 & 2033
- Table 75: Global Air Filtration Market Revenue Million Forecast, by End User 2020 & 2033
- Table 76: Global Air Filtration Market Volume K Unit Forecast, by End User 2020 & 2033
- Table 77: Global Air Filtration Market Revenue Million Forecast, by Country 2020 & 2033
- Table 78: Global Air Filtration Market Volume K Unit Forecast, by Country 2020 & 2033
- Table 79: Brazil Air Filtration Market Revenue (Million) Forecast, by Application 2020 & 2033
- Table 80: Brazil Air Filtration Market Volume (K Unit) Forecast, by Application 2020 & 2033
- Table 81: Argentina Air Filtration Market Revenue (Million) Forecast, by Application 2020 & 2033
- Table 82: Argentina Air Filtration Market Volume (K Unit) Forecast, by Application 2020 & 2033
- Table 83: Colombia Air Filtration Market Revenue (Million) Forecast, by Application 2020 & 2033
- Table 84: Colombia Air Filtration Market Volume (K Unit) Forecast, by Application 2020 & 2033
- Table 85: Rest of South America Air Filtration Market Revenue (Million) Forecast, by Application 2020 & 2033
- Table 86: Rest of South America Air Filtration Market Volume (K Unit) Forecast, by Application 2020 & 2033
- Table 87: Global Air Filtration Market Revenue Million Forecast, by Filtration Technology 2020 & 2033
- Table 88: Global Air Filtration Market Volume K Unit Forecast, by Filtration Technology 2020 & 2033
- Table 89: Global Air Filtration Market Revenue Million Forecast, by Type 2020 & 2033
- Table 90: Global Air Filtration Market Volume K Unit Forecast, by Type 2020 & 2033
- Table 91: Global Air Filtration Market Revenue Million Forecast, by End User 2020 & 2033
- Table 92: Global Air Filtration Market Volume K Unit Forecast, by End User 2020 & 2033
- Table 93: Global Air Filtration Market Revenue Million Forecast, by Country 2020 & 2033
- Table 94: Global Air Filtration Market Volume K Unit Forecast, by Country 2020 & 2033
- Table 95: United Arab Emirates Air Filtration Market Revenue (Million) Forecast, by Application 2020 & 2033
- Table 96: United Arab Emirates Air Filtration Market Volume (K Unit) Forecast, by Application 2020 & 2033
- Table 97: Saudi Arabia Air Filtration Market Revenue (Million) Forecast, by Application 2020 & 2033
- Table 98: Saudi Arabia Air Filtration Market Volume (K Unit) Forecast, by Application 2020 & 2033
- Table 99: South Africa Air Filtration Market Revenue (Million) Forecast, by Application 2020 & 2033
- Table 100: South Africa Air Filtration Market Volume (K Unit) Forecast, by Application 2020 & 2033
- Table 101: Nigeria Air Filtration Market Revenue (Million) Forecast, by Application 2020 & 2033
- Table 102: Nigeria Air Filtration Market Volume (K Unit) Forecast, by Application 2020 & 2033
- Table 103: Qatar Air Filtration Market Revenue (Million) Forecast, by Application 2020 & 2033
- Table 104: Qatar Air Filtration Market Volume (K Unit) Forecast, by Application 2020 & 2033
- Table 105: Egypt Air Filtration Market Revenue (Million) Forecast, by Application 2020 & 2033
- Table 106: Egypt Air Filtration Market Volume (K Unit) Forecast, by Application 2020 & 2033
- Table 107: Rest of Middle East and Africa Air Filtration Market Revenue (Million) Forecast, by Application 2020 & 2033
- Table 108: Rest of Middle East and Africa Air Filtration Market Volume (K Unit) Forecast, by Application 2020 & 2033
Frequently Asked Questions
1. What is the projected Compound Annual Growth Rate (CAGR) of the Air Filtration Market?
The projected CAGR is approximately 7.00%.
2. Which companies are prominent players in the Air Filtration Market?
Key companies in the market include Daikin Honeywell , Xiaomi, Coway, 3M .
3. What are the main segments of the Air Filtration Market?
The market segments include Filtration Technology, Type, End User.
4. Can you provide details about the market size?
The market size is estimated to be USD 16.83 Million as of 2022.
5. What are some drivers contributing to market growth?
4.; Upcoming New Renewable Projects in the Country4.; Expansions of Transmission and Distribution Network.
6. What are the notable trends driving market growth?
The High-efficiency Particulate Air (HEPA) Segment is Expected to Dominate the Market.
7. Are there any restraints impacting market growth?
4.; Lack of Private Participation in the Country's Power Sector.
8. Can you provide examples of recent developments in the market?
March 2023: Xiaomi Corp. announced the launch of the MIJIA full-effect air purifier for the Chinese market. The equipment can produce 12,500 liters of air volume per minute, with an estimated virus removal capacity of approximately 99%. Such an enhanced product feature is expected to increase the sale of air purifiers during the forecast period.
9. What pricing options are available for accessing the report?
Pricing options include single-user, multi-user, and enterprise licenses priced at USD 4750, USD 5250, and USD 8750 respectively.
10. Is the market size provided in terms of value or volume?
The market size is provided in terms of value, measured in Million and volume, measured in K Unit.
11. Are there any specific market keywords associated with the report?
Yes, the market keyword associated with the report is "Air Filtration Market," which aids in identifying and referencing the specific market segment covered.
12. How do I determine which pricing option suits my needs best?
The pricing options vary based on user requirements and access needs. Individual users may opt for single-user licenses, while businesses requiring broader access may choose multi-user or enterprise licenses for cost-effective access to the report.
13. Are there any additional resources or data provided in the Air Filtration Market report?
While the report offers comprehensive insights, it's advisable to review the specific contents or supplementary materials provided to ascertain if additional resources or data are available.
14. How can I stay updated on further developments or reports in the Air Filtration Market?
To stay informed about further developments, trends, and reports in the Air Filtration Market, consider subscribing to industry newsletters, following relevant companies and organizations, or regularly checking reputable industry news sources and publications.
Methodology
Step 1 - Identification of Relevant Samples Size from Population Database


Step 2 - Approaches for Defining Global Market Size (Value, Volume* & Price*)

Note*: In applicable scenarios
Step 3 - Data Sources
Primary Research
- Web Analytics
- Survey Reports
- Research Institute
- Latest Research Reports
- Opinion Leaders
Secondary Research
- Annual Reports
- White Paper
- Latest Press Release
- Industry Association
- Paid Database
- Investor Presentations

Step 4 - Data Triangulation
Involves using different sources of information in order to increase the validity of a study
These sources are likely to be stakeholders in a program - participants, other researchers, program staff, other community members, and so on.
Then we put all data in single framework & apply various statistical tools to find out the dynamic on the market.
During the analysis stage, feedback from the stakeholder groups would be compared to determine areas of agreement as well as areas of divergence