

Key Insights
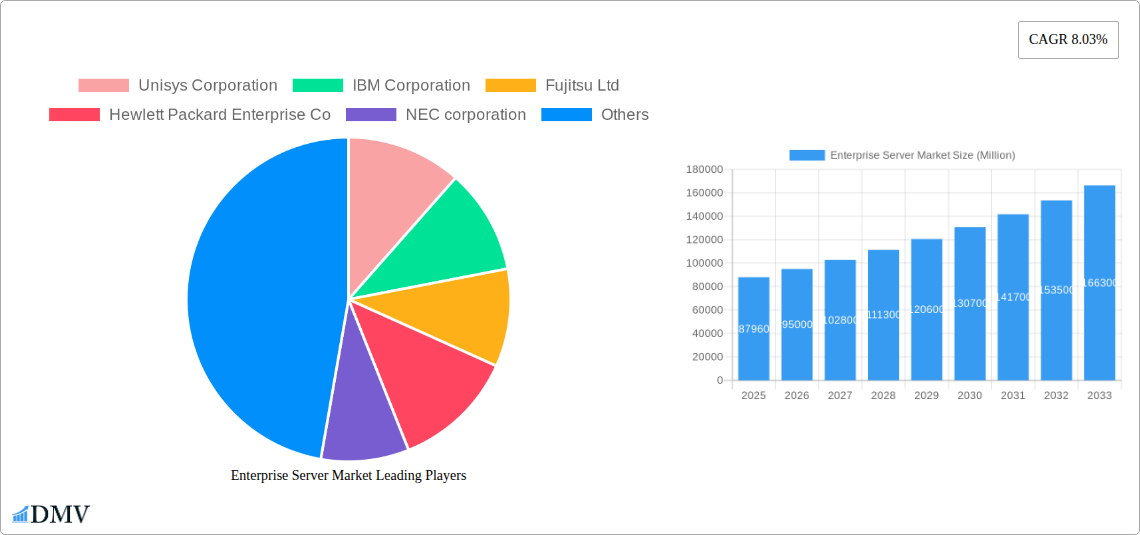
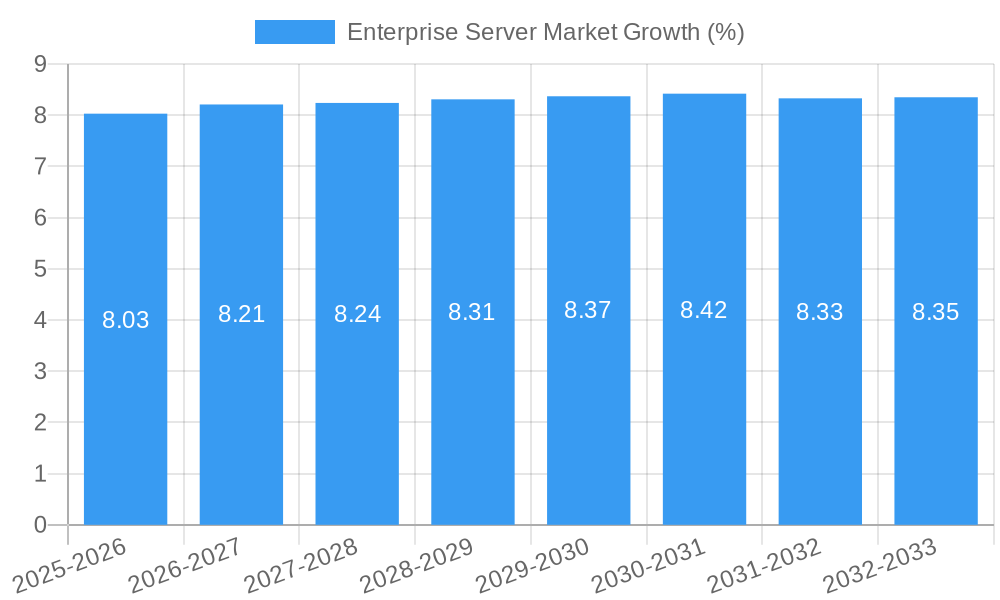
The Enterprise Server Market, valued at $87.96 billion in 2025, is projected to experience robust growth, exhibiting a Compound Annual Growth Rate (CAGR) of 8.03% from 2025 to 2033. This expansion is fueled by several key factors. The increasing adoption of cloud computing and virtualization technologies necessitates powerful and scalable enterprise servers to manage and process vast amounts of data. Furthermore, the rising demand for high-performance computing (HPC) across industries like healthcare (genomics research, drug discovery), financial services (risk modeling, algorithmic trading), and manufacturing (simulation, optimization) is significantly boosting market growth. The continuous innovation in server technologies, including advancements in processing power, memory capacity, and energy efficiency, further contributes to market expansion. Specific growth drivers include the growing need for data analytics, artificial intelligence (AI), and machine learning (ML) applications which require robust server infrastructure. Segmentation analysis reveals strong growth potential across all server types (blade, multi-node, tower, rack-optimized), with the high-end server segment likely leading the way due to its capacity to handle complex computations. Similarly, diverse end-user verticals, including IT & Telecommunications, BFSI, and Healthcare, show strong growth prospects, driving the overall market forward. However, factors like fluctuating economic conditions and the potential for increased competition could pose some challenges to market growth.
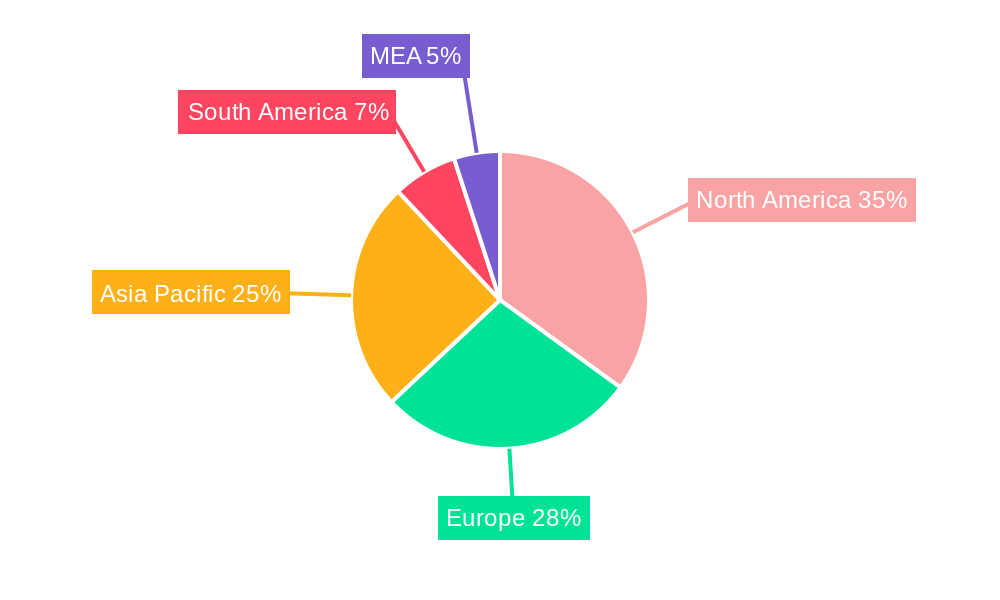
Geographic analysis indicates a strong presence of the market across North America, Europe, and Asia Pacific, with North America likely holding the largest market share due to the high adoption of advanced technologies and substantial IT spending. The Asia Pacific region is expected to exhibit significant growth, driven by increasing digitalization across developing economies like India and China. Key players in the market, including IBM, Hewlett Packard Enterprise, Dell Technologies, and Lenovo, are strategically investing in R&D and partnerships to enhance their product offerings and cater to the evolving needs of the market. The competitive landscape is marked by ongoing innovation, mergers, and acquisitions, reflecting the dynamism and lucrative nature of this sector. The forecast period of 2025-2033 promises continued growth and transformation in the enterprise server market, offering significant opportunities for technology providers and businesses alike.
Enterprise Server Market: A Comprehensive Report (2019-2033)
This insightful report provides a deep dive into the Enterprise Server Market, offering a comprehensive analysis of its current state and future trajectory. With a study period spanning 2019-2033, a base year of 2025, and a forecast period of 2025-2033, this report is an indispensable resource for stakeholders seeking to understand and capitalize on market opportunities. The market is valued at xx Million in 2025 and is projected to reach xx Million by 2033, exhibiting a robust CAGR of xx%.
Enterprise Server Market Composition & Trends
This section meticulously examines the competitive landscape of the Enterprise Server Market, analyzing market concentration, innovation drivers, regulatory frameworks, substitute products, and end-user profiles. We delve into mergers and acquisitions (M&A) activity, providing insights into deal values and their impact on market dynamics. Key players like Unisys Corporation, IBM Corporation, Fujitsu Ltd, Hewlett Packard Enterprise Co, NEC Corporation, Hitachi Ltd, Cisco Systems Inc, Toshiba Corporation, Oracle Corporation, Dell Technologies Inc, and Lenovo Group Ltd. are assessed for their market share and strategic maneuvers.
- Market Concentration: The market exhibits a moderately concentrated structure, with the top 5 players holding an estimated xx% market share in 2025.
- Innovation Catalysts: Advancements in AI, cloud computing, and edge computing are driving significant innovation within the market.
- Regulatory Landscape: Government regulations concerning data privacy and security are shaping vendor strategies and product development.
- Substitute Products: The rise of cloud-based solutions presents a key substitute, impacting the demand for traditional on-premise servers.
- End-User Profiles: The report segments end-users across diverse verticals, including IT & Telecommunications, BFSI, Manufacturing, Retail, Healthcare, Media & Entertainment, and others, analyzing their specific server needs.
- M&A Activity: The report tracks significant M&A deals in the period 2019-2024, analyzing their impact on market consolidation and technological advancements. Total M&A deal value during this period is estimated at xx Million.
Enterprise Server Market Industry Evolution
This section charts the evolution of the Enterprise Server Market, tracing its growth trajectory from 2019 to 2033. We analyze technological advancements, such as the shift towards cloud-native architectures and the adoption of new processor technologies (e.g., Ampere processors), alongside changing consumer demands for increased processing power, scalability, and energy efficiency. Specific data points, including annual growth rates and adoption metrics for key technologies, are presented to illuminate market trends and forecast future growth. The transition from traditional server architectures to cloud-based and hybrid cloud solutions is explored in detail, along with its impact on market segmentation. The increasing adoption of AI and machine learning in enterprise environments is also analyzed, along with the corresponding increase in demand for high-performance servers. The analysis considers the effect of macroeconomic factors, such as economic downturns or periods of growth, on the market’s expansion.
Leading Regions, Countries, or Segments in Enterprise Server Market
This section identifies leading regions, countries, and market segments within the Enterprise Server Market. We analyze dominance factors for each segment (By Server Type: Blade, Multi-node, Tower, Rack Optimized; By End-user Vertical: IT and Telecommunication, BFSI, Manufacturing, Retail, Healthcare, Media and Entertainment, Other End-user Verticals; By Operating System: Linux, Windows, UNIX, Other Operating Systems (i5/OS, z/OS, etc.); By Server Class: High-end Server, Mid-range Server, Volume Server), highlighting key drivers such as investment trends and regulatory support.
- By Server Type: Rack-optimized servers are projected to maintain market dominance due to their scalability and cost-effectiveness.
- By End-user Vertical: The IT and Telecommunication sector is expected to remain the largest consumer of enterprise servers owing to its high demand for data processing and storage capacity.
- By Operating System: Linux continues to gain traction due to its open-source nature and cost benefits.
- By Server Class: The mid-range server segment is anticipated to exhibit robust growth fueled by increasing adoption across various industry verticals.
The detailed analysis explores specific factors contributing to the dominance of each segment, considering factors like technological advancements, cost-effectiveness, and suitability for specific applications.
Enterprise Server Market Product Innovations
The Enterprise Server Market is witnessing a surge of innovative products focused on enhanced performance, scalability, and energy efficiency. Recent innovations include the introduction of cloud-native compute solutions utilizing new processor technologies, offering significant improvements in processing power and scalability. These innovations cater to the growing demands of cloud-based services (IaaS, PaaS, SaaS), digital services, and data-intensive applications, offering unique selling propositions in terms of performance, cost-efficiency, and sustainability.
Propelling Factors for Enterprise Server Market Growth
Several key factors drive the growth of the Enterprise Server Market. The increasing adoption of cloud computing and the rising demand for data storage and processing are primary drivers. Technological advancements, such as the development of more powerful and energy-efficient processors, also contribute significantly. Furthermore, supportive government policies and regulatory frameworks promoting digital transformation across various sectors fuel market expansion.
Obstacles in the Enterprise Server Market
Despite promising growth prospects, the Enterprise Server Market faces certain challenges. Supply chain disruptions caused by geopolitical events and the global chip shortage can impact production and availability. Intense competition among established players and the emergence of new entrants create pricing pressures. Stringent regulatory compliance requirements, particularly regarding data privacy and security, impose added costs and complexity on vendors.
Future Opportunities in Enterprise Server Market
The future of the Enterprise Server Market presents several promising opportunities. Expansion into emerging markets and the increasing demand for edge computing solutions provide significant growth potential. The integration of AI and machine learning capabilities into enterprise servers opens new avenues for innovation and market expansion. Furthermore, the development of sustainable and energy-efficient server technologies is a key area of future growth.
Major Players in the Enterprise Server Market Ecosystem
- Unisys Corporation
- IBM Corporation
- Fujitsu Ltd
- Hewlett Packard Enterprise Co
- NEC corporation
- Hitachi Ltd
- Cisco Systems Inc
- Toshiba Corporation
- Oracle Corporation
- Dell Technologies Inc
- Lenovo Group Ltd
Key Developments in Enterprise Server Market Industry
- June 2022: Hewlett Packard Enterprise launched a new line of cloud-native compute solutions using Ampere processors, enhancing scale-out computing capabilities for cloud-based services.
- August 2022: Inspur Information integrated its AIStation platform with NVIDIA AI Enterprise, creating a streamlined platform for enterprise AI resource utilization.
Strategic Enterprise Server Market Forecast
The Enterprise Server Market is poised for substantial growth driven by continued technological advancements, increasing digital transformation across industries, and the expanding adoption of cloud computing and AI. Emerging markets and new applications will further fuel market expansion, presenting significant opportunities for established players and new entrants alike. The forecast points to a sustained period of growth, with the market expected to reach xx Million by 2033.
Enterprise Server Market Segmentation
-
1. Operating System
- 1.1. Linux
- 1.2. Windows
- 1.3. UNIX
- 1.4. Other Operating Systems (i5/OS, z/OS, etc.)
-
2. Server Class
- 2.1. High-end Server
- 2.2. Mid-range Server
- 2.3. Volume Server
-
3. Server Type
- 3.1. Blade
- 3.2. Multi-node
- 3.3. Tower
- 3.4. Rack Optimized
-
4. End-user Vertical
- 4.1. IT and Telecommunication
- 4.2. BFSI
- 4.3. Manufacturing
- 4.4. Retail
- 4.5. Healthcare
- 4.6. Media and Entertainment
- 4.7. Other End-user Verticals
Enterprise Server Market Segmentation By Geography
- 1. North America
- 2. Europe
- 3. Asia Pacific
- 4. Latin America
- 5. Middle East and Africa
Enterprise Server Market REPORT HIGHLIGHTS
| Aspects | Details |
|---|---|
| Study Period | 2019-2033 |
| Base Year | 2024 |
| Estimated Year | 2025 |
| Forecast Period | 2025-2033 |
| Historical Period | 2019-2024 |
| Growth Rate | CAGR of 8.03% from 2019-2033 |
| Segmentation |
|
Table of Contents
- 1. Introduction
- 1.1. Research Scope
- 1.2. Market Segmentation
- 1.3. Research Methodology
- 1.4. Definitions and Assumptions
- 2. Executive Summary
- 2.1. Introduction
- 3. Market Dynamics
- 3.1. Introduction
- 3.2. Market Drivers
- 3.2.1. Increasing Adoption of Migration to the Cloud; Growth of Big Data
- 3.3. Market Restrains
- 3.3.1. Adoption of Server Virtualization
- 3.4. Market Trends
- 3.4.1. Rack Optimized Server Type to Witness High Growth
- 4. Market Factor Analysis
- 4.1. Porters Five Forces
- 4.2. Supply/Value Chain
- 4.3. PESTEL analysis
- 4.4. Market Entropy
- 4.5. Patent/Trademark Analysis
- 5. Global Enterprise Server Market Analysis, Insights and Forecast, 2019-2031
- 5.1. Market Analysis, Insights and Forecast - by Operating System
- 5.1.1. Linux
- 5.1.2. Windows
- 5.1.3. UNIX
- 5.1.4. Other Operating Systems (i5/OS, z/OS, etc.)
- 5.2. Market Analysis, Insights and Forecast - by Server Class
- 5.2.1. High-end Server
- 5.2.2. Mid-range Server
- 5.2.3. Volume Server
- 5.3. Market Analysis, Insights and Forecast - by Server Type
- 5.3.1. Blade
- 5.3.2. Multi-node
- 5.3.3. Tower
- 5.3.4. Rack Optimized
- 5.4. Market Analysis, Insights and Forecast - by End-user Vertical
- 5.4.1. IT and Telecommunication
- 5.4.2. BFSI
- 5.4.3. Manufacturing
- 5.4.4. Retail
- 5.4.5. Healthcare
- 5.4.6. Media and Entertainment
- 5.4.7. Other End-user Verticals
- 5.5. Market Analysis, Insights and Forecast - by Region
- 5.5.1. North America
- 5.5.2. Europe
- 5.5.3. Asia Pacific
- 5.5.4. Latin America
- 5.5.5. Middle East and Africa
- 5.1. Market Analysis, Insights and Forecast - by Operating System
- 6. North America Enterprise Server Market Analysis, Insights and Forecast, 2019-2031
- 6.1. Market Analysis, Insights and Forecast - by Operating System
- 6.1.1. Linux
- 6.1.2. Windows
- 6.1.3. UNIX
- 6.1.4. Other Operating Systems (i5/OS, z/OS, etc.)
- 6.2. Market Analysis, Insights and Forecast - by Server Class
- 6.2.1. High-end Server
- 6.2.2. Mid-range Server
- 6.2.3. Volume Server
- 6.3. Market Analysis, Insights and Forecast - by Server Type
- 6.3.1. Blade
- 6.3.2. Multi-node
- 6.3.3. Tower
- 6.3.4. Rack Optimized
- 6.4. Market Analysis, Insights and Forecast - by End-user Vertical
- 6.4.1. IT and Telecommunication
- 6.4.2. BFSI
- 6.4.3. Manufacturing
- 6.4.4. Retail
- 6.4.5. Healthcare
- 6.4.6. Media and Entertainment
- 6.4.7. Other End-user Verticals
- 6.1. Market Analysis, Insights and Forecast - by Operating System
- 7. Europe Enterprise Server Market Analysis, Insights and Forecast, 2019-2031
- 7.1. Market Analysis, Insights and Forecast - by Operating System
- 7.1.1. Linux
- 7.1.2. Windows
- 7.1.3. UNIX
- 7.1.4. Other Operating Systems (i5/OS, z/OS, etc.)
- 7.2. Market Analysis, Insights and Forecast - by Server Class
- 7.2.1. High-end Server
- 7.2.2. Mid-range Server
- 7.2.3. Volume Server
- 7.3. Market Analysis, Insights and Forecast - by Server Type
- 7.3.1. Blade
- 7.3.2. Multi-node
- 7.3.3. Tower
- 7.3.4. Rack Optimized
- 7.4. Market Analysis, Insights and Forecast - by End-user Vertical
- 7.4.1. IT and Telecommunication
- 7.4.2. BFSI
- 7.4.3. Manufacturing
- 7.4.4. Retail
- 7.4.5. Healthcare
- 7.4.6. Media and Entertainment
- 7.4.7. Other End-user Verticals
- 7.1. Market Analysis, Insights and Forecast - by Operating System
- 8. Asia Pacific Enterprise Server Market Analysis, Insights and Forecast, 2019-2031
- 8.1. Market Analysis, Insights and Forecast - by Operating System
- 8.1.1. Linux
- 8.1.2. Windows
- 8.1.3. UNIX
- 8.1.4. Other Operating Systems (i5/OS, z/OS, etc.)
- 8.2. Market Analysis, Insights and Forecast - by Server Class
- 8.2.1. High-end Server
- 8.2.2. Mid-range Server
- 8.2.3. Volume Server
- 8.3. Market Analysis, Insights and Forecast - by Server Type
- 8.3.1. Blade
- 8.3.2. Multi-node
- 8.3.3. Tower
- 8.3.4. Rack Optimized
- 8.4. Market Analysis, Insights and Forecast - by End-user Vertical
- 8.4.1. IT and Telecommunication
- 8.4.2. BFSI
- 8.4.3. Manufacturing
- 8.4.4. Retail
- 8.4.5. Healthcare
- 8.4.6. Media and Entertainment
- 8.4.7. Other End-user Verticals
- 8.1. Market Analysis, Insights and Forecast - by Operating System
- 9. Latin America Enterprise Server Market Analysis, Insights and Forecast, 2019-2031
- 9.1. Market Analysis, Insights and Forecast - by Operating System
- 9.1.1. Linux
- 9.1.2. Windows
- 9.1.3. UNIX
- 9.1.4. Other Operating Systems (i5/OS, z/OS, etc.)
- 9.2. Market Analysis, Insights and Forecast - by Server Class
- 9.2.1. High-end Server
- 9.2.2. Mid-range Server
- 9.2.3. Volume Server
- 9.3. Market Analysis, Insights and Forecast - by Server Type
- 9.3.1. Blade
- 9.3.2. Multi-node
- 9.3.3. Tower
- 9.3.4. Rack Optimized
- 9.4. Market Analysis, Insights and Forecast - by End-user Vertical
- 9.4.1. IT and Telecommunication
- 9.4.2. BFSI
- 9.4.3. Manufacturing
- 9.4.4. Retail
- 9.4.5. Healthcare
- 9.4.6. Media and Entertainment
- 9.4.7. Other End-user Verticals
- 9.1. Market Analysis, Insights and Forecast - by Operating System
- 10. Middle East and Africa Enterprise Server Market Analysis, Insights and Forecast, 2019-2031
- 10.1. Market Analysis, Insights and Forecast - by Operating System
- 10.1.1. Linux
- 10.1.2. Windows
- 10.1.3. UNIX
- 10.1.4. Other Operating Systems (i5/OS, z/OS, etc.)
- 10.2. Market Analysis, Insights and Forecast - by Server Class
- 10.2.1. High-end Server
- 10.2.2. Mid-range Server
- 10.2.3. Volume Server
- 10.3. Market Analysis, Insights and Forecast - by Server Type
- 10.3.1. Blade
- 10.3.2. Multi-node
- 10.3.3. Tower
- 10.3.4. Rack Optimized
- 10.4. Market Analysis, Insights and Forecast - by End-user Vertical
- 10.4.1. IT and Telecommunication
- 10.4.2. BFSI
- 10.4.3. Manufacturing
- 10.4.4. Retail
- 10.4.5. Healthcare
- 10.4.6. Media and Entertainment
- 10.4.7. Other End-user Verticals
- 10.1. Market Analysis, Insights and Forecast - by Operating System
- 11. North America Enterprise Server Market Analysis, Insights and Forecast, 2019-2031
- 11.1. Market Analysis, Insights and Forecast - By Country/Sub-region
- 11.1.1 United States
- 11.1.2 Canada
- 11.1.3 Mexico
- 12. Europe Enterprise Server Market Analysis, Insights and Forecast, 2019-2031
- 12.1. Market Analysis, Insights and Forecast - By Country/Sub-region
- 12.1.1 Germany
- 12.1.2 United Kingdom
- 12.1.3 France
- 12.1.4 Spain
- 12.1.5 Italy
- 12.1.6 Spain
- 12.1.7 Belgium
- 12.1.8 Netherland
- 12.1.9 Nordics
- 12.1.10 Rest of Europe
- 13. Asia Pacific Enterprise Server Market Analysis, Insights and Forecast, 2019-2031
- 13.1. Market Analysis, Insights and Forecast - By Country/Sub-region
- 13.1.1 China
- 13.1.2 Japan
- 13.1.3 India
- 13.1.4 South Korea
- 13.1.5 Southeast Asia
- 13.1.6 Australia
- 13.1.7 Indonesia
- 13.1.8 Phillipes
- 13.1.9 Singapore
- 13.1.10 Thailandc
- 13.1.11 Rest of Asia Pacific
- 14. South America Enterprise Server Market Analysis, Insights and Forecast, 2019-2031
- 14.1. Market Analysis, Insights and Forecast - By Country/Sub-region
- 14.1.1 Brazil
- 14.1.2 Argentina
- 14.1.3 Peru
- 14.1.4 Chile
- 14.1.5 Colombia
- 14.1.6 Ecuador
- 14.1.7 Venezuela
- 14.1.8 Rest of South America
- 15. North America Enterprise Server Market Analysis, Insights and Forecast, 2019-2031
- 15.1. Market Analysis, Insights and Forecast - By Country/Sub-region
- 15.1.1 United States
- 15.1.2 Canada
- 15.1.3 Mexico
- 16. MEA Enterprise Server Market Analysis, Insights and Forecast, 2019-2031
- 16.1. Market Analysis, Insights and Forecast - By Country/Sub-region
- 16.1.1 United Arab Emirates
- 16.1.2 Saudi Arabia
- 16.1.3 South Africa
- 16.1.4 Rest of Middle East and Africa
- 17. Competitive Analysis
- 17.1. Global Market Share Analysis 2024
- 17.2. Company Profiles
- 17.2.1 Unisys Corporation
- 17.2.1.1. Overview
- 17.2.1.2. Products
- 17.2.1.3. SWOT Analysis
- 17.2.1.4. Recent Developments
- 17.2.1.5. Financials (Based on Availability)
- 17.2.2 IBM Corporation
- 17.2.2.1. Overview
- 17.2.2.2. Products
- 17.2.2.3. SWOT Analysis
- 17.2.2.4. Recent Developments
- 17.2.2.5. Financials (Based on Availability)
- 17.2.3 Fujitsu Ltd
- 17.2.3.1. Overview
- 17.2.3.2. Products
- 17.2.3.3. SWOT Analysis
- 17.2.3.4. Recent Developments
- 17.2.3.5. Financials (Based on Availability)
- 17.2.4 Hewlett Packard Enterprise Co
- 17.2.4.1. Overview
- 17.2.4.2. Products
- 17.2.4.3. SWOT Analysis
- 17.2.4.4. Recent Developments
- 17.2.4.5. Financials (Based on Availability)
- 17.2.5 NEC corporation
- 17.2.5.1. Overview
- 17.2.5.2. Products
- 17.2.5.3. SWOT Analysis
- 17.2.5.4. Recent Developments
- 17.2.5.5. Financials (Based on Availability)
- 17.2.6 Hitachi Ltd
- 17.2.6.1. Overview
- 17.2.6.2. Products
- 17.2.6.3. SWOT Analysis
- 17.2.6.4. Recent Developments
- 17.2.6.5. Financials (Based on Availability)
- 17.2.7 Cisco Systems Inc
- 17.2.7.1. Overview
- 17.2.7.2. Products
- 17.2.7.3. SWOT Analysis
- 17.2.7.4. Recent Developments
- 17.2.7.5. Financials (Based on Availability)
- 17.2.8 Toshiba Corporation*List Not Exhaustive
- 17.2.8.1. Overview
- 17.2.8.2. Products
- 17.2.8.3. SWOT Analysis
- 17.2.8.4. Recent Developments
- 17.2.8.5. Financials (Based on Availability)
- 17.2.9 Oracle Corporation
- 17.2.9.1. Overview
- 17.2.9.2. Products
- 17.2.9.3. SWOT Analysis
- 17.2.9.4. Recent Developments
- 17.2.9.5. Financials (Based on Availability)
- 17.2.10 Dell Technologies Inc
- 17.2.10.1. Overview
- 17.2.10.2. Products
- 17.2.10.3. SWOT Analysis
- 17.2.10.4. Recent Developments
- 17.2.10.5. Financials (Based on Availability)
- 17.2.11 Lenovo Group Ltd
- 17.2.11.1. Overview
- 17.2.11.2. Products
- 17.2.11.3. SWOT Analysis
- 17.2.11.4. Recent Developments
- 17.2.11.5. Financials (Based on Availability)
- 17.2.1 Unisys Corporation
List of Figures
- Figure 1: Global Enterprise Server Market Revenue Breakdown (Million, %) by Region 2024 & 2032
- Figure 2: North America Enterprise Server Market Revenue (Million), by Country 2024 & 2032
- Figure 3: North America Enterprise Server Market Revenue Share (%), by Country 2024 & 2032
- Figure 4: Europe Enterprise Server Market Revenue (Million), by Country 2024 & 2032
- Figure 5: Europe Enterprise Server Market Revenue Share (%), by Country 2024 & 2032
- Figure 6: Asia Pacific Enterprise Server Market Revenue (Million), by Country 2024 & 2032
- Figure 7: Asia Pacific Enterprise Server Market Revenue Share (%), by Country 2024 & 2032
- Figure 8: South America Enterprise Server Market Revenue (Million), by Country 2024 & 2032
- Figure 9: South America Enterprise Server Market Revenue Share (%), by Country 2024 & 2032
- Figure 10: North America Enterprise Server Market Revenue (Million), by Country 2024 & 2032
- Figure 11: North America Enterprise Server Market Revenue Share (%), by Country 2024 & 2032
- Figure 12: MEA Enterprise Server Market Revenue (Million), by Country 2024 & 2032
- Figure 13: MEA Enterprise Server Market Revenue Share (%), by Country 2024 & 2032
- Figure 14: North America Enterprise Server Market Revenue (Million), by Operating System 2024 & 2032
- Figure 15: North America Enterprise Server Market Revenue Share (%), by Operating System 2024 & 2032
- Figure 16: North America Enterprise Server Market Revenue (Million), by Server Class 2024 & 2032
- Figure 17: North America Enterprise Server Market Revenue Share (%), by Server Class 2024 & 2032
- Figure 18: North America Enterprise Server Market Revenue (Million), by Server Type 2024 & 2032
- Figure 19: North America Enterprise Server Market Revenue Share (%), by Server Type 2024 & 2032
- Figure 20: North America Enterprise Server Market Revenue (Million), by End-user Vertical 2024 & 2032
- Figure 21: North America Enterprise Server Market Revenue Share (%), by End-user Vertical 2024 & 2032
- Figure 22: North America Enterprise Server Market Revenue (Million), by Country 2024 & 2032
- Figure 23: North America Enterprise Server Market Revenue Share (%), by Country 2024 & 2032
- Figure 24: Europe Enterprise Server Market Revenue (Million), by Operating System 2024 & 2032
- Figure 25: Europe Enterprise Server Market Revenue Share (%), by Operating System 2024 & 2032
- Figure 26: Europe Enterprise Server Market Revenue (Million), by Server Class 2024 & 2032
- Figure 27: Europe Enterprise Server Market Revenue Share (%), by Server Class 2024 & 2032
- Figure 28: Europe Enterprise Server Market Revenue (Million), by Server Type 2024 & 2032
- Figure 29: Europe Enterprise Server Market Revenue Share (%), by Server Type 2024 & 2032
- Figure 30: Europe Enterprise Server Market Revenue (Million), by End-user Vertical 2024 & 2032
- Figure 31: Europe Enterprise Server Market Revenue Share (%), by End-user Vertical 2024 & 2032
- Figure 32: Europe Enterprise Server Market Revenue (Million), by Country 2024 & 2032
- Figure 33: Europe Enterprise Server Market Revenue Share (%), by Country 2024 & 2032
- Figure 34: Asia Pacific Enterprise Server Market Revenue (Million), by Operating System 2024 & 2032
- Figure 35: Asia Pacific Enterprise Server Market Revenue Share (%), by Operating System 2024 & 2032
- Figure 36: Asia Pacific Enterprise Server Market Revenue (Million), by Server Class 2024 & 2032
- Figure 37: Asia Pacific Enterprise Server Market Revenue Share (%), by Server Class 2024 & 2032
- Figure 38: Asia Pacific Enterprise Server Market Revenue (Million), by Server Type 2024 & 2032
- Figure 39: Asia Pacific Enterprise Server Market Revenue Share (%), by Server Type 2024 & 2032
- Figure 40: Asia Pacific Enterprise Server Market Revenue (Million), by End-user Vertical 2024 & 2032
- Figure 41: Asia Pacific Enterprise Server Market Revenue Share (%), by End-user Vertical 2024 & 2032
- Figure 42: Asia Pacific Enterprise Server Market Revenue (Million), by Country 2024 & 2032
- Figure 43: Asia Pacific Enterprise Server Market Revenue Share (%), by Country 2024 & 2032
- Figure 44: Latin America Enterprise Server Market Revenue (Million), by Operating System 2024 & 2032
- Figure 45: Latin America Enterprise Server Market Revenue Share (%), by Operating System 2024 & 2032
- Figure 46: Latin America Enterprise Server Market Revenue (Million), by Server Class 2024 & 2032
- Figure 47: Latin America Enterprise Server Market Revenue Share (%), by Server Class 2024 & 2032
- Figure 48: Latin America Enterprise Server Market Revenue (Million), by Server Type 2024 & 2032
- Figure 49: Latin America Enterprise Server Market Revenue Share (%), by Server Type 2024 & 2032
- Figure 50: Latin America Enterprise Server Market Revenue (Million), by End-user Vertical 2024 & 2032
- Figure 51: Latin America Enterprise Server Market Revenue Share (%), by End-user Vertical 2024 & 2032
- Figure 52: Latin America Enterprise Server Market Revenue (Million), by Country 2024 & 2032
- Figure 53: Latin America Enterprise Server Market Revenue Share (%), by Country 2024 & 2032
- Figure 54: Middle East and Africa Enterprise Server Market Revenue (Million), by Operating System 2024 & 2032
- Figure 55: Middle East and Africa Enterprise Server Market Revenue Share (%), by Operating System 2024 & 2032
- Figure 56: Middle East and Africa Enterprise Server Market Revenue (Million), by Server Class 2024 & 2032
- Figure 57: Middle East and Africa Enterprise Server Market Revenue Share (%), by Server Class 2024 & 2032
- Figure 58: Middle East and Africa Enterprise Server Market Revenue (Million), by Server Type 2024 & 2032
- Figure 59: Middle East and Africa Enterprise Server Market Revenue Share (%), by Server Type 2024 & 2032
- Figure 60: Middle East and Africa Enterprise Server Market Revenue (Million), by End-user Vertical 2024 & 2032
- Figure 61: Middle East and Africa Enterprise Server Market Revenue Share (%), by End-user Vertical 2024 & 2032
- Figure 62: Middle East and Africa Enterprise Server Market Revenue (Million), by Country 2024 & 2032
- Figure 63: Middle East and Africa Enterprise Server Market Revenue Share (%), by Country 2024 & 2032
List of Tables
- Table 1: Global Enterprise Server Market Revenue Million Forecast, by Region 2019 & 2032
- Table 2: Global Enterprise Server Market Revenue Million Forecast, by Operating System 2019 & 2032
- Table 3: Global Enterprise Server Market Revenue Million Forecast, by Server Class 2019 & 2032
- Table 4: Global Enterprise Server Market Revenue Million Forecast, by Server Type 2019 & 2032
- Table 5: Global Enterprise Server Market Revenue Million Forecast, by End-user Vertical 2019 & 2032
- Table 6: Global Enterprise Server Market Revenue Million Forecast, by Region 2019 & 2032
- Table 7: Global Enterprise Server Market Revenue Million Forecast, by Country 2019 & 2032
- Table 8: United States Enterprise Server Market Revenue (Million) Forecast, by Application 2019 & 2032
- Table 9: Canada Enterprise Server Market Revenue (Million) Forecast, by Application 2019 & 2032
- Table 10: Mexico Enterprise Server Market Revenue (Million) Forecast, by Application 2019 & 2032
- Table 11: Global Enterprise Server Market Revenue Million Forecast, by Country 2019 & 2032
- Table 12: Germany Enterprise Server Market Revenue (Million) Forecast, by Application 2019 & 2032
- Table 13: United Kingdom Enterprise Server Market Revenue (Million) Forecast, by Application 2019 & 2032
- Table 14: France Enterprise Server Market Revenue (Million) Forecast, by Application 2019 & 2032
- Table 15: Spain Enterprise Server Market Revenue (Million) Forecast, by Application 2019 & 2032
- Table 16: Italy Enterprise Server Market Revenue (Million) Forecast, by Application 2019 & 2032
- Table 17: Spain Enterprise Server Market Revenue (Million) Forecast, by Application 2019 & 2032
- Table 18: Belgium Enterprise Server Market Revenue (Million) Forecast, by Application 2019 & 2032
- Table 19: Netherland Enterprise Server Market Revenue (Million) Forecast, by Application 2019 & 2032
- Table 20: Nordics Enterprise Server Market Revenue (Million) Forecast, by Application 2019 & 2032
- Table 21: Rest of Europe Enterprise Server Market Revenue (Million) Forecast, by Application 2019 & 2032
- Table 22: Global Enterprise Server Market Revenue Million Forecast, by Country 2019 & 2032
- Table 23: China Enterprise Server Market Revenue (Million) Forecast, by Application 2019 & 2032
- Table 24: Japan Enterprise Server Market Revenue (Million) Forecast, by Application 2019 & 2032
- Table 25: India Enterprise Server Market Revenue (Million) Forecast, by Application 2019 & 2032
- Table 26: South Korea Enterprise Server Market Revenue (Million) Forecast, by Application 2019 & 2032
- Table 27: Southeast Asia Enterprise Server Market Revenue (Million) Forecast, by Application 2019 & 2032
- Table 28: Australia Enterprise Server Market Revenue (Million) Forecast, by Application 2019 & 2032
- Table 29: Indonesia Enterprise Server Market Revenue (Million) Forecast, by Application 2019 & 2032
- Table 30: Phillipes Enterprise Server Market Revenue (Million) Forecast, by Application 2019 & 2032
- Table 31: Singapore Enterprise Server Market Revenue (Million) Forecast, by Application 2019 & 2032
- Table 32: Thailandc Enterprise Server Market Revenue (Million) Forecast, by Application 2019 & 2032
- Table 33: Rest of Asia Pacific Enterprise Server Market Revenue (Million) Forecast, by Application 2019 & 2032
- Table 34: Global Enterprise Server Market Revenue Million Forecast, by Country 2019 & 2032
- Table 35: Brazil Enterprise Server Market Revenue (Million) Forecast, by Application 2019 & 2032
- Table 36: Argentina Enterprise Server Market Revenue (Million) Forecast, by Application 2019 & 2032
- Table 37: Peru Enterprise Server Market Revenue (Million) Forecast, by Application 2019 & 2032
- Table 38: Chile Enterprise Server Market Revenue (Million) Forecast, by Application 2019 & 2032
- Table 39: Colombia Enterprise Server Market Revenue (Million) Forecast, by Application 2019 & 2032
- Table 40: Ecuador Enterprise Server Market Revenue (Million) Forecast, by Application 2019 & 2032
- Table 41: Venezuela Enterprise Server Market Revenue (Million) Forecast, by Application 2019 & 2032
- Table 42: Rest of South America Enterprise Server Market Revenue (Million) Forecast, by Application 2019 & 2032
- Table 43: Global Enterprise Server Market Revenue Million Forecast, by Country 2019 & 2032
- Table 44: United States Enterprise Server Market Revenue (Million) Forecast, by Application 2019 & 2032
- Table 45: Canada Enterprise Server Market Revenue (Million) Forecast, by Application 2019 & 2032
- Table 46: Mexico Enterprise Server Market Revenue (Million) Forecast, by Application 2019 & 2032
- Table 47: Global Enterprise Server Market Revenue Million Forecast, by Country 2019 & 2032
- Table 48: United Arab Emirates Enterprise Server Market Revenue (Million) Forecast, by Application 2019 & 2032
- Table 49: Saudi Arabia Enterprise Server Market Revenue (Million) Forecast, by Application 2019 & 2032
- Table 50: South Africa Enterprise Server Market Revenue (Million) Forecast, by Application 2019 & 2032
- Table 51: Rest of Middle East and Africa Enterprise Server Market Revenue (Million) Forecast, by Application 2019 & 2032
- Table 52: Global Enterprise Server Market Revenue Million Forecast, by Operating System 2019 & 2032
- Table 53: Global Enterprise Server Market Revenue Million Forecast, by Server Class 2019 & 2032
- Table 54: Global Enterprise Server Market Revenue Million Forecast, by Server Type 2019 & 2032
- Table 55: Global Enterprise Server Market Revenue Million Forecast, by End-user Vertical 2019 & 2032
- Table 56: Global Enterprise Server Market Revenue Million Forecast, by Country 2019 & 2032
- Table 57: Global Enterprise Server Market Revenue Million Forecast, by Operating System 2019 & 2032
- Table 58: Global Enterprise Server Market Revenue Million Forecast, by Server Class 2019 & 2032
- Table 59: Global Enterprise Server Market Revenue Million Forecast, by Server Type 2019 & 2032
- Table 60: Global Enterprise Server Market Revenue Million Forecast, by End-user Vertical 2019 & 2032
- Table 61: Global Enterprise Server Market Revenue Million Forecast, by Country 2019 & 2032
- Table 62: Global Enterprise Server Market Revenue Million Forecast, by Operating System 2019 & 2032
- Table 63: Global Enterprise Server Market Revenue Million Forecast, by Server Class 2019 & 2032
- Table 64: Global Enterprise Server Market Revenue Million Forecast, by Server Type 2019 & 2032
- Table 65: Global Enterprise Server Market Revenue Million Forecast, by End-user Vertical 2019 & 2032
- Table 66: Global Enterprise Server Market Revenue Million Forecast, by Country 2019 & 2032
- Table 67: Global Enterprise Server Market Revenue Million Forecast, by Operating System 2019 & 2032
- Table 68: Global Enterprise Server Market Revenue Million Forecast, by Server Class 2019 & 2032
- Table 69: Global Enterprise Server Market Revenue Million Forecast, by Server Type 2019 & 2032
- Table 70: Global Enterprise Server Market Revenue Million Forecast, by End-user Vertical 2019 & 2032
- Table 71: Global Enterprise Server Market Revenue Million Forecast, by Country 2019 & 2032
- Table 72: Global Enterprise Server Market Revenue Million Forecast, by Operating System 2019 & 2032
- Table 73: Global Enterprise Server Market Revenue Million Forecast, by Server Class 2019 & 2032
- Table 74: Global Enterprise Server Market Revenue Million Forecast, by Server Type 2019 & 2032
- Table 75: Global Enterprise Server Market Revenue Million Forecast, by End-user Vertical 2019 & 2032
- Table 76: Global Enterprise Server Market Revenue Million Forecast, by Country 2019 & 2032
Frequently Asked Questions
1. What is the projected Compound Annual Growth Rate (CAGR) of the Enterprise Server Market?
The projected CAGR is approximately 8.03%.
2. Which companies are prominent players in the Enterprise Server Market?
Key companies in the market include Unisys Corporation, IBM Corporation, Fujitsu Ltd, Hewlett Packard Enterprise Co, NEC corporation, Hitachi Ltd, Cisco Systems Inc, Toshiba Corporation*List Not Exhaustive, Oracle Corporation, Dell Technologies Inc, Lenovo Group Ltd.
3. What are the main segments of the Enterprise Server Market?
The market segments include Operating System, Server Class, Server Type, End-user Vertical.
4. Can you provide details about the market size?
The market size is estimated to be USD 87.96 Million as of 2022.
5. What are some drivers contributing to market growth?
Increasing Adoption of Migration to the Cloud; Growth of Big Data.
6. What are the notable trends driving market growth?
Rack Optimized Server Type to Witness High Growth.
7. Are there any restraints impacting market growth?
Adoption of Server Virtualization.
8. Can you provide examples of recent developments in the market?
August 2022: Inspur Information, an IT infrastructure solutions provider, is combining AIStation, its unified management and scheduling AI computing resource platform, with NVIDIA AI Enterprise, a cloud-native suite of AI and data analytics software, to provide enterprise users with an efficient platform for utilizing AI computing resources.
9. What pricing options are available for accessing the report?
Pricing options include single-user, multi-user, and enterprise licenses priced at USD 4750, USD 5250, and USD 8750 respectively.
10. Is the market size provided in terms of value or volume?
The market size is provided in terms of value, measured in Million.
11. Are there any specific market keywords associated with the report?
Yes, the market keyword associated with the report is "Enterprise Server Market," which aids in identifying and referencing the specific market segment covered.
12. How do I determine which pricing option suits my needs best?
The pricing options vary based on user requirements and access needs. Individual users may opt for single-user licenses, while businesses requiring broader access may choose multi-user or enterprise licenses for cost-effective access to the report.
13. Are there any additional resources or data provided in the Enterprise Server Market report?
While the report offers comprehensive insights, it's advisable to review the specific contents or supplementary materials provided to ascertain if additional resources or data are available.
14. How can I stay updated on further developments or reports in the Enterprise Server Market?
To stay informed about further developments, trends, and reports in the Enterprise Server Market, consider subscribing to industry newsletters, following relevant companies and organizations, or regularly checking reputable industry news sources and publications.
Methodology
Step 1 - Identification of Relevant Samples Size from Population Database


Step 2 - Approaches for Defining Global Market Size (Value, Volume* & Price*)

Note*: In applicable scenarios
Step 3 - Data Sources
Primary Research
- Web Analytics
- Survey Reports
- Research Institute
- Latest Research Reports
- Opinion Leaders
Secondary Research
- Annual Reports
- White Paper
- Latest Press Release
- Industry Association
- Paid Database
- Investor Presentations

Step 4 - Data Triangulation
Involves using different sources of information in order to increase the validity of a study
These sources are likely to be stakeholders in a program - participants, other researchers, program staff, other community members, and so on.
Then we put all data in single framework & apply various statistical tools to find out the dynamic on the market.
During the analysis stage, feedback from the stakeholder groups would be compared to determine areas of agreement as well as areas of divergence
