

Key Insights
The global engine intake filter market is experiencing robust growth, driven by the increasing demand for vehicles, particularly in developing economies, and stringent emission regulations worldwide. The market's expansion is fueled by several key factors: the rising adoption of advanced filtration technologies offering improved engine protection and fuel efficiency, the growing preference for cleaner air, and the increasing awareness of the environmental impact of vehicle emissions. Leading players like Freudenberg, Donaldson, and Mann+Hummel are continuously innovating to offer filters with enhanced performance and durability, further stimulating market growth. Technological advancements such as nanofiber filtration and sensor integration are enhancing filter effectiveness and lifespan, leading to higher adoption rates. However, fluctuations in raw material prices and the economic climate can pose challenges to market growth. The market segmentation reveals significant opportunities across different vehicle types (passenger cars, commercial vehicles, off-highway vehicles), with the passenger car segment dominating due to higher vehicle sales volume. Regional variations in market share reflect economic development and vehicle ownership levels, with North America and Europe currently holding significant shares but experiencing comparatively slower growth than emerging markets in Asia-Pacific and Latin America. The forecast period suggests a continued upward trajectory, primarily driven by sustained demand in emerging markets and technological advancements.
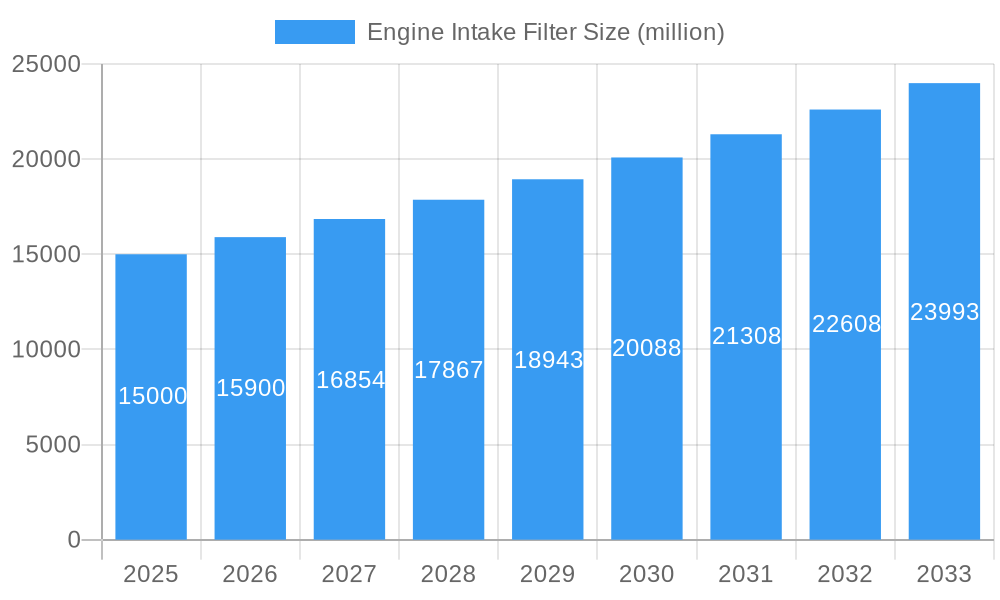
Engine Intake Filter Market Size (In Billion)
The competitive landscape is marked by the presence of several established global players and regional manufacturers. These companies are focusing on strategic collaborations, mergers and acquisitions, and product diversification to enhance their market positioning. The focus on research and development is evident in the introduction of innovative filter designs that cater to specific engine requirements and environmental regulations. The market is witnessing a shift toward higher-efficiency filters with longer service life, aligning with the trend toward reduced maintenance costs and optimized vehicle performance. While challenges remain in terms of raw material costs and economic uncertainty, the long-term outlook for the engine intake filter market remains optimistic, driven by continuous innovation and increasing vehicle production globally. A projected CAGR (assuming a realistic 5-7% CAGR based on industry trends) points towards a significantly larger market in 2033 compared to 2025, representing considerable opportunities for market participants.
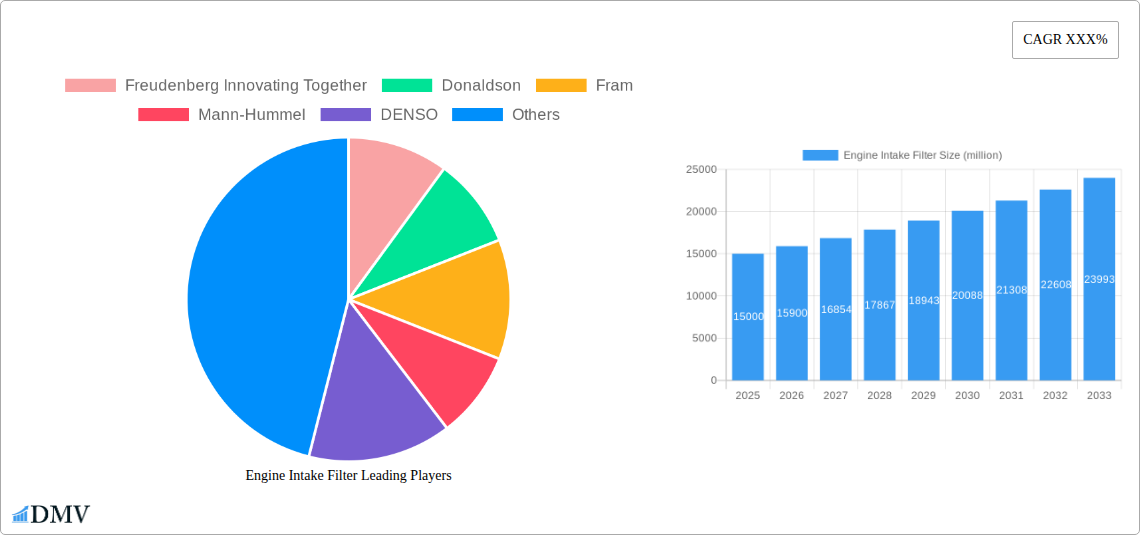
Engine Intake Filter Company Market Share
Engine Intake Filter Market Report: A Comprehensive Analysis (2019-2033)
This comprehensive report provides an in-depth analysis of the global engine intake filter market, projecting a market valuation exceeding $XX million by 2033. The study covers the period from 2019 to 2033, with a base year of 2025 and a forecast period spanning 2025-2033. This report is crucial for stakeholders seeking to understand market dynamics, identify growth opportunities, and make informed strategic decisions within this vital automotive component sector.
Engine Intake Filter Market Composition & Trends
The global engine intake filter market, valued at $XX million in 2025, exhibits a moderately concentrated landscape. Key players like Freudenberg Innovating Together, Donaldson, Fram, Mann-Hummel, DENSO, Mann Filter, Filtron, Cummins, and Mahle collectively hold over 70% market share. Market share distribution fluctuates based on technological advancements, regional demand, and successful M&A activities. The past five years have witnessed over $XX million in M&A deals, primarily driven by expansion into emerging markets and technological integration. Innovation catalysts include stricter emission regulations, growing demand for enhanced filtration efficiency, and the rise of electric vehicles (although the latter presents unique filtration challenges). Substitute products, such as high-efficiency particulate air (HEPA) filters, are limited due to cost and performance limitations. End-user profiles comprise automotive OEMs, aftermarket suppliers, and commercial vehicle manufacturers.
- Market Concentration: Moderately concentrated, with top players holding >70% market share in 2025.
- Innovation Catalysts: Stringent emission norms, improved filtration efficiency demands, EV market emergence.
- Regulatory Landscape: Stringent emission standards globally are key drivers.
- Substitute Products: Limited viable alternatives due to cost-performance trade-offs.
- End-User Profiles: Automotive OEMs, aftermarket suppliers, commercial vehicle manufacturers.
- M&A Activity: Over $XX million in deals (2019-2024), focused on market expansion and technology integration.
Engine Intake Filter Industry Evolution
The engine intake filter market has demonstrated consistent growth throughout the historical period (2019-2024), with a Compound Annual Growth Rate (CAGR) of XX%. This growth is attributed to factors such as increasing vehicle production, particularly in developing economies, and the rising demand for improved fuel efficiency and reduced emissions. Technological advancements, such as the introduction of synthetic media filters and improved filter designs, have further enhanced market growth. Consumer demand is shifting towards longer-lasting, higher-performing filters, driving innovation in filter media and design. The forecast period (2025-2033) anticipates continued growth, driven by stricter emission regulations in various regions and the adoption of advanced filtration technologies. The adoption rate of synthetic media filters is projected to increase by XX% annually during the forecast period. Market growth will also be significantly influenced by the evolving landscape of electric vehicles and their specific filter requirements, anticipated to reach XX million units by 2033.
Leading Regions, Countries, or Segments in Engine Intake Filter
The Asia-Pacific region is projected to dominate the engine intake filter market throughout the forecast period, driven primarily by robust automotive production and rising consumer spending power.
- Key Drivers (Asia-Pacific):
- Significant investments in automotive manufacturing capacity.
- Strong government support for sustainable transportation initiatives.
- Rapid growth of the middle class, leading to increased vehicle ownership.
The dominance of the Asia-Pacific region stems from its massive automotive manufacturing base, particularly in China and India. This region's continuous growth in vehicle production, supported by government initiatives promoting sustainable transportation, provides a fertile ground for the intake filter market. Additionally, the expansion of the middle class and increasing disposable incomes have fueled demand for personal vehicles.
Engine Intake Filter Product Innovations
Recent innovations focus on enhancing filter media materials, optimizing filter designs for improved airflow and filtration efficiency, and incorporating sensor technology for real-time monitoring of filter performance. These advancements offer superior dust-holding capacity, extended service life, and improved engine protection. Unique selling propositions include reduced pressure drops, optimized filtration for various engine types, and integration with smart vehicle systems.
Propelling Factors for Engine Intake Filter Growth
The growth of the engine intake filter market is primarily fueled by stricter emission regulations globally, driving demand for advanced filtration technologies. The increasing production of vehicles, particularly in developing economies, further contributes to this growth. Technological advancements, such as the development of synthetic media filters with enhanced performance, also play a crucial role. Furthermore, the growing awareness among consumers about the importance of engine protection is leading to higher demand for high-quality filters.
Obstacles in the Engine Intake Filter Market
The engine intake filter market faces challenges including fluctuating raw material prices impacting manufacturing costs. Supply chain disruptions caused by geopolitical events and natural disasters can hinder production and delivery. Intense competition among established players requires continuous innovation and cost optimization to maintain market share. Moreover, the increasing adoption of electric vehicles presents both opportunities and challenges, as the filtration needs in EVs differ from those in traditional combustion engines. This shift necessitates adaptation and innovation in filter design and materials.
Future Opportunities in Engine Intake Filter
Future growth opportunities lie in the development of filters tailored to the specific needs of electric vehicles, focusing on efficient particulate matter filtration. The expansion into emerging markets with growing automotive sectors offers significant potential. The integration of smart sensor technology for real-time filter monitoring and predictive maintenance presents further opportunities for value addition.
Major Players in the Engine Intake Filter Ecosystem
- Freudenberg Innovating Together
- Donaldson
- Fram
- Mann-Hummel
- DENSO
- Mann Filter
- Filtron
- Cummins
- Mahle
Key Developments in Engine Intake Filter Industry
- 2022-Q4: Mann-Hummel launched a new line of synthetic media filters for improved efficiency.
- 2023-Q1: Donaldson acquired a smaller filter manufacturer, expanding its market reach.
- 2024-Q2: New emission standards implemented in Europe spurred innovation in filter technology.
Strategic Engine Intake Filter Market Forecast
The global engine intake filter market is poised for sustained growth, fueled by increasing vehicle production, stringent emission regulations, and ongoing technological advancements. Emerging markets and the growing demand for higher-efficiency filters will contribute to a significant market expansion during the forecast period. This growth will be particularly strong in regions with rapid automotive industry growth and a rising middle class. The development of specialized filters for electric vehicles will represent a substantial growth opportunity in the coming years.
Engine Intake Filter Segmentation
-
1. Application
- 1.1. Passenger Car
- 1.2. Commercial Vehicle
-
2. Type
- 2.1. Wet Type
- 2.2. Dry Type
Engine Intake Filter Segmentation By Geography
-
1. North America
- 1.1. United States
- 1.2. Canada
- 1.3. Mexico
-
2. South America
- 2.1. Brazil
- 2.2. Argentina
- 2.3. Rest of South America
-
3. Europe
- 3.1. United Kingdom
- 3.2. Germany
- 3.3. France
- 3.4. Italy
- 3.5. Spain
- 3.6. Russia
- 3.7. Benelux
- 3.8. Nordics
- 3.9. Rest of Europe
-
4. Middle East & Africa
- 4.1. Turkey
- 4.2. Israel
- 4.3. GCC
- 4.4. North Africa
- 4.5. South Africa
- 4.6. Rest of Middle East & Africa
-
5. Asia Pacific
- 5.1. China
- 5.2. India
- 5.3. Japan
- 5.4. South Korea
- 5.5. ASEAN
- 5.6. Oceania
- 5.7. Rest of Asia Pacific
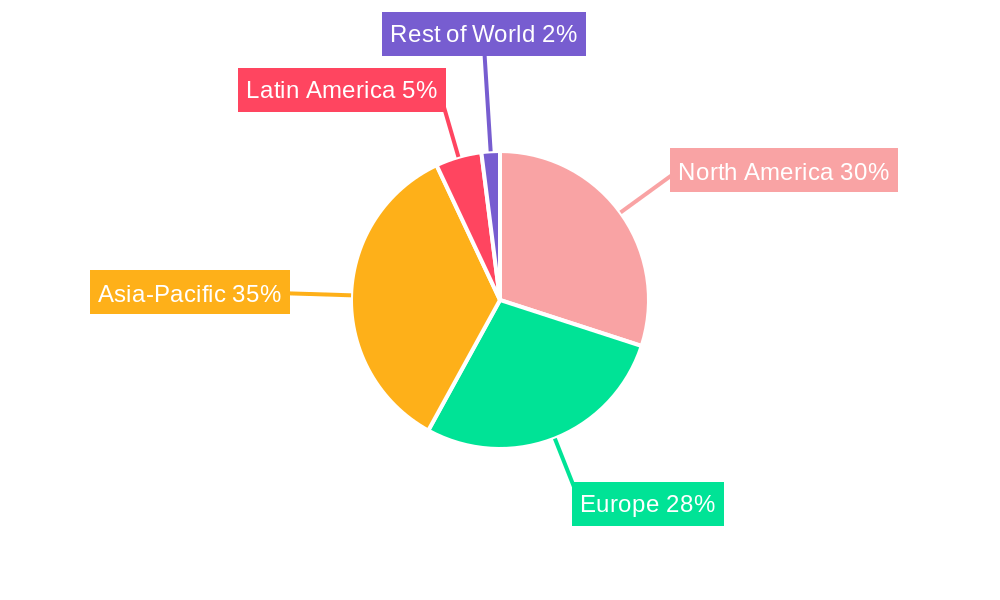
Engine Intake Filter Regional Market Share
Geographic Coverage of Engine Intake Filter
Engine Intake Filter REPORT HIGHLIGHTS
| Aspects | Details |
|---|---|
| Study Period | 2020-2034 |
| Base Year | 2025 |
| Estimated Year | 2026 |
| Forecast Period | 2026-2034 |
| Historical Period | 2020-2025 |
| Growth Rate | CAGR of XXX% from 2020-2034 |
| Segmentation |
|
Table of Contents
- 1. Introduction
- 1.1. Research Scope
- 1.2. Market Segmentation
- 1.3. Research Methodology
- 1.4. Definitions and Assumptions
- 2. Executive Summary
- 2.1. Introduction
- 3. Market Dynamics
- 3.1. Introduction
- 3.2. Market Drivers
- 3.3. Market Restrains
- 3.4. Market Trends
- 4. Market Factor Analysis
- 4.1. Porters Five Forces
- 4.2. Supply/Value Chain
- 4.3. PESTEL analysis
- 4.4. Market Entropy
- 4.5. Patent/Trademark Analysis
- 5. Global Engine Intake Filter Analysis, Insights and Forecast, 2020-2032
- 5.1. Market Analysis, Insights and Forecast - by Application
- 5.1.1. Passenger Car
- 5.1.2. Commercial Vehicle
- 5.2. Market Analysis, Insights and Forecast - by Type
- 5.2.1. Wet Type
- 5.2.2. Dry Type
- 5.3. Market Analysis, Insights and Forecast - by Region
- 5.3.1. North America
- 5.3.2. South America
- 5.3.3. Europe
- 5.3.4. Middle East & Africa
- 5.3.5. Asia Pacific
- 5.1. Market Analysis, Insights and Forecast - by Application
- 6. North America Engine Intake Filter Analysis, Insights and Forecast, 2020-2032
- 6.1. Market Analysis, Insights and Forecast - by Application
- 6.1.1. Passenger Car
- 6.1.2. Commercial Vehicle
- 6.2. Market Analysis, Insights and Forecast - by Type
- 6.2.1. Wet Type
- 6.2.2. Dry Type
- 6.1. Market Analysis, Insights and Forecast - by Application
- 7. South America Engine Intake Filter Analysis, Insights and Forecast, 2020-2032
- 7.1. Market Analysis, Insights and Forecast - by Application
- 7.1.1. Passenger Car
- 7.1.2. Commercial Vehicle
- 7.2. Market Analysis, Insights and Forecast - by Type
- 7.2.1. Wet Type
- 7.2.2. Dry Type
- 7.1. Market Analysis, Insights and Forecast - by Application
- 8. Europe Engine Intake Filter Analysis, Insights and Forecast, 2020-2032
- 8.1. Market Analysis, Insights and Forecast - by Application
- 8.1.1. Passenger Car
- 8.1.2. Commercial Vehicle
- 8.2. Market Analysis, Insights and Forecast - by Type
- 8.2.1. Wet Type
- 8.2.2. Dry Type
- 8.1. Market Analysis, Insights and Forecast - by Application
- 9. Middle East & Africa Engine Intake Filter Analysis, Insights and Forecast, 2020-2032
- 9.1. Market Analysis, Insights and Forecast - by Application
- 9.1.1. Passenger Car
- 9.1.2. Commercial Vehicle
- 9.2. Market Analysis, Insights and Forecast - by Type
- 9.2.1. Wet Type
- 9.2.2. Dry Type
- 9.1. Market Analysis, Insights and Forecast - by Application
- 10. Asia Pacific Engine Intake Filter Analysis, Insights and Forecast, 2020-2032
- 10.1. Market Analysis, Insights and Forecast - by Application
- 10.1.1. Passenger Car
- 10.1.2. Commercial Vehicle
- 10.2. Market Analysis, Insights and Forecast - by Type
- 10.2.1. Wet Type
- 10.2.2. Dry Type
- 10.1. Market Analysis, Insights and Forecast - by Application
- 11. Competitive Analysis
- 11.1. Global Market Share Analysis 2025
- 11.2. Company Profiles
- 11.2.1 Freudenberg Innovating Together
- 11.2.1.1. Overview
- 11.2.1.2. Products
- 11.2.1.3. SWOT Analysis
- 11.2.1.4. Recent Developments
- 11.2.1.5. Financials (Based on Availability)
- 11.2.2 Donaldson
- 11.2.2.1. Overview
- 11.2.2.2. Products
- 11.2.2.3. SWOT Analysis
- 11.2.2.4. Recent Developments
- 11.2.2.5. Financials (Based on Availability)
- 11.2.3 Fram
- 11.2.3.1. Overview
- 11.2.3.2. Products
- 11.2.3.3. SWOT Analysis
- 11.2.3.4. Recent Developments
- 11.2.3.5. Financials (Based on Availability)
- 11.2.4 Mann-Hummel
- 11.2.4.1. Overview
- 11.2.4.2. Products
- 11.2.4.3. SWOT Analysis
- 11.2.4.4. Recent Developments
- 11.2.4.5. Financials (Based on Availability)
- 11.2.5 DENSO
- 11.2.5.1. Overview
- 11.2.5.2. Products
- 11.2.5.3. SWOT Analysis
- 11.2.5.4. Recent Developments
- 11.2.5.5. Financials (Based on Availability)
- 11.2.6 Mann Filter
- 11.2.6.1. Overview
- 11.2.6.2. Products
- 11.2.6.3. SWOT Analysis
- 11.2.6.4. Recent Developments
- 11.2.6.5. Financials (Based on Availability)
- 11.2.7 Filtron
- 11.2.7.1. Overview
- 11.2.7.2. Products
- 11.2.7.3. SWOT Analysis
- 11.2.7.4. Recent Developments
- 11.2.7.5. Financials (Based on Availability)
- 11.2.8 Cummins
- 11.2.8.1. Overview
- 11.2.8.2. Products
- 11.2.8.3. SWOT Analysis
- 11.2.8.4. Recent Developments
- 11.2.8.5. Financials (Based on Availability)
- 11.2.9 Mahle
- 11.2.9.1. Overview
- 11.2.9.2. Products
- 11.2.9.3. SWOT Analysis
- 11.2.9.4. Recent Developments
- 11.2.9.5. Financials (Based on Availability)
- 11.2.1 Freudenberg Innovating Together
List of Figures
- Figure 1: Global Engine Intake Filter Revenue Breakdown (million, %) by Region 2025 & 2033
- Figure 2: Global Engine Intake Filter Volume Breakdown (K, %) by Region 2025 & 2033
- Figure 3: North America Engine Intake Filter Revenue (million), by Application 2025 & 2033
- Figure 4: North America Engine Intake Filter Volume (K), by Application 2025 & 2033
- Figure 5: North America Engine Intake Filter Revenue Share (%), by Application 2025 & 2033
- Figure 6: North America Engine Intake Filter Volume Share (%), by Application 2025 & 2033
- Figure 7: North America Engine Intake Filter Revenue (million), by Type 2025 & 2033
- Figure 8: North America Engine Intake Filter Volume (K), by Type 2025 & 2033
- Figure 9: North America Engine Intake Filter Revenue Share (%), by Type 2025 & 2033
- Figure 10: North America Engine Intake Filter Volume Share (%), by Type 2025 & 2033
- Figure 11: North America Engine Intake Filter Revenue (million), by Country 2025 & 2033
- Figure 12: North America Engine Intake Filter Volume (K), by Country 2025 & 2033
- Figure 13: North America Engine Intake Filter Revenue Share (%), by Country 2025 & 2033
- Figure 14: North America Engine Intake Filter Volume Share (%), by Country 2025 & 2033
- Figure 15: South America Engine Intake Filter Revenue (million), by Application 2025 & 2033
- Figure 16: South America Engine Intake Filter Volume (K), by Application 2025 & 2033
- Figure 17: South America Engine Intake Filter Revenue Share (%), by Application 2025 & 2033
- Figure 18: South America Engine Intake Filter Volume Share (%), by Application 2025 & 2033
- Figure 19: South America Engine Intake Filter Revenue (million), by Type 2025 & 2033
- Figure 20: South America Engine Intake Filter Volume (K), by Type 2025 & 2033
- Figure 21: South America Engine Intake Filter Revenue Share (%), by Type 2025 & 2033
- Figure 22: South America Engine Intake Filter Volume Share (%), by Type 2025 & 2033
- Figure 23: South America Engine Intake Filter Revenue (million), by Country 2025 & 2033
- Figure 24: South America Engine Intake Filter Volume (K), by Country 2025 & 2033
- Figure 25: South America Engine Intake Filter Revenue Share (%), by Country 2025 & 2033
- Figure 26: South America Engine Intake Filter Volume Share (%), by Country 2025 & 2033
- Figure 27: Europe Engine Intake Filter Revenue (million), by Application 2025 & 2033
- Figure 28: Europe Engine Intake Filter Volume (K), by Application 2025 & 2033
- Figure 29: Europe Engine Intake Filter Revenue Share (%), by Application 2025 & 2033
- Figure 30: Europe Engine Intake Filter Volume Share (%), by Application 2025 & 2033
- Figure 31: Europe Engine Intake Filter Revenue (million), by Type 2025 & 2033
- Figure 32: Europe Engine Intake Filter Volume (K), by Type 2025 & 2033
- Figure 33: Europe Engine Intake Filter Revenue Share (%), by Type 2025 & 2033
- Figure 34: Europe Engine Intake Filter Volume Share (%), by Type 2025 & 2033
- Figure 35: Europe Engine Intake Filter Revenue (million), by Country 2025 & 2033
- Figure 36: Europe Engine Intake Filter Volume (K), by Country 2025 & 2033
- Figure 37: Europe Engine Intake Filter Revenue Share (%), by Country 2025 & 2033
- Figure 38: Europe Engine Intake Filter Volume Share (%), by Country 2025 & 2033
- Figure 39: Middle East & Africa Engine Intake Filter Revenue (million), by Application 2025 & 2033
- Figure 40: Middle East & Africa Engine Intake Filter Volume (K), by Application 2025 & 2033
- Figure 41: Middle East & Africa Engine Intake Filter Revenue Share (%), by Application 2025 & 2033
- Figure 42: Middle East & Africa Engine Intake Filter Volume Share (%), by Application 2025 & 2033
- Figure 43: Middle East & Africa Engine Intake Filter Revenue (million), by Type 2025 & 2033
- Figure 44: Middle East & Africa Engine Intake Filter Volume (K), by Type 2025 & 2033
- Figure 45: Middle East & Africa Engine Intake Filter Revenue Share (%), by Type 2025 & 2033
- Figure 46: Middle East & Africa Engine Intake Filter Volume Share (%), by Type 2025 & 2033
- Figure 47: Middle East & Africa Engine Intake Filter Revenue (million), by Country 2025 & 2033
- Figure 48: Middle East & Africa Engine Intake Filter Volume (K), by Country 2025 & 2033
- Figure 49: Middle East & Africa Engine Intake Filter Revenue Share (%), by Country 2025 & 2033
- Figure 50: Middle East & Africa Engine Intake Filter Volume Share (%), by Country 2025 & 2033
- Figure 51: Asia Pacific Engine Intake Filter Revenue (million), by Application 2025 & 2033
- Figure 52: Asia Pacific Engine Intake Filter Volume (K), by Application 2025 & 2033
- Figure 53: Asia Pacific Engine Intake Filter Revenue Share (%), by Application 2025 & 2033
- Figure 54: Asia Pacific Engine Intake Filter Volume Share (%), by Application 2025 & 2033
- Figure 55: Asia Pacific Engine Intake Filter Revenue (million), by Type 2025 & 2033
- Figure 56: Asia Pacific Engine Intake Filter Volume (K), by Type 2025 & 2033
- Figure 57: Asia Pacific Engine Intake Filter Revenue Share (%), by Type 2025 & 2033
- Figure 58: Asia Pacific Engine Intake Filter Volume Share (%), by Type 2025 & 2033
- Figure 59: Asia Pacific Engine Intake Filter Revenue (million), by Country 2025 & 2033
- Figure 60: Asia Pacific Engine Intake Filter Volume (K), by Country 2025 & 2033
- Figure 61: Asia Pacific Engine Intake Filter Revenue Share (%), by Country 2025 & 2033
- Figure 62: Asia Pacific Engine Intake Filter Volume Share (%), by Country 2025 & 2033
List of Tables
- Table 1: Global Engine Intake Filter Revenue million Forecast, by Application 2020 & 2033
- Table 2: Global Engine Intake Filter Volume K Forecast, by Application 2020 & 2033
- Table 3: Global Engine Intake Filter Revenue million Forecast, by Type 2020 & 2033
- Table 4: Global Engine Intake Filter Volume K Forecast, by Type 2020 & 2033
- Table 5: Global Engine Intake Filter Revenue million Forecast, by Region 2020 & 2033
- Table 6: Global Engine Intake Filter Volume K Forecast, by Region 2020 & 2033
- Table 7: Global Engine Intake Filter Revenue million Forecast, by Application 2020 & 2033
- Table 8: Global Engine Intake Filter Volume K Forecast, by Application 2020 & 2033
- Table 9: Global Engine Intake Filter Revenue million Forecast, by Type 2020 & 2033
- Table 10: Global Engine Intake Filter Volume K Forecast, by Type 2020 & 2033
- Table 11: Global Engine Intake Filter Revenue million Forecast, by Country 2020 & 2033
- Table 12: Global Engine Intake Filter Volume K Forecast, by Country 2020 & 2033
- Table 13: United States Engine Intake Filter Revenue (million) Forecast, by Application 2020 & 2033
- Table 14: United States Engine Intake Filter Volume (K) Forecast, by Application 2020 & 2033
- Table 15: Canada Engine Intake Filter Revenue (million) Forecast, by Application 2020 & 2033
- Table 16: Canada Engine Intake Filter Volume (K) Forecast, by Application 2020 & 2033
- Table 17: Mexico Engine Intake Filter Revenue (million) Forecast, by Application 2020 & 2033
- Table 18: Mexico Engine Intake Filter Volume (K) Forecast, by Application 2020 & 2033
- Table 19: Global Engine Intake Filter Revenue million Forecast, by Application 2020 & 2033
- Table 20: Global Engine Intake Filter Volume K Forecast, by Application 2020 & 2033
- Table 21: Global Engine Intake Filter Revenue million Forecast, by Type 2020 & 2033
- Table 22: Global Engine Intake Filter Volume K Forecast, by Type 2020 & 2033
- Table 23: Global Engine Intake Filter Revenue million Forecast, by Country 2020 & 2033
- Table 24: Global Engine Intake Filter Volume K Forecast, by Country 2020 & 2033
- Table 25: Brazil Engine Intake Filter Revenue (million) Forecast, by Application 2020 & 2033
- Table 26: Brazil Engine Intake Filter Volume (K) Forecast, by Application 2020 & 2033
- Table 27: Argentina Engine Intake Filter Revenue (million) Forecast, by Application 2020 & 2033
- Table 28: Argentina Engine Intake Filter Volume (K) Forecast, by Application 2020 & 2033
- Table 29: Rest of South America Engine Intake Filter Revenue (million) Forecast, by Application 2020 & 2033
- Table 30: Rest of South America Engine Intake Filter Volume (K) Forecast, by Application 2020 & 2033
- Table 31: Global Engine Intake Filter Revenue million Forecast, by Application 2020 & 2033
- Table 32: Global Engine Intake Filter Volume K Forecast, by Application 2020 & 2033
- Table 33: Global Engine Intake Filter Revenue million Forecast, by Type 2020 & 2033
- Table 34: Global Engine Intake Filter Volume K Forecast, by Type 2020 & 2033
- Table 35: Global Engine Intake Filter Revenue million Forecast, by Country 2020 & 2033
- Table 36: Global Engine Intake Filter Volume K Forecast, by Country 2020 & 2033
- Table 37: United Kingdom Engine Intake Filter Revenue (million) Forecast, by Application 2020 & 2033
- Table 38: United Kingdom Engine Intake Filter Volume (K) Forecast, by Application 2020 & 2033
- Table 39: Germany Engine Intake Filter Revenue (million) Forecast, by Application 2020 & 2033
- Table 40: Germany Engine Intake Filter Volume (K) Forecast, by Application 2020 & 2033
- Table 41: France Engine Intake Filter Revenue (million) Forecast, by Application 2020 & 2033
- Table 42: France Engine Intake Filter Volume (K) Forecast, by Application 2020 & 2033
- Table 43: Italy Engine Intake Filter Revenue (million) Forecast, by Application 2020 & 2033
- Table 44: Italy Engine Intake Filter Volume (K) Forecast, by Application 2020 & 2033
- Table 45: Spain Engine Intake Filter Revenue (million) Forecast, by Application 2020 & 2033
- Table 46: Spain Engine Intake Filter Volume (K) Forecast, by Application 2020 & 2033
- Table 47: Russia Engine Intake Filter Revenue (million) Forecast, by Application 2020 & 2033
- Table 48: Russia Engine Intake Filter Volume (K) Forecast, by Application 2020 & 2033
- Table 49: Benelux Engine Intake Filter Revenue (million) Forecast, by Application 2020 & 2033
- Table 50: Benelux Engine Intake Filter Volume (K) Forecast, by Application 2020 & 2033
- Table 51: Nordics Engine Intake Filter Revenue (million) Forecast, by Application 2020 & 2033
- Table 52: Nordics Engine Intake Filter Volume (K) Forecast, by Application 2020 & 2033
- Table 53: Rest of Europe Engine Intake Filter Revenue (million) Forecast, by Application 2020 & 2033
- Table 54: Rest of Europe Engine Intake Filter Volume (K) Forecast, by Application 2020 & 2033
- Table 55: Global Engine Intake Filter Revenue million Forecast, by Application 2020 & 2033
- Table 56: Global Engine Intake Filter Volume K Forecast, by Application 2020 & 2033
- Table 57: Global Engine Intake Filter Revenue million Forecast, by Type 2020 & 2033
- Table 58: Global Engine Intake Filter Volume K Forecast, by Type 2020 & 2033
- Table 59: Global Engine Intake Filter Revenue million Forecast, by Country 2020 & 2033
- Table 60: Global Engine Intake Filter Volume K Forecast, by Country 2020 & 2033
- Table 61: Turkey Engine Intake Filter Revenue (million) Forecast, by Application 2020 & 2033
- Table 62: Turkey Engine Intake Filter Volume (K) Forecast, by Application 2020 & 2033
- Table 63: Israel Engine Intake Filter Revenue (million) Forecast, by Application 2020 & 2033
- Table 64: Israel Engine Intake Filter Volume (K) Forecast, by Application 2020 & 2033
- Table 65: GCC Engine Intake Filter Revenue (million) Forecast, by Application 2020 & 2033
- Table 66: GCC Engine Intake Filter Volume (K) Forecast, by Application 2020 & 2033
- Table 67: North Africa Engine Intake Filter Revenue (million) Forecast, by Application 2020 & 2033
- Table 68: North Africa Engine Intake Filter Volume (K) Forecast, by Application 2020 & 2033
- Table 69: South Africa Engine Intake Filter Revenue (million) Forecast, by Application 2020 & 2033
- Table 70: South Africa Engine Intake Filter Volume (K) Forecast, by Application 2020 & 2033
- Table 71: Rest of Middle East & Africa Engine Intake Filter Revenue (million) Forecast, by Application 2020 & 2033
- Table 72: Rest of Middle East & Africa Engine Intake Filter Volume (K) Forecast, by Application 2020 & 2033
- Table 73: Global Engine Intake Filter Revenue million Forecast, by Application 2020 & 2033
- Table 74: Global Engine Intake Filter Volume K Forecast, by Application 2020 & 2033
- Table 75: Global Engine Intake Filter Revenue million Forecast, by Type 2020 & 2033
- Table 76: Global Engine Intake Filter Volume K Forecast, by Type 2020 & 2033
- Table 77: Global Engine Intake Filter Revenue million Forecast, by Country 2020 & 2033
- Table 78: Global Engine Intake Filter Volume K Forecast, by Country 2020 & 2033
- Table 79: China Engine Intake Filter Revenue (million) Forecast, by Application 2020 & 2033
- Table 80: China Engine Intake Filter Volume (K) Forecast, by Application 2020 & 2033
- Table 81: India Engine Intake Filter Revenue (million) Forecast, by Application 2020 & 2033
- Table 82: India Engine Intake Filter Volume (K) Forecast, by Application 2020 & 2033
- Table 83: Japan Engine Intake Filter Revenue (million) Forecast, by Application 2020 & 2033
- Table 84: Japan Engine Intake Filter Volume (K) Forecast, by Application 2020 & 2033
- Table 85: South Korea Engine Intake Filter Revenue (million) Forecast, by Application 2020 & 2033
- Table 86: South Korea Engine Intake Filter Volume (K) Forecast, by Application 2020 & 2033
- Table 87: ASEAN Engine Intake Filter Revenue (million) Forecast, by Application 2020 & 2033
- Table 88: ASEAN Engine Intake Filter Volume (K) Forecast, by Application 2020 & 2033
- Table 89: Oceania Engine Intake Filter Revenue (million) Forecast, by Application 2020 & 2033
- Table 90: Oceania Engine Intake Filter Volume (K) Forecast, by Application 2020 & 2033
- Table 91: Rest of Asia Pacific Engine Intake Filter Revenue (million) Forecast, by Application 2020 & 2033
- Table 92: Rest of Asia Pacific Engine Intake Filter Volume (K) Forecast, by Application 2020 & 2033
Frequently Asked Questions
1. What is the projected Compound Annual Growth Rate (CAGR) of the Engine Intake Filter?
The projected CAGR is approximately XXX%.
2. Which companies are prominent players in the Engine Intake Filter?
Key companies in the market include Freudenberg Innovating Together, Donaldson, Fram, Mann-Hummel, DENSO, Mann Filter, Filtron, Cummins, Mahle.
3. What are the main segments of the Engine Intake Filter?
The market segments include Application, Type.
4. Can you provide details about the market size?
The market size is estimated to be USD XXX million as of 2022.
5. What are some drivers contributing to market growth?
N/A
6. What are the notable trends driving market growth?
N/A
7. Are there any restraints impacting market growth?
N/A
8. Can you provide examples of recent developments in the market?
N/A
9. What pricing options are available for accessing the report?
Pricing options include single-user, multi-user, and enterprise licenses priced at USD 3950.00, USD 5925.00, and USD 7900.00 respectively.
10. Is the market size provided in terms of value or volume?
The market size is provided in terms of value, measured in million and volume, measured in K.
11. Are there any specific market keywords associated with the report?
Yes, the market keyword associated with the report is "Engine Intake Filter," which aids in identifying and referencing the specific market segment covered.
12. How do I determine which pricing option suits my needs best?
The pricing options vary based on user requirements and access needs. Individual users may opt for single-user licenses, while businesses requiring broader access may choose multi-user or enterprise licenses for cost-effective access to the report.
13. Are there any additional resources or data provided in the Engine Intake Filter report?
While the report offers comprehensive insights, it's advisable to review the specific contents or supplementary materials provided to ascertain if additional resources or data are available.
14. How can I stay updated on further developments or reports in the Engine Intake Filter?
To stay informed about further developments, trends, and reports in the Engine Intake Filter, consider subscribing to industry newsletters, following relevant companies and organizations, or regularly checking reputable industry news sources and publications.
Methodology
Step 1 - Identification of Relevant Samples Size from Population Database


Step 2 - Approaches for Defining Global Market Size (Value, Volume* & Price*)

Note*: In applicable scenarios
Step 3 - Data Sources
Primary Research
- Web Analytics
- Survey Reports
- Research Institute
- Latest Research Reports
- Opinion Leaders
Secondary Research
- Annual Reports
- White Paper
- Latest Press Release
- Industry Association
- Paid Database
- Investor Presentations

Step 4 - Data Triangulation
Involves using different sources of information in order to increase the validity of a study
These sources are likely to be stakeholders in a program - participants, other researchers, program staff, other community members, and so on.
Then we put all data in single framework & apply various statistical tools to find out the dynamic on the market.
During the analysis stage, feedback from the stakeholder groups would be compared to determine areas of agreement as well as areas of divergence