

Key Insights
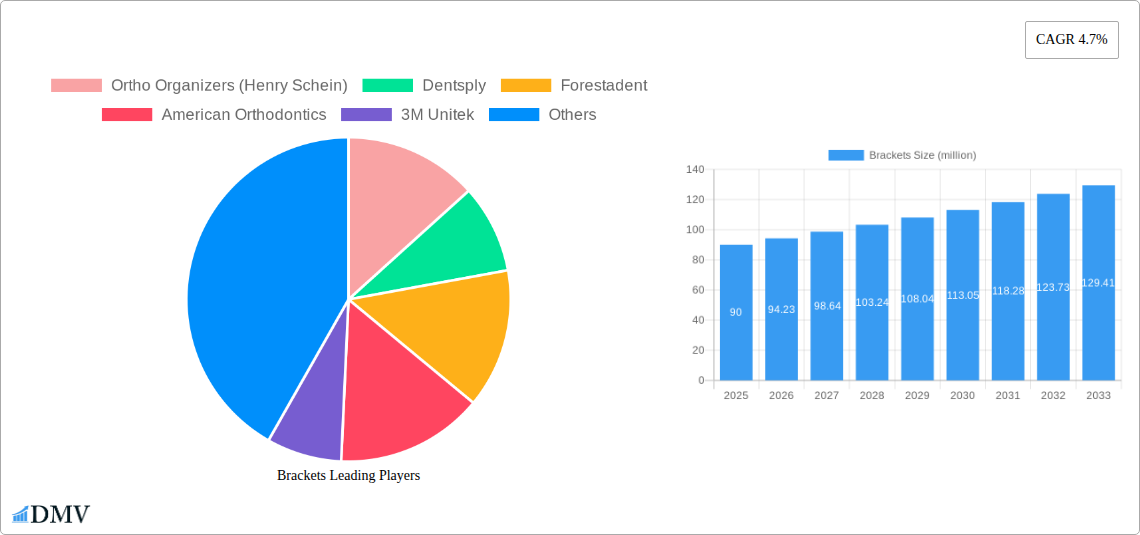
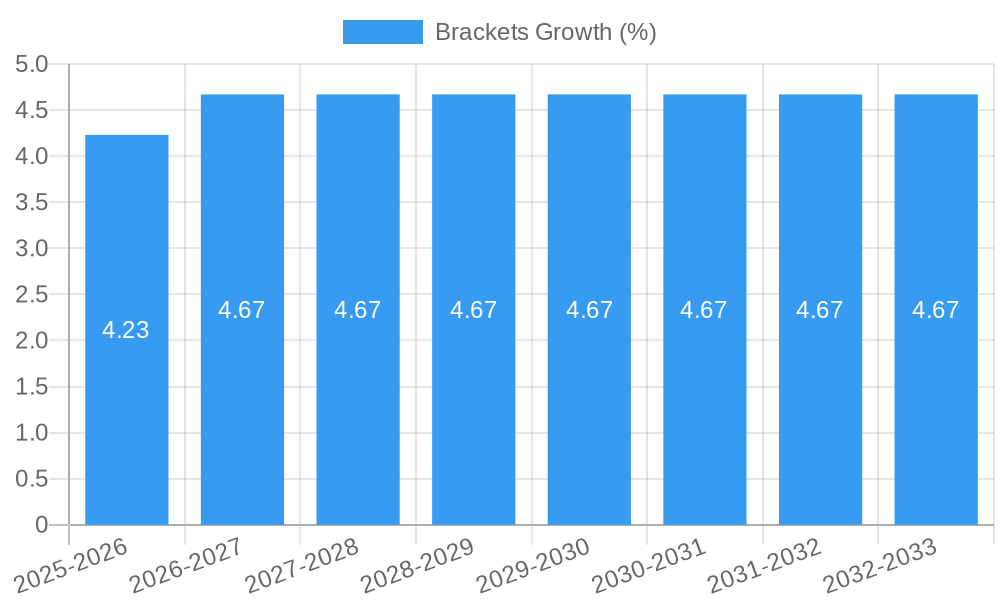
The global orthodontic brackets market, valued at $90 million in 2025, is projected to experience robust growth, driven by a rising prevalence of malocclusion and increasing demand for aesthetic orthodontic treatments. A compound annual growth rate (CAGR) of 4.7% from 2025 to 2033 indicates a significant market expansion. This growth is fueled by several factors, including advancements in bracket technology leading to improved comfort and shorter treatment times, increased awareness of orthodontic treatments among the population, and the growing adoption of minimally invasive procedures. The market is segmented by bracket type (metal, ceramic, lingual, etc.), material, and application (adults, children). Key players such as Ortho Organizers (Henry Schein), Dentsply, and 3M Unitek are driving innovation and expanding their market share through product diversification and strategic partnerships. Geographic expansion into emerging markets with growing middle classes and increasing healthcare spending will also contribute to market growth. While challenges exist, such as high treatment costs and potential side effects, the overall market outlook remains positive due to the ongoing increase in demand for improved dental aesthetics and functional oral health.
The competitive landscape is marked by both established players and emerging companies. Established players leverage their extensive distribution networks and strong brand recognition to maintain market dominance, while smaller companies focus on niche segments and technological advancements to gain traction. The market is expected to see increased consolidation and strategic alliances in the coming years, as companies seek to expand their product portfolios and geographic reach. Furthermore, technological advancements, such as the integration of 3D printing and digital technologies in bracket manufacturing, are expected to influence the market significantly, leading to more personalized and efficient treatments. Regulatory changes and evolving patient preferences also play a role in shaping the future trajectory of the orthodontic brackets market. The market's growth trajectory is expected to be significantly influenced by these factors.
Brackets Market Report: A Comprehensive Analysis of a Multi-Million Dollar Industry (2019-2033)
This insightful report delivers a comprehensive analysis of the global Brackets market, projecting a multi-million dollar valuation by 2033. It provides a deep dive into market dynamics, competitive landscapes, and future growth opportunities, offering invaluable insights for stakeholders across the orthodontic industry. The study covers the historical period (2019-2024), the base year (2025), and offers a detailed forecast for 2025-2033. This report is essential for strategic decision-making, investment planning, and understanding the evolving landscape of the Brackets market.
Brackets Market Composition & Trends
This section evaluates the current state of the Brackets market, examining market concentration, innovation drivers, regulatory influences, substitute product analysis, end-user profiles, and merger & acquisition (M&A) activities. The analysis leverages a comprehensive dataset to provide a detailed picture of market dynamics. The total market value exceeded $xx million in 2024.
- Market Concentration: The market exhibits a moderately concentrated structure, with the top five players— Ortho Organizers (Henry Schein), Dentsply, 3M Unitek, Ormco, and Dentaurum—holding a combined market share of approximately xx%.
- Innovation Catalysts: Significant innovations in material science, 3D printing technologies, and aesthetic designs are driving market growth.
- Regulatory Landscape: Stringent regulatory approvals and safety standards impact market entry and product lifecycle management. Variations in regulations across different regions add to the complexity.
- Substitute Products: Lingual braces and clear aligners represent the primary substitute products, impacting the market share of traditional metal brackets.
- End-User Profiles: Orthodontists and dentists constitute the primary end-users, with increasing demand driven by rising prevalence of malocclusion and improved affordability.
- M&A Activities: The Brackets market has witnessed several significant M&A activities in the past five years, with total deal values exceeding $xx million. These activities have primarily focused on expanding product portfolios and geographical reach. Examples include (but are not limited to) the acquisition of xx company by xx in 2022, valued at $xx million.
Brackets Industry Evolution
This section analyzes the evolution of the Brackets market, focusing on growth trajectories, technological advancements, and changing consumer preferences. The market demonstrated robust growth between 2019 and 2024, with a Compound Annual Growth Rate (CAGR) of approximately xx%. This growth is attributed to several key factors.
The rising prevalence of malocclusion globally, fueled by changing dietary habits and increased awareness of aesthetic dental improvements, is a significant driver. Technological advancements such as the introduction of self-ligating brackets, aesthetically pleasing ceramic brackets, and advancements in materials have also contributed to market expansion. Consumer demand for less visible and more comfortable orthodontic solutions is increasing, driving innovation in bracket design and material science. Furthermore, improvements in healthcare infrastructure and rising disposable incomes, particularly in developing economies, contribute positively to market growth. The adoption rate of technologically advanced brackets is increasing at a CAGR of approximately xx%.
Leading Regions, Countries, or Segments in Brackets
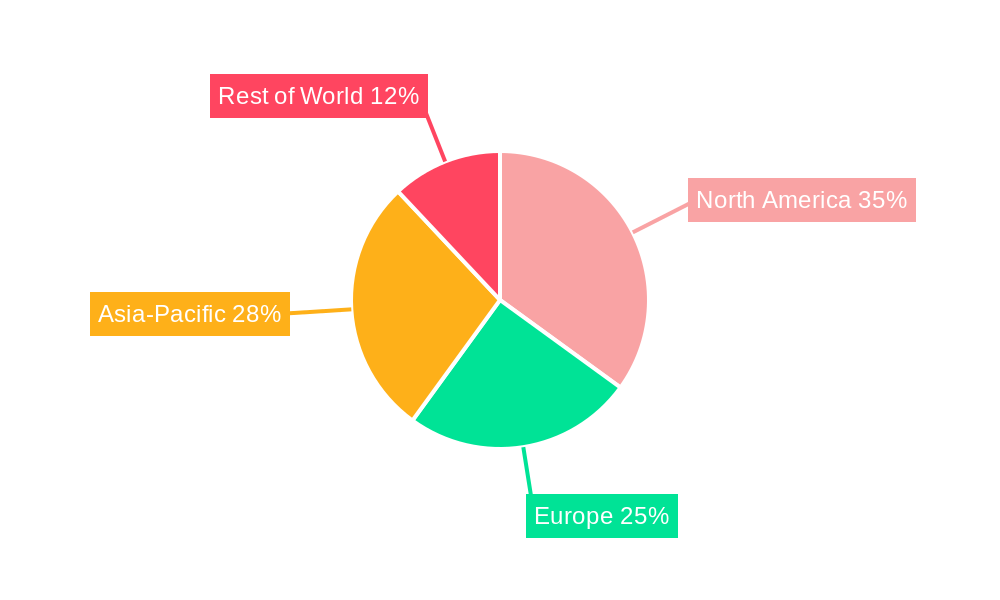
This section identifies the leading regions and segments within the Brackets market. North America currently dominates the global market, holding a significant share exceeding xx% of the global market in 2024.
- Key Drivers in North America:
- High per capita healthcare expenditure
- Strong presence of major players and established distribution networks
- High adoption of advanced orthodontic technologies
- Favorable regulatory environment
- Dominance Factors: North America's dominance stems from a combination of factors: a well-established orthodontic industry, high awareness of aesthetic dental treatments, readily available financing options, and a large patient pool. The region's robust healthcare infrastructure and considerable research and development investments also contribute significantly. Furthermore, the strong presence of major players and established distribution networks facilitate market penetration and growth.
Brackets Product Innovations
Recent innovations in Brackets encompass the development of self-ligating brackets that reduce friction and improve treatment speed, the use of biocompatible and aesthetic materials such as ceramic and sapphire, and the integration of 3D printing technology for customized bracket designs. These advancements deliver enhanced patient comfort, improved treatment outcomes, and increased treatment efficiency. Unique selling propositions often highlight superior aesthetics, reduced discomfort, and shorter treatment times.
Propelling Factors for Brackets Growth
Several factors are propelling the growth of the Brackets market. Technological advancements in materials, design, and manufacturing processes have improved the efficiency and aesthetics of orthodontic treatments. The rising prevalence of malocclusion, driven by changing dietary habits, and increased awareness of the importance of aesthetic dentistry are key drivers of market demand. Government initiatives and insurance coverage in several countries are also contributing to market expansion.
Obstacles in the Brackets Market
The Brackets market faces several challenges. Stringent regulatory requirements and safety standards can increase the cost and time required for product approval and market entry. Supply chain disruptions, particularly in raw materials procurement, can negatively impact production and availability. Intense competition among established players and the emergence of alternative orthodontic treatment options (such as clear aligners) also pose significant challenges. For example, supply chain disruptions in 2022 resulted in a xx% increase in production costs, negatively impacting profitability for many Brackets manufacturers.
Future Opportunities in Brackets
Emerging opportunities in the Brackets market include the expansion into untapped markets in developing economies, the development of smart brackets with embedded sensors for real-time treatment monitoring, and personalized orthodontic treatment plans based on advanced imaging techniques. Furthermore, the integration of artificial intelligence and machine learning in orthodontic treatment planning and execution offers significant potential.
Major Players in the Brackets Ecosystem
- Ortho Organizers (Henry Schein)
- Dentsply
- Forestadent
- American Orthodontics
- 3M Unitek
- Dentaurum
- Ormco
- Hangzhou Shinye
- Tomy
- Zhejiang Protect Medical
- Dental Morelli
- Hangzhou Xingchen 3B Dental
- ShanghaiIMD
- Hangzhou Yahong
- G&H Orthodontics
- Creative Dental
- JJ Orthodontics
Key Developments in Brackets Industry
- 2022 Q3: Introduction of a new self-ligating bracket system by 3M Unitek, focusing on improved aesthetics and reduced treatment time.
- 2023 Q1: Acquisition of a smaller bracket manufacturer by Dentsply, expanding their product portfolio.
- 2024 Q2: Launch of a new biocompatible bracket material by Ormco, emphasizing enhanced patient comfort and reduced allergic reactions. (Further developments can be added here)
Strategic Brackets Market Forecast
The Brackets market is poised for continued growth over the forecast period (2025-2033), driven by technological advancements, increasing demand for aesthetic orthodontic solutions, and expansion into new markets. The market is expected to reach a value exceeding $xx million by 2033, representing a significant growth opportunity for stakeholders. Continued innovation in materials, designs, and treatment techniques will be crucial for maintaining this growth trajectory.
Brackets Segmentation
-
1. Application
- 1.1. Conventional Orthodontic Treatment
- 1.2. Beauty
-
2. Types
- 2.1. Metal Material
- 2.2. Ceramics Material
- 2.3. Others
Brackets Segmentation By Geography
-
1. North America
- 1.1. United States
- 1.2. Canada
- 1.3. Mexico
-
2. South America
- 2.1. Brazil
- 2.2. Argentina
- 2.3. Rest of South America
-
3. Europe
- 3.1. United Kingdom
- 3.2. Germany
- 3.3. France
- 3.4. Italy
- 3.5. Spain
- 3.6. Russia
- 3.7. Benelux
- 3.8. Nordics
- 3.9. Rest of Europe
-
4. Middle East & Africa
- 4.1. Turkey
- 4.2. Israel
- 4.3. GCC
- 4.4. North Africa
- 4.5. South Africa
- 4.6. Rest of Middle East & Africa
-
5. Asia Pacific
- 5.1. China
- 5.2. India
- 5.3. Japan
- 5.4. South Korea
- 5.5. ASEAN
- 5.6. Oceania
- 5.7. Rest of Asia Pacific
Brackets REPORT HIGHLIGHTS
| Aspects | Details |
|---|---|
| Study Period | 2019-2033 |
| Base Year | 2024 |
| Estimated Year | 2025 |
| Forecast Period | 2025-2033 |
| Historical Period | 2019-2024 |
| Growth Rate | CAGR of 4.7% from 2019-2033 |
| Segmentation |
|
Table of Contents
- 1. Introduction
- 1.1. Research Scope
- 1.2. Market Segmentation
- 1.3. Research Methodology
- 1.4. Definitions and Assumptions
- 2. Executive Summary
- 2.1. Introduction
- 3. Market Dynamics
- 3.1. Introduction
- 3.2. Market Drivers
- 3.3. Market Restrains
- 3.4. Market Trends
- 4. Market Factor Analysis
- 4.1. Porters Five Forces
- 4.2. Supply/Value Chain
- 4.3. PESTEL analysis
- 4.4. Market Entropy
- 4.5. Patent/Trademark Analysis
- 5. Global Brackets Analysis, Insights and Forecast, 2019-2031
- 5.1. Market Analysis, Insights and Forecast - by Application
- 5.1.1. Conventional Orthodontic Treatment
- 5.1.2. Beauty
- 5.2. Market Analysis, Insights and Forecast - by Types
- 5.2.1. Metal Material
- 5.2.2. Ceramics Material
- 5.2.3. Others
- 5.3. Market Analysis, Insights and Forecast - by Region
- 5.3.1. North America
- 5.3.2. South America
- 5.3.3. Europe
- 5.3.4. Middle East & Africa
- 5.3.5. Asia Pacific
- 5.1. Market Analysis, Insights and Forecast - by Application
- 6. North America Brackets Analysis, Insights and Forecast, 2019-2031
- 6.1. Market Analysis, Insights and Forecast - by Application
- 6.1.1. Conventional Orthodontic Treatment
- 6.1.2. Beauty
- 6.2. Market Analysis, Insights and Forecast - by Types
- 6.2.1. Metal Material
- 6.2.2. Ceramics Material
- 6.2.3. Others
- 6.1. Market Analysis, Insights and Forecast - by Application
- 7. South America Brackets Analysis, Insights and Forecast, 2019-2031
- 7.1. Market Analysis, Insights and Forecast - by Application
- 7.1.1. Conventional Orthodontic Treatment
- 7.1.2. Beauty
- 7.2. Market Analysis, Insights and Forecast - by Types
- 7.2.1. Metal Material
- 7.2.2. Ceramics Material
- 7.2.3. Others
- 7.1. Market Analysis, Insights and Forecast - by Application
- 8. Europe Brackets Analysis, Insights and Forecast, 2019-2031
- 8.1. Market Analysis, Insights and Forecast - by Application
- 8.1.1. Conventional Orthodontic Treatment
- 8.1.2. Beauty
- 8.2. Market Analysis, Insights and Forecast - by Types
- 8.2.1. Metal Material
- 8.2.2. Ceramics Material
- 8.2.3. Others
- 8.1. Market Analysis, Insights and Forecast - by Application
- 9. Middle East & Africa Brackets Analysis, Insights and Forecast, 2019-2031
- 9.1. Market Analysis, Insights and Forecast - by Application
- 9.1.1. Conventional Orthodontic Treatment
- 9.1.2. Beauty
- 9.2. Market Analysis, Insights and Forecast - by Types
- 9.2.1. Metal Material
- 9.2.2. Ceramics Material
- 9.2.3. Others
- 9.1. Market Analysis, Insights and Forecast - by Application
- 10. Asia Pacific Brackets Analysis, Insights and Forecast, 2019-2031
- 10.1. Market Analysis, Insights and Forecast - by Application
- 10.1.1. Conventional Orthodontic Treatment
- 10.1.2. Beauty
- 10.2. Market Analysis, Insights and Forecast - by Types
- 10.2.1. Metal Material
- 10.2.2. Ceramics Material
- 10.2.3. Others
- 10.1. Market Analysis, Insights and Forecast - by Application
- 11. Competitive Analysis
- 11.1. Global Market Share Analysis 2024
- 11.2. Company Profiles
- 11.2.1 Ortho Organizers (Henry Schein)
- 11.2.1.1. Overview
- 11.2.1.2. Products
- 11.2.1.3. SWOT Analysis
- 11.2.1.4. Recent Developments
- 11.2.1.5. Financials (Based on Availability)
- 11.2.2 Dentsply
- 11.2.2.1. Overview
- 11.2.2.2. Products
- 11.2.2.3. SWOT Analysis
- 11.2.2.4. Recent Developments
- 11.2.2.5. Financials (Based on Availability)
- 11.2.3 Forestadent
- 11.2.3.1. Overview
- 11.2.3.2. Products
- 11.2.3.3. SWOT Analysis
- 11.2.3.4. Recent Developments
- 11.2.3.5. Financials (Based on Availability)
- 11.2.4 American Orthodontics
- 11.2.4.1. Overview
- 11.2.4.2. Products
- 11.2.4.3. SWOT Analysis
- 11.2.4.4. Recent Developments
- 11.2.4.5. Financials (Based on Availability)
- 11.2.5 3M Unitek
- 11.2.5.1. Overview
- 11.2.5.2. Products
- 11.2.5.3. SWOT Analysis
- 11.2.5.4. Recent Developments
- 11.2.5.5. Financials (Based on Availability)
- 11.2.6 Dentaurum
- 11.2.6.1. Overview
- 11.2.6.2. Products
- 11.2.6.3. SWOT Analysis
- 11.2.6.4. Recent Developments
- 11.2.6.5. Financials (Based on Availability)
- 11.2.7 Ormco
- 11.2.7.1. Overview
- 11.2.7.2. Products
- 11.2.7.3. SWOT Analysis
- 11.2.7.4. Recent Developments
- 11.2.7.5. Financials (Based on Availability)
- 11.2.8 Hangzhou Shinye
- 11.2.8.1. Overview
- 11.2.8.2. Products
- 11.2.8.3. SWOT Analysis
- 11.2.8.4. Recent Developments
- 11.2.8.5. Financials (Based on Availability)
- 11.2.9 Tomy
- 11.2.9.1. Overview
- 11.2.9.2. Products
- 11.2.9.3. SWOT Analysis
- 11.2.9.4. Recent Developments
- 11.2.9.5. Financials (Based on Availability)
- 11.2.10 Zhejiang Protect Medical
- 11.2.10.1. Overview
- 11.2.10.2. Products
- 11.2.10.3. SWOT Analysis
- 11.2.10.4. Recent Developments
- 11.2.10.5. Financials (Based on Availability)
- 11.2.11 Dental Morelli
- 11.2.11.1. Overview
- 11.2.11.2. Products
- 11.2.11.3. SWOT Analysis
- 11.2.11.4. Recent Developments
- 11.2.11.5. Financials (Based on Availability)
- 11.2.12 Hangzhou Xingchen 3B Dental
- 11.2.12.1. Overview
- 11.2.12.2. Products
- 11.2.12.3. SWOT Analysis
- 11.2.12.4. Recent Developments
- 11.2.12.5. Financials (Based on Availability)
- 11.2.13 ShanghaiIMD
- 11.2.13.1. Overview
- 11.2.13.2. Products
- 11.2.13.3. SWOT Analysis
- 11.2.13.4. Recent Developments
- 11.2.13.5. Financials (Based on Availability)
- 11.2.14 Hangzhou Yahong
- 11.2.14.1. Overview
- 11.2.14.2. Products
- 11.2.14.3. SWOT Analysis
- 11.2.14.4. Recent Developments
- 11.2.14.5. Financials (Based on Availability)
- 11.2.15 G&H Orthodontics
- 11.2.15.1. Overview
- 11.2.15.2. Products
- 11.2.15.3. SWOT Analysis
- 11.2.15.4. Recent Developments
- 11.2.15.5. Financials (Based on Availability)
- 11.2.16 Creative Dental
- 11.2.16.1. Overview
- 11.2.16.2. Products
- 11.2.16.3. SWOT Analysis
- 11.2.16.4. Recent Developments
- 11.2.16.5. Financials (Based on Availability)
- 11.2.17 JJ Orthodontics
- 11.2.17.1. Overview
- 11.2.17.2. Products
- 11.2.17.3. SWOT Analysis
- 11.2.17.4. Recent Developments
- 11.2.17.5. Financials (Based on Availability)
- 11.2.1 Ortho Organizers (Henry Schein)
List of Figures
- Figure 1: Global Brackets Revenue Breakdown (million, %) by Region 2024 & 2032
- Figure 2: Global Brackets Volume Breakdown (K, %) by Region 2024 & 2032
- Figure 3: North America Brackets Revenue (million), by Application 2024 & 2032
- Figure 4: North America Brackets Volume (K), by Application 2024 & 2032
- Figure 5: North America Brackets Revenue Share (%), by Application 2024 & 2032
- Figure 6: North America Brackets Volume Share (%), by Application 2024 & 2032
- Figure 7: North America Brackets Revenue (million), by Types 2024 & 2032
- Figure 8: North America Brackets Volume (K), by Types 2024 & 2032
- Figure 9: North America Brackets Revenue Share (%), by Types 2024 & 2032
- Figure 10: North America Brackets Volume Share (%), by Types 2024 & 2032
- Figure 11: North America Brackets Revenue (million), by Country 2024 & 2032
- Figure 12: North America Brackets Volume (K), by Country 2024 & 2032
- Figure 13: North America Brackets Revenue Share (%), by Country 2024 & 2032
- Figure 14: North America Brackets Volume Share (%), by Country 2024 & 2032
- Figure 15: South America Brackets Revenue (million), by Application 2024 & 2032
- Figure 16: South America Brackets Volume (K), by Application 2024 & 2032
- Figure 17: South America Brackets Revenue Share (%), by Application 2024 & 2032
- Figure 18: South America Brackets Volume Share (%), by Application 2024 & 2032
- Figure 19: South America Brackets Revenue (million), by Types 2024 & 2032
- Figure 20: South America Brackets Volume (K), by Types 2024 & 2032
- Figure 21: South America Brackets Revenue Share (%), by Types 2024 & 2032
- Figure 22: South America Brackets Volume Share (%), by Types 2024 & 2032
- Figure 23: South America Brackets Revenue (million), by Country 2024 & 2032
- Figure 24: South America Brackets Volume (K), by Country 2024 & 2032
- Figure 25: South America Brackets Revenue Share (%), by Country 2024 & 2032
- Figure 26: South America Brackets Volume Share (%), by Country 2024 & 2032
- Figure 27: Europe Brackets Revenue (million), by Application 2024 & 2032
- Figure 28: Europe Brackets Volume (K), by Application 2024 & 2032
- Figure 29: Europe Brackets Revenue Share (%), by Application 2024 & 2032
- Figure 30: Europe Brackets Volume Share (%), by Application 2024 & 2032
- Figure 31: Europe Brackets Revenue (million), by Types 2024 & 2032
- Figure 32: Europe Brackets Volume (K), by Types 2024 & 2032
- Figure 33: Europe Brackets Revenue Share (%), by Types 2024 & 2032
- Figure 34: Europe Brackets Volume Share (%), by Types 2024 & 2032
- Figure 35: Europe Brackets Revenue (million), by Country 2024 & 2032
- Figure 36: Europe Brackets Volume (K), by Country 2024 & 2032
- Figure 37: Europe Brackets Revenue Share (%), by Country 2024 & 2032
- Figure 38: Europe Brackets Volume Share (%), by Country 2024 & 2032
- Figure 39: Middle East & Africa Brackets Revenue (million), by Application 2024 & 2032
- Figure 40: Middle East & Africa Brackets Volume (K), by Application 2024 & 2032
- Figure 41: Middle East & Africa Brackets Revenue Share (%), by Application 2024 & 2032
- Figure 42: Middle East & Africa Brackets Volume Share (%), by Application 2024 & 2032
- Figure 43: Middle East & Africa Brackets Revenue (million), by Types 2024 & 2032
- Figure 44: Middle East & Africa Brackets Volume (K), by Types 2024 & 2032
- Figure 45: Middle East & Africa Brackets Revenue Share (%), by Types 2024 & 2032
- Figure 46: Middle East & Africa Brackets Volume Share (%), by Types 2024 & 2032
- Figure 47: Middle East & Africa Brackets Revenue (million), by Country 2024 & 2032
- Figure 48: Middle East & Africa Brackets Volume (K), by Country 2024 & 2032
- Figure 49: Middle East & Africa Brackets Revenue Share (%), by Country 2024 & 2032
- Figure 50: Middle East & Africa Brackets Volume Share (%), by Country 2024 & 2032
- Figure 51: Asia Pacific Brackets Revenue (million), by Application 2024 & 2032
- Figure 52: Asia Pacific Brackets Volume (K), by Application 2024 & 2032
- Figure 53: Asia Pacific Brackets Revenue Share (%), by Application 2024 & 2032
- Figure 54: Asia Pacific Brackets Volume Share (%), by Application 2024 & 2032
- Figure 55: Asia Pacific Brackets Revenue (million), by Types 2024 & 2032
- Figure 56: Asia Pacific Brackets Volume (K), by Types 2024 & 2032
- Figure 57: Asia Pacific Brackets Revenue Share (%), by Types 2024 & 2032
- Figure 58: Asia Pacific Brackets Volume Share (%), by Types 2024 & 2032
- Figure 59: Asia Pacific Brackets Revenue (million), by Country 2024 & 2032
- Figure 60: Asia Pacific Brackets Volume (K), by Country 2024 & 2032
- Figure 61: Asia Pacific Brackets Revenue Share (%), by Country 2024 & 2032
- Figure 62: Asia Pacific Brackets Volume Share (%), by Country 2024 & 2032
List of Tables
- Table 1: Global Brackets Revenue million Forecast, by Region 2019 & 2032
- Table 2: Global Brackets Volume K Forecast, by Region 2019 & 2032
- Table 3: Global Brackets Revenue million Forecast, by Application 2019 & 2032
- Table 4: Global Brackets Volume K Forecast, by Application 2019 & 2032
- Table 5: Global Brackets Revenue million Forecast, by Types 2019 & 2032
- Table 6: Global Brackets Volume K Forecast, by Types 2019 & 2032
- Table 7: Global Brackets Revenue million Forecast, by Region 2019 & 2032
- Table 8: Global Brackets Volume K Forecast, by Region 2019 & 2032
- Table 9: Global Brackets Revenue million Forecast, by Application 2019 & 2032
- Table 10: Global Brackets Volume K Forecast, by Application 2019 & 2032
- Table 11: Global Brackets Revenue million Forecast, by Types 2019 & 2032
- Table 12: Global Brackets Volume K Forecast, by Types 2019 & 2032
- Table 13: Global Brackets Revenue million Forecast, by Country 2019 & 2032
- Table 14: Global Brackets Volume K Forecast, by Country 2019 & 2032
- Table 15: United States Brackets Revenue (million) Forecast, by Application 2019 & 2032
- Table 16: United States Brackets Volume (K) Forecast, by Application 2019 & 2032
- Table 17: Canada Brackets Revenue (million) Forecast, by Application 2019 & 2032
- Table 18: Canada Brackets Volume (K) Forecast, by Application 2019 & 2032
- Table 19: Mexico Brackets Revenue (million) Forecast, by Application 2019 & 2032
- Table 20: Mexico Brackets Volume (K) Forecast, by Application 2019 & 2032
- Table 21: Global Brackets Revenue million Forecast, by Application 2019 & 2032
- Table 22: Global Brackets Volume K Forecast, by Application 2019 & 2032
- Table 23: Global Brackets Revenue million Forecast, by Types 2019 & 2032
- Table 24: Global Brackets Volume K Forecast, by Types 2019 & 2032
- Table 25: Global Brackets Revenue million Forecast, by Country 2019 & 2032
- Table 26: Global Brackets Volume K Forecast, by Country 2019 & 2032
- Table 27: Brazil Brackets Revenue (million) Forecast, by Application 2019 & 2032
- Table 28: Brazil Brackets Volume (K) Forecast, by Application 2019 & 2032
- Table 29: Argentina Brackets Revenue (million) Forecast, by Application 2019 & 2032
- Table 30: Argentina Brackets Volume (K) Forecast, by Application 2019 & 2032
- Table 31: Rest of South America Brackets Revenue (million) Forecast, by Application 2019 & 2032
- Table 32: Rest of South America Brackets Volume (K) Forecast, by Application 2019 & 2032
- Table 33: Global Brackets Revenue million Forecast, by Application 2019 & 2032
- Table 34: Global Brackets Volume K Forecast, by Application 2019 & 2032
- Table 35: Global Brackets Revenue million Forecast, by Types 2019 & 2032
- Table 36: Global Brackets Volume K Forecast, by Types 2019 & 2032
- Table 37: Global Brackets Revenue million Forecast, by Country 2019 & 2032
- Table 38: Global Brackets Volume K Forecast, by Country 2019 & 2032
- Table 39: United Kingdom Brackets Revenue (million) Forecast, by Application 2019 & 2032
- Table 40: United Kingdom Brackets Volume (K) Forecast, by Application 2019 & 2032
- Table 41: Germany Brackets Revenue (million) Forecast, by Application 2019 & 2032
- Table 42: Germany Brackets Volume (K) Forecast, by Application 2019 & 2032
- Table 43: France Brackets Revenue (million) Forecast, by Application 2019 & 2032
- Table 44: France Brackets Volume (K) Forecast, by Application 2019 & 2032
- Table 45: Italy Brackets Revenue (million) Forecast, by Application 2019 & 2032
- Table 46: Italy Brackets Volume (K) Forecast, by Application 2019 & 2032
- Table 47: Spain Brackets Revenue (million) Forecast, by Application 2019 & 2032
- Table 48: Spain Brackets Volume (K) Forecast, by Application 2019 & 2032
- Table 49: Russia Brackets Revenue (million) Forecast, by Application 2019 & 2032
- Table 50: Russia Brackets Volume (K) Forecast, by Application 2019 & 2032
- Table 51: Benelux Brackets Revenue (million) Forecast, by Application 2019 & 2032
- Table 52: Benelux Brackets Volume (K) Forecast, by Application 2019 & 2032
- Table 53: Nordics Brackets Revenue (million) Forecast, by Application 2019 & 2032
- Table 54: Nordics Brackets Volume (K) Forecast, by Application 2019 & 2032
- Table 55: Rest of Europe Brackets Revenue (million) Forecast, by Application 2019 & 2032
- Table 56: Rest of Europe Brackets Volume (K) Forecast, by Application 2019 & 2032
- Table 57: Global Brackets Revenue million Forecast, by Application 2019 & 2032
- Table 58: Global Brackets Volume K Forecast, by Application 2019 & 2032
- Table 59: Global Brackets Revenue million Forecast, by Types 2019 & 2032
- Table 60: Global Brackets Volume K Forecast, by Types 2019 & 2032
- Table 61: Global Brackets Revenue million Forecast, by Country 2019 & 2032
- Table 62: Global Brackets Volume K Forecast, by Country 2019 & 2032
- Table 63: Turkey Brackets Revenue (million) Forecast, by Application 2019 & 2032
- Table 64: Turkey Brackets Volume (K) Forecast, by Application 2019 & 2032
- Table 65: Israel Brackets Revenue (million) Forecast, by Application 2019 & 2032
- Table 66: Israel Brackets Volume (K) Forecast, by Application 2019 & 2032
- Table 67: GCC Brackets Revenue (million) Forecast, by Application 2019 & 2032
- Table 68: GCC Brackets Volume (K) Forecast, by Application 2019 & 2032
- Table 69: North Africa Brackets Revenue (million) Forecast, by Application 2019 & 2032
- Table 70: North Africa Brackets Volume (K) Forecast, by Application 2019 & 2032
- Table 71: South Africa Brackets Revenue (million) Forecast, by Application 2019 & 2032
- Table 72: South Africa Brackets Volume (K) Forecast, by Application 2019 & 2032
- Table 73: Rest of Middle East & Africa Brackets Revenue (million) Forecast, by Application 2019 & 2032
- Table 74: Rest of Middle East & Africa Brackets Volume (K) Forecast, by Application 2019 & 2032
- Table 75: Global Brackets Revenue million Forecast, by Application 2019 & 2032
- Table 76: Global Brackets Volume K Forecast, by Application 2019 & 2032
- Table 77: Global Brackets Revenue million Forecast, by Types 2019 & 2032
- Table 78: Global Brackets Volume K Forecast, by Types 2019 & 2032
- Table 79: Global Brackets Revenue million Forecast, by Country 2019 & 2032
- Table 80: Global Brackets Volume K Forecast, by Country 2019 & 2032
- Table 81: China Brackets Revenue (million) Forecast, by Application 2019 & 2032
- Table 82: China Brackets Volume (K) Forecast, by Application 2019 & 2032
- Table 83: India Brackets Revenue (million) Forecast, by Application 2019 & 2032
- Table 84: India Brackets Volume (K) Forecast, by Application 2019 & 2032
- Table 85: Japan Brackets Revenue (million) Forecast, by Application 2019 & 2032
- Table 86: Japan Brackets Volume (K) Forecast, by Application 2019 & 2032
- Table 87: South Korea Brackets Revenue (million) Forecast, by Application 2019 & 2032
- Table 88: South Korea Brackets Volume (K) Forecast, by Application 2019 & 2032
- Table 89: ASEAN Brackets Revenue (million) Forecast, by Application 2019 & 2032
- Table 90: ASEAN Brackets Volume (K) Forecast, by Application 2019 & 2032
- Table 91: Oceania Brackets Revenue (million) Forecast, by Application 2019 & 2032
- Table 92: Oceania Brackets Volume (K) Forecast, by Application 2019 & 2032
- Table 93: Rest of Asia Pacific Brackets Revenue (million) Forecast, by Application 2019 & 2032
- Table 94: Rest of Asia Pacific Brackets Volume (K) Forecast, by Application 2019 & 2032
Frequently Asked Questions
1. What is the projected Compound Annual Growth Rate (CAGR) of the Brackets?
The projected CAGR is approximately 4.7%.
2. Which companies are prominent players in the Brackets?
Key companies in the market include Ortho Organizers (Henry Schein), Dentsply, Forestadent, American Orthodontics, 3M Unitek, Dentaurum, Ormco, Hangzhou Shinye, Tomy, Zhejiang Protect Medical, Dental Morelli, Hangzhou Xingchen 3B Dental, ShanghaiIMD, Hangzhou Yahong, G&H Orthodontics, Creative Dental, JJ Orthodontics.
3. What are the main segments of the Brackets?
The market segments include Application, Types.
4. Can you provide details about the market size?
The market size is estimated to be USD 90 million as of 2022.
5. What are some drivers contributing to market growth?
N/A
6. What are the notable trends driving market growth?
N/A
7. Are there any restraints impacting market growth?
N/A
8. Can you provide examples of recent developments in the market?
N/A
9. What pricing options are available for accessing the report?
Pricing options include single-user, multi-user, and enterprise licenses priced at USD 3950.00, USD 5925.00, and USD 7900.00 respectively.
10. Is the market size provided in terms of value or volume?
The market size is provided in terms of value, measured in million and volume, measured in K.
11. Are there any specific market keywords associated with the report?
Yes, the market keyword associated with the report is "Brackets," which aids in identifying and referencing the specific market segment covered.
12. How do I determine which pricing option suits my needs best?
The pricing options vary based on user requirements and access needs. Individual users may opt for single-user licenses, while businesses requiring broader access may choose multi-user or enterprise licenses for cost-effective access to the report.
13. Are there any additional resources or data provided in the Brackets report?
While the report offers comprehensive insights, it's advisable to review the specific contents or supplementary materials provided to ascertain if additional resources or data are available.
14. How can I stay updated on further developments or reports in the Brackets?
To stay informed about further developments, trends, and reports in the Brackets, consider subscribing to industry newsletters, following relevant companies and organizations, or regularly checking reputable industry news sources and publications.
Methodology
Step 1 - Identification of Relevant Samples Size from Population Database


Step 2 - Approaches for Defining Global Market Size (Value, Volume* & Price*)

Note*: In applicable scenarios
Step 3 - Data Sources
Primary Research
- Web Analytics
- Survey Reports
- Research Institute
- Latest Research Reports
- Opinion Leaders
Secondary Research
- Annual Reports
- White Paper
- Latest Press Release
- Industry Association
- Paid Database
- Investor Presentations

Step 4 - Data Triangulation
Involves using different sources of information in order to increase the validity of a study
These sources are likely to be stakeholders in a program - participants, other researchers, program staff, other community members, and so on.
Then we put all data in single framework & apply various statistical tools to find out the dynamic on the market.
During the analysis stage, feedback from the stakeholder groups would be compared to determine areas of agreement as well as areas of divergence
