

Key Insights
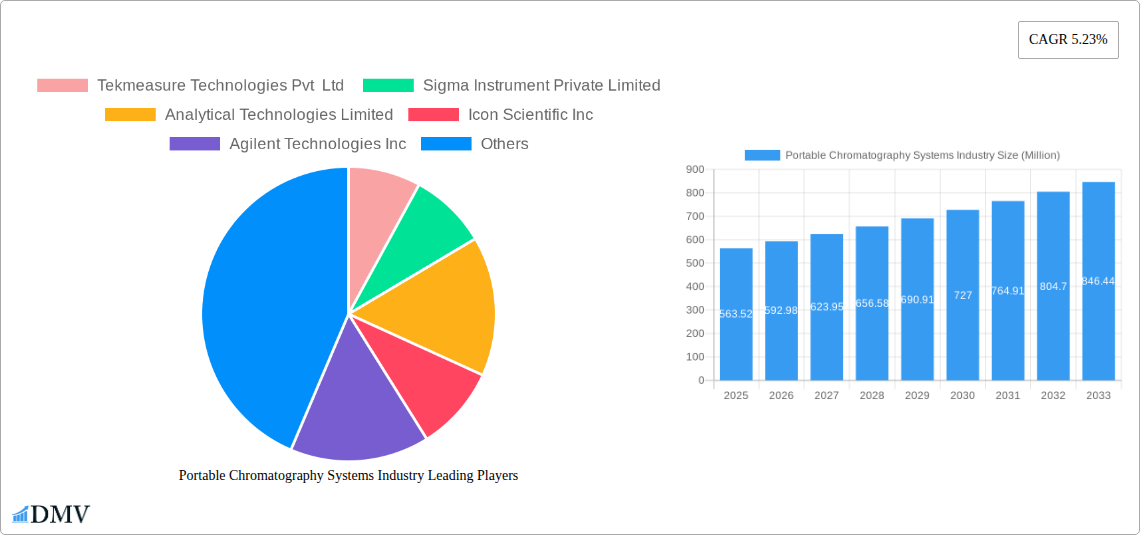
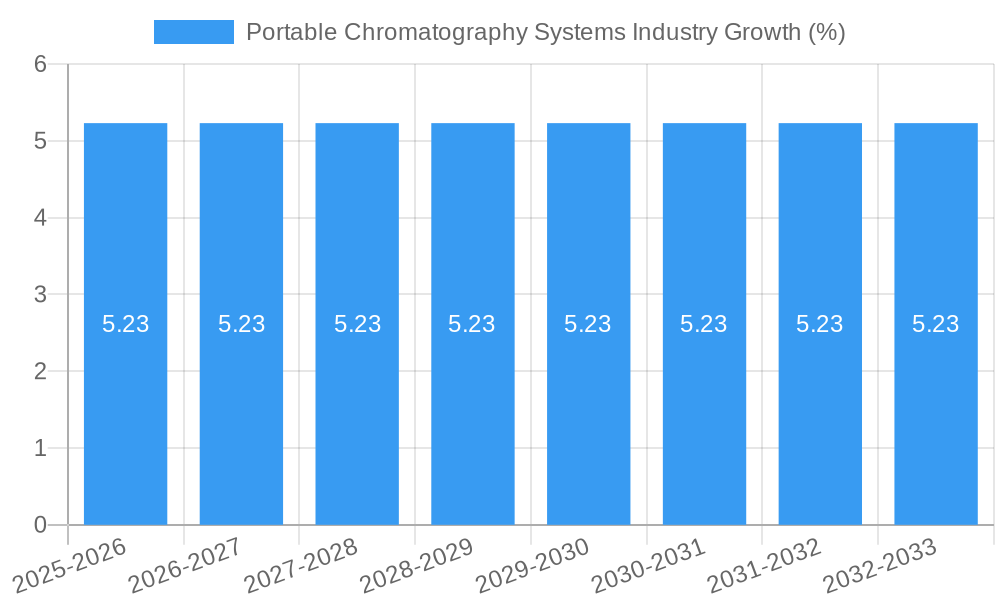
The global Portable Chromatography Systems market is poised for robust growth, projected to reach a substantial USD 563.52 million in the estimated year of 2025 and expand at a healthy Compound Annual Growth Rate (CAGR) of 5.23% through 2033. This dynamic expansion is underpinned by several key drivers, primarily the increasing demand for rapid and on-site analysis across diverse industries. The burgeoning biotechnology and pharmaceutical sectors are significant contributors, leveraging these portable systems for quality control, process monitoring, and drug discovery, where real-time data is paramount. Furthermore, the growing emphasis on environmental monitoring and safety regulations globally necessitates mobile analytical solutions that can detect contaminants and pollutants in situ. The trend towards miniaturization and enhanced sensitivity in chromatography technology is also fueling market adoption.
The market segmentation reveals a strong focus on Person Portable devices, indicating a preference for highly mobile and user-friendly solutions. Within the types of systems, both Portable Gas Chromatography Systems and Portable Liquid Chromatography Systems are expected to witness significant uptake, catering to different analytical needs. Research laboratories, alongside biotechnology and pharmaceutical companies, are identified as key end-users, reflecting the critical role of portable chromatography in R&D activities and stringent quality assurance. While the market benefits from these drivers, potential restraints such as the initial cost of advanced portable systems and the need for skilled operators could pose challenges. However, ongoing technological advancements and increasing awareness of the benefits of portable analysis are expected to outweigh these limitations, ensuring sustained market development.
Portable Chromatography Systems Industry Market Analysis: 2019-2033
This comprehensive report offers an in-depth analysis of the global Portable Chromatography Systems Industry, meticulously examining market dynamics, technological advancements, and growth prospects from 2019 to 2033. With a base year of 2025 and a forecast period extending to 2033, this report provides actionable insights for stakeholders navigating this rapidly evolving sector. The Portable Chromatography Systems Market is poised for significant expansion, driven by increasing demand for on-site analysis and real-time data acquisition across diverse applications.
Portable Chromatography Systems Industry Market Composition & Trends
The Portable Chromatography Systems Market exhibits a dynamic composition influenced by technological innovation, evolving regulatory frameworks, and the strategic maneuvers of key industry players. Market concentration is moderately fragmented, with a few dominant players holding substantial market share, while a growing number of niche providers are emerging. Innovation catalysts are primarily centered around miniaturization, enhanced sensitivity, improved user-friendliness, and the integration of advanced data processing capabilities. Regulatory landscapes, particularly in the pharmaceutical and environmental monitoring sectors, are a significant influence, often mandating precise and portable analytical solutions. Substitute products, while present in the form of traditional benchtop systems, are increasingly being challenged by the convenience and cost-effectiveness of portable chromatography. End-user profiles reveal a strong demand from Biotechnology and Pharmaceutical Companies and Research Laboratories, where on-site analysis is crucial for drug discovery, quality control, and research. Others segments, including environmental testing and food safety, are also showing robust growth. Mergers and acquisitions (M&A) activities are prevalent, with deal values in the Portable Chromatography Systems Market projected to reach $500 Million by the forecast period, driven by the desire for market consolidation, technology acquisition, and expanded geographical reach.
- Market Share Distribution (Estimated Base Year 2025):
- Leading Players: 60%
- Mid-Tier Companies: 25%
- Emerging Players: 15%
- M&A Deal Values (Projected Forecast Period 2025-2033): $500 Million (Cumulative)
Portable Chromatography Systems Industry Industry Evolution
The Portable Chromatography Systems Industry has undergone a remarkable evolution, transforming from niche analytical tools to indispensable components in a wide array of scientific and industrial processes. The historical period (2019-2024) witnessed significant strides in miniaturization and increased portability, laying the groundwork for the current growth trajectory. Market growth has been consistently upward, fueled by the intrinsic advantages of portable solutions, such as reduced sample turnaround times, on-site analysis capabilities, and minimized sample degradation. The Portable Chromatography Systems Market experienced a CAGR of approximately 8.5% during the historical period. Technological advancements have been a primary driver, with the development of microfluidic chips, advanced sensor technologies, and more efficient detection methods. These innovations have not only improved performance but also made portable systems more accessible and cost-effective. Shifting consumer demands are a critical factor, with a growing emphasis on real-time data, decentralized testing, and the ability to conduct complex analyses outside traditional laboratory settings. This trend is particularly evident in the Biotechnology and Pharmaceutical Companies segment, where the need for rapid quality control and process monitoring is paramount. The adoption of Portable Gas Chromatography Systems and Portable Liquid Chromatography Systems has surged as industries recognize their ability to deliver immediate, reliable results. The estimated market size for 2025 is projected to be $3.5 Billion, with a projected CAGR of 9.2% for the forecast period (2025-2033).
- Historical CAGR (2019-2024): 8.5%
- Estimated Market Size (2025): $3.5 Billion
- Projected CAGR (2025-2033): 9.2%
- Adoption Metrics (Key Segments):
- Biotechnology & Pharmaceutical: 85% increase in adoption from 2020 to 2024.
- Research Laboratories: 70% increase in adoption from 2020 to 2024.
Leading Regions, Countries, or Segments in Portable Chromatography Systems Industry
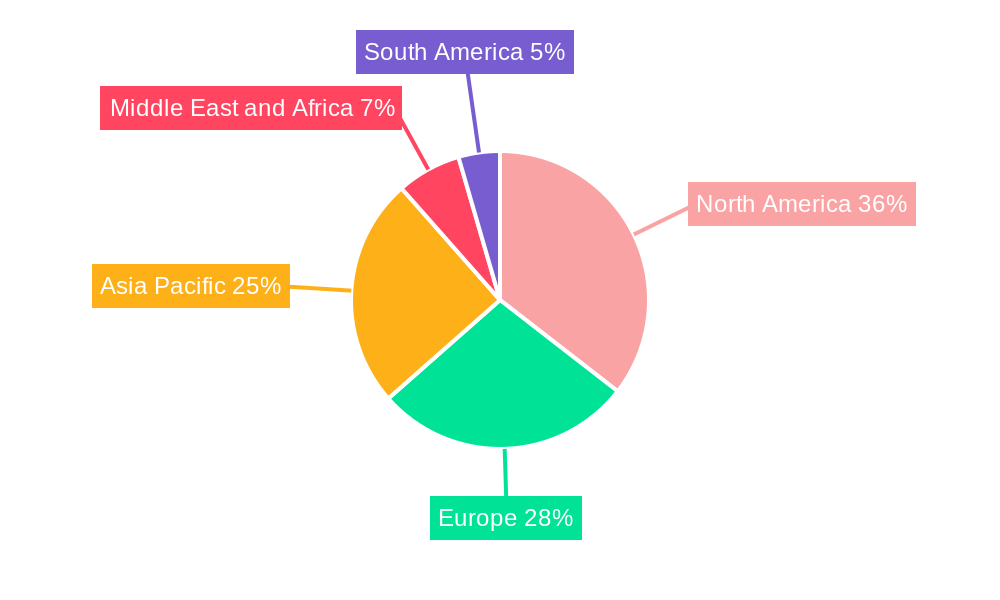
The dominance within the Portable Chromatography Systems Industry is clearly observed in North America, driven by a confluence of factors including substantial investments in R&D, a robust presence of leading Biotechnology and Pharmaceutical Companies, and stringent regulatory requirements for environmental and food safety monitoring. The United States, in particular, leads the market due to its advanced technological infrastructure and high disposable income for research and development activities. The Portable Liquid Chromatography Systems segment is experiencing particularly rapid growth within this region, owing to its versatility in analyzing a broad spectrum of chemical compounds crucial for drug development and medical diagnostics. The Person Portable category within Portability also showcases significant traction, enabling field scientists and technicians to conduct on-site analyses without compromising accuracy.
- Dominant Region: North America
- Key Driver: R&D Investment: Estimated annual R&D investment in the US for chromatography technologies is $800 Million.
- Key Driver: Regulatory Support: Favorable regulatory policies for environmental monitoring and drug safety analysis.
- Key Driver: Pharmaceutical & Biotechnology Sector: A substantial number of major pharmaceutical companies headquartered in the region with a high demand for portable solutions.
- Dominant Country: United States
- Market Size Contribution (2025 Estimate): 40% of global market revenue.
- Growth Rate (Forecast Period): Projected CAGR of 9.5%.
- Dominant Segment (Type): Portable Liquid Chromatography Systems
- Market Share (2025 Estimate): 55% of the total portable chromatography systems market.
- Key Application: Pharmaceutical quality control, environmental testing, food and beverage analysis.
- Dominant Segment (Portability): Person Portable
- Market Share (2025 Estimate): 65% of the portable systems market.
- Key Benefit: Unmatched convenience for field applications and remote monitoring.
- Dominant Segment (End-User): Biotechnology and Pharmaceutical Companies
- Market Share (2025 Estimate): 50% of the total end-user market.
- Impact: Driving demand for precision, speed, and reliability in analysis.
Portable Chromatography Systems Industry Product Innovations
Product innovation in the Portable Chromatography Systems Market is characterized by a relentless pursuit of miniaturization, enhanced sensitivity, and user-centric design. Recent advancements include the development of battery-powered, handheld devices capable of performing complex separations and detections in minutes, eliminating the need for extensive sample preparation. These innovations are crucial for field-based applications in environmental monitoring and disaster response. Portable Gas Chromatography Systems are now incorporating advanced detectors like Photoionization Detectors (PIDs) and Flame Ionization Detectors (FIDs) for broader analyte detection, while Portable Liquid Chromatography Systems are benefiting from microfluidic technologies that reduce solvent consumption and improve separation efficiency. Unique selling propositions include real-time data transmission via cloud connectivity, enabling immediate decision-making and remote collaboration.
Propelling Factors for Portable Chromatography Systems Industry Growth
Several key factors are propelling the growth of the Portable Chromatography Systems Industry. The increasing need for rapid, on-site analysis in sectors like environmental monitoring, food safety, and homeland security is a significant driver. Technological advancements, such as miniaturization and improved sensor technology, are making these systems more accessible, accurate, and cost-effective. Furthermore, the growing prevalence of point-of-need testing in the biotechnology and pharmaceutical industries, particularly for quality control and drug discovery, is creating substantial demand. Favorable regulatory policies that emphasize on-site verification and compliance also contribute to market expansion.
- Technological Advancements: Miniaturization, improved detectors, and software integration.
- Economic Factors: Reduced operational costs compared to traditional lab setups.
- Regulatory Influences: Mandates for on-site testing and real-time monitoring.
- Growing Demand: For decentralized analysis in pharmaceuticals, environmental, and food safety.
Obstacles in the Portable Chromatography Systems Industry Market
Despite the robust growth, the Portable Chromatography Systems Industry faces certain obstacles. High initial investment costs for sophisticated portable systems can be a barrier for smaller organizations. The need for specialized training to operate and maintain these advanced instruments can also limit widespread adoption. Stringent regulatory approvals for new technologies in certain sectors, particularly healthcare, can cause delays in market entry. Furthermore, supply chain disruptions, as experienced globally in recent years, can impact the availability of critical components, leading to production delays and increased costs. The competitive landscape, with numerous players vying for market share, also presents challenges.
- High Initial Investment: Premium pricing for advanced portable units.
- Technical Expertise: Requirement for specialized training for operation and maintenance.
- Regulatory Hurdles: Lengthy approval processes in sensitive industries.
- Supply Chain Vulnerabilities: Dependence on global component sourcing.
Future Opportunities in Portable Chromatography Systems Industry
The Portable Chromatography Systems Industry is brimming with future opportunities. The growing demand for environmental monitoring in developing nations presents a significant untapped market. Advancements in artificial intelligence (AI) and machine learning (ML) can be integrated into portable systems for enhanced data interpretation and predictive analysis. The development of more versatile, multi-functional portable devices capable of performing a wider range of analytical tasks will open new application areas. Furthermore, strategic partnerships between technology providers and end-user industries can accelerate the adoption and customization of portable chromatography solutions for specific needs.
- Emerging Markets: Expanding applications in developing economies.
- Technological Integration: AI and ML for advanced data analytics.
- New Applications: Multi-functional devices for diverse analytical needs.
- Strategic Alliances: Collaborations for customized solutions.
Major Players in the Portable Chromatography Systems Industry Ecosystem
- Tekmeasure Technologies Pvt Ltd
- Sigma Instrument Private Limited
- Analytical Technologies Limited
- Icon Scientific Inc
- Agilent Technologies Inc
- PerkinElmer Inc
- INFICON
- Axcend
- FLIR Systems Inc
Key Developments in Portable Chromatography Systems Industry Industry
- 2023/06: Agilent Technologies Inc. launched a new generation of handheld GC/MS systems, enhancing field detection capabilities for environmental pollutants.
- 2023/09: Axcend introduced an ultra-portable HPLC system designed for rapid on-site analysis in pharmaceutical quality control, significantly reducing analysis time.
- 2024/01: PerkinElmer Inc. announced a strategic partnership with a leading biotechnology firm to develop customized portable GC systems for bioprocessing applications.
- 2024/03: INFICON expanded its portable mass spectrometry portfolio with advanced sensors for leak detection in industrial settings, improving efficiency and safety.
- 2024/07: Sigma Instrument Private Limited unveiled a compact, portable ion chromatography system for water quality monitoring, offering enhanced accuracy and ease of use.
Strategic Portable Chromatography Systems Industry Market Forecast
The strategic outlook for the Portable Chromatography Systems Industry is exceptionally bright, driven by ongoing technological innovation and expanding application horizons. The increasing global focus on environmental protection, food safety, and rapid diagnostics will continue to fuel demand for these sophisticated analytical tools. Market forecasts indicate sustained high growth rates, with significant potential for market expansion in emerging economies. The integration of advanced software, AI-driven analytics, and the development of increasingly miniaturized and cost-effective solutions will solidify the indispensable role of portable chromatography across diverse industries. Investments in research and development, coupled with strategic collaborations, are expected to drive further market penetration and solidify the growth trajectory of this dynamic sector.
Portable Chromatography Systems Industry Segmentation
-
1. Portability
- 1.1. Person Portable
- 1.2. Transportable
-
2. Type
- 2.1. Portable Gas Chromatography Systems
- 2.2. Portable Liquid Chromatography Systems
-
3. End-User
- 3.1. Biotechnology and Pharmaceutical Companies
- 3.2. Research Laboratories
- 3.3. Others
Portable Chromatography Systems Industry Segmentation By Geography
-
1. North America
- 1.1. United States
- 1.2. Canada
- 1.3. Mexico
-
2. Europe
- 2.1. Germany
- 2.2. United Kingdom
- 2.3. France
- 2.4. Italy
- 2.5. Spain
- 2.6. Rest of Europe
-
3. Asia Pacific
- 3.1. China
- 3.2. Japan
- 3.3. India
- 3.4. Australia
- 3.5. South Korea
- 3.6. Rest of Asia Pacific
-
4. Middle East and Africa
- 4.1. GCC
- 4.2. South Africa
- 4.3. Rest of Middle East and Africa
-
5. South America
- 5.1. Brazil
- 5.2. Argentina
- 5.3. Rest of South America
Portable Chromatography Systems Industry REPORT HIGHLIGHTS
| Aspects | Details |
|---|---|
| Study Period | 2019-2033 |
| Base Year | 2024 |
| Estimated Year | 2025 |
| Forecast Period | 2025-2033 |
| Historical Period | 2019-2024 |
| Growth Rate | CAGR of 5.23% from 2019-2033 |
| Segmentation |
|
Table of Contents
- 1. Introduction
- 1.1. Research Scope
- 1.2. Market Segmentation
- 1.3. Research Methodology
- 1.4. Definitions and Assumptions
- 2. Executive Summary
- 2.1. Introduction
- 3. Market Dynamics
- 3.1. Introduction
- 3.2. Market Drivers
- 3.2.1. ; Advancements in Device Technologies; Growing Applications of Portable Chromatography Systems
- 3.3. Market Restrains
- 3.3.1. ; High Cost of Portable Chromatography Techniques
- 3.4. Market Trends
- 3.4.1. Transportable Chromatography Systems to Grow at a Significant Rate
- 4. Market Factor Analysis
- 4.1. Porters Five Forces
- 4.2. Supply/Value Chain
- 4.3. PESTEL analysis
- 4.4. Market Entropy
- 4.5. Patent/Trademark Analysis
- 5. Global Portable Chromatography Systems Industry Analysis, Insights and Forecast, 2019-2031
- 5.1. Market Analysis, Insights and Forecast - by Portability
- 5.1.1. Person Portable
- 5.1.2. Transportable
- 5.2. Market Analysis, Insights and Forecast - by Type
- 5.2.1. Portable Gas Chromatography Systems
- 5.2.2. Portable Liquid Chromatography Systems
- 5.3. Market Analysis, Insights and Forecast - by End-User
- 5.3.1. Biotechnology and Pharmaceutical Companies
- 5.3.2. Research Laboratories
- 5.3.3. Others
- 5.4. Market Analysis, Insights and Forecast - by Region
- 5.4.1. North America
- 5.4.2. Europe
- 5.4.3. Asia Pacific
- 5.4.4. Middle East and Africa
- 5.4.5. South America
- 5.1. Market Analysis, Insights and Forecast - by Portability
- 6. North America Portable Chromatography Systems Industry Analysis, Insights and Forecast, 2019-2031
- 6.1. Market Analysis, Insights and Forecast - by Portability
- 6.1.1. Person Portable
- 6.1.2. Transportable
- 6.2. Market Analysis, Insights and Forecast - by Type
- 6.2.1. Portable Gas Chromatography Systems
- 6.2.2. Portable Liquid Chromatography Systems
- 6.3. Market Analysis, Insights and Forecast - by End-User
- 6.3.1. Biotechnology and Pharmaceutical Companies
- 6.3.2. Research Laboratories
- 6.3.3. Others
- 6.1. Market Analysis, Insights and Forecast - by Portability
- 7. Europe Portable Chromatography Systems Industry Analysis, Insights and Forecast, 2019-2031
- 7.1. Market Analysis, Insights and Forecast - by Portability
- 7.1.1. Person Portable
- 7.1.2. Transportable
- 7.2. Market Analysis, Insights and Forecast - by Type
- 7.2.1. Portable Gas Chromatography Systems
- 7.2.2. Portable Liquid Chromatography Systems
- 7.3. Market Analysis, Insights and Forecast - by End-User
- 7.3.1. Biotechnology and Pharmaceutical Companies
- 7.3.2. Research Laboratories
- 7.3.3. Others
- 7.1. Market Analysis, Insights and Forecast - by Portability
- 8. Asia Pacific Portable Chromatography Systems Industry Analysis, Insights and Forecast, 2019-2031
- 8.1. Market Analysis, Insights and Forecast - by Portability
- 8.1.1. Person Portable
- 8.1.2. Transportable
- 8.2. Market Analysis, Insights and Forecast - by Type
- 8.2.1. Portable Gas Chromatography Systems
- 8.2.2. Portable Liquid Chromatography Systems
- 8.3. Market Analysis, Insights and Forecast - by End-User
- 8.3.1. Biotechnology and Pharmaceutical Companies
- 8.3.2. Research Laboratories
- 8.3.3. Others
- 8.1. Market Analysis, Insights and Forecast - by Portability
- 9. Middle East and Africa Portable Chromatography Systems Industry Analysis, Insights and Forecast, 2019-2031
- 9.1. Market Analysis, Insights and Forecast - by Portability
- 9.1.1. Person Portable
- 9.1.2. Transportable
- 9.2. Market Analysis, Insights and Forecast - by Type
- 9.2.1. Portable Gas Chromatography Systems
- 9.2.2. Portable Liquid Chromatography Systems
- 9.3. Market Analysis, Insights and Forecast - by End-User
- 9.3.1. Biotechnology and Pharmaceutical Companies
- 9.3.2. Research Laboratories
- 9.3.3. Others
- 9.1. Market Analysis, Insights and Forecast - by Portability
- 10. South America Portable Chromatography Systems Industry Analysis, Insights and Forecast, 2019-2031
- 10.1. Market Analysis, Insights and Forecast - by Portability
- 10.1.1. Person Portable
- 10.1.2. Transportable
- 10.2. Market Analysis, Insights and Forecast - by Type
- 10.2.1. Portable Gas Chromatography Systems
- 10.2.2. Portable Liquid Chromatography Systems
- 10.3. Market Analysis, Insights and Forecast - by End-User
- 10.3.1. Biotechnology and Pharmaceutical Companies
- 10.3.2. Research Laboratories
- 10.3.3. Others
- 10.1. Market Analysis, Insights and Forecast - by Portability
- 11. North America Portable Chromatography Systems Industry Analysis, Insights and Forecast, 2019-2031
- 11.1. Market Analysis, Insights and Forecast - By Country/Sub-region
- 11.1.1 United States
- 11.1.2 Canada
- 11.1.3 Mexico
- 12. Europe Portable Chromatography Systems Industry Analysis, Insights and Forecast, 2019-2031
- 12.1. Market Analysis, Insights and Forecast - By Country/Sub-region
- 12.1.1 Germany
- 12.1.2 United Kingdom
- 12.1.3 France
- 12.1.4 Italy
- 12.1.5 Spain
- 12.1.6 Rest of Europe
- 13. Asia Pacific Portable Chromatography Systems Industry Analysis, Insights and Forecast, 2019-2031
- 13.1. Market Analysis, Insights and Forecast - By Country/Sub-region
- 13.1.1 China
- 13.1.2 Japan
- 13.1.3 India
- 13.1.4 Australia
- 13.1.5 South Korea
- 13.1.6 Rest of Asia Pacific
- 14. Middle East and Africa Portable Chromatography Systems Industry Analysis, Insights and Forecast, 2019-2031
- 14.1. Market Analysis, Insights and Forecast - By Country/Sub-region
- 14.1.1 GCC
- 14.1.2 South Africa
- 14.1.3 Rest of Middle East and Africa
- 15. South America Portable Chromatography Systems Industry Analysis, Insights and Forecast, 2019-2031
- 15.1. Market Analysis, Insights and Forecast - By Country/Sub-region
- 15.1.1 Brazil
- 15.1.2 Argentina
- 15.1.3 Rest of South America
- 16. Competitive Analysis
- 16.1. Global Market Share Analysis 2024
- 16.2. Company Profiles
- 16.2.1 Tekmeasure Technologies Pvt Ltd
- 16.2.1.1. Overview
- 16.2.1.2. Products
- 16.2.1.3. SWOT Analysis
- 16.2.1.4. Recent Developments
- 16.2.1.5. Financials (Based on Availability)
- 16.2.2 Sigma Instrument Private Limited
- 16.2.2.1. Overview
- 16.2.2.2. Products
- 16.2.2.3. SWOT Analysis
- 16.2.2.4. Recent Developments
- 16.2.2.5. Financials (Based on Availability)
- 16.2.3 Analytical Technologies Limited
- 16.2.3.1. Overview
- 16.2.3.2. Products
- 16.2.3.3. SWOT Analysis
- 16.2.3.4. Recent Developments
- 16.2.3.5. Financials (Based on Availability)
- 16.2.4 Icon Scientific Inc
- 16.2.4.1. Overview
- 16.2.4.2. Products
- 16.2.4.3. SWOT Analysis
- 16.2.4.4. Recent Developments
- 16.2.4.5. Financials (Based on Availability)
- 16.2.5 Agilent Technologies Inc
- 16.2.5.1. Overview
- 16.2.5.2. Products
- 16.2.5.3. SWOT Analysis
- 16.2.5.4. Recent Developments
- 16.2.5.5. Financials (Based on Availability)
- 16.2.6 PerkinElmer Inc
- 16.2.6.1. Overview
- 16.2.6.2. Products
- 16.2.6.3. SWOT Analysis
- 16.2.6.4. Recent Developments
- 16.2.6.5. Financials (Based on Availability)
- 16.2.7 INFICON
- 16.2.7.1. Overview
- 16.2.7.2. Products
- 16.2.7.3. SWOT Analysis
- 16.2.7.4. Recent Developments
- 16.2.7.5. Financials (Based on Availability)
- 16.2.8 Axcend
- 16.2.8.1. Overview
- 16.2.8.2. Products
- 16.2.8.3. SWOT Analysis
- 16.2.8.4. Recent Developments
- 16.2.8.5. Financials (Based on Availability)
- 16.2.9 FLIR Systems Inc
- 16.2.9.1. Overview
- 16.2.9.2. Products
- 16.2.9.3. SWOT Analysis
- 16.2.9.4. Recent Developments
- 16.2.9.5. Financials (Based on Availability)
- 16.2.1 Tekmeasure Technologies Pvt Ltd
List of Figures
- Figure 1: Global Portable Chromatography Systems Industry Revenue Breakdown (Million, %) by Region 2024 & 2032
- Figure 2: Global Portable Chromatography Systems Industry Volume Breakdown (K Unit, %) by Region 2024 & 2032
- Figure 3: North America Portable Chromatography Systems Industry Revenue (Million), by Country 2024 & 2032
- Figure 4: North America Portable Chromatography Systems Industry Volume (K Unit), by Country 2024 & 2032
- Figure 5: North America Portable Chromatography Systems Industry Revenue Share (%), by Country 2024 & 2032
- Figure 6: North America Portable Chromatography Systems Industry Volume Share (%), by Country 2024 & 2032
- Figure 7: Europe Portable Chromatography Systems Industry Revenue (Million), by Country 2024 & 2032
- Figure 8: Europe Portable Chromatography Systems Industry Volume (K Unit), by Country 2024 & 2032
- Figure 9: Europe Portable Chromatography Systems Industry Revenue Share (%), by Country 2024 & 2032
- Figure 10: Europe Portable Chromatography Systems Industry Volume Share (%), by Country 2024 & 2032
- Figure 11: Asia Pacific Portable Chromatography Systems Industry Revenue (Million), by Country 2024 & 2032
- Figure 12: Asia Pacific Portable Chromatography Systems Industry Volume (K Unit), by Country 2024 & 2032
- Figure 13: Asia Pacific Portable Chromatography Systems Industry Revenue Share (%), by Country 2024 & 2032
- Figure 14: Asia Pacific Portable Chromatography Systems Industry Volume Share (%), by Country 2024 & 2032
- Figure 15: Middle East and Africa Portable Chromatography Systems Industry Revenue (Million), by Country 2024 & 2032
- Figure 16: Middle East and Africa Portable Chromatography Systems Industry Volume (K Unit), by Country 2024 & 2032
- Figure 17: Middle East and Africa Portable Chromatography Systems Industry Revenue Share (%), by Country 2024 & 2032
- Figure 18: Middle East and Africa Portable Chromatography Systems Industry Volume Share (%), by Country 2024 & 2032
- Figure 19: South America Portable Chromatography Systems Industry Revenue (Million), by Country 2024 & 2032
- Figure 20: South America Portable Chromatography Systems Industry Volume (K Unit), by Country 2024 & 2032
- Figure 21: South America Portable Chromatography Systems Industry Revenue Share (%), by Country 2024 & 2032
- Figure 22: South America Portable Chromatography Systems Industry Volume Share (%), by Country 2024 & 2032
- Figure 23: North America Portable Chromatography Systems Industry Revenue (Million), by Portability 2024 & 2032
- Figure 24: North America Portable Chromatography Systems Industry Volume (K Unit), by Portability 2024 & 2032
- Figure 25: North America Portable Chromatography Systems Industry Revenue Share (%), by Portability 2024 & 2032
- Figure 26: North America Portable Chromatography Systems Industry Volume Share (%), by Portability 2024 & 2032
- Figure 27: North America Portable Chromatography Systems Industry Revenue (Million), by Type 2024 & 2032
- Figure 28: North America Portable Chromatography Systems Industry Volume (K Unit), by Type 2024 & 2032
- Figure 29: North America Portable Chromatography Systems Industry Revenue Share (%), by Type 2024 & 2032
- Figure 30: North America Portable Chromatography Systems Industry Volume Share (%), by Type 2024 & 2032
- Figure 31: North America Portable Chromatography Systems Industry Revenue (Million), by End-User 2024 & 2032
- Figure 32: North America Portable Chromatography Systems Industry Volume (K Unit), by End-User 2024 & 2032
- Figure 33: North America Portable Chromatography Systems Industry Revenue Share (%), by End-User 2024 & 2032
- Figure 34: North America Portable Chromatography Systems Industry Volume Share (%), by End-User 2024 & 2032
- Figure 35: North America Portable Chromatography Systems Industry Revenue (Million), by Country 2024 & 2032
- Figure 36: North America Portable Chromatography Systems Industry Volume (K Unit), by Country 2024 & 2032
- Figure 37: North America Portable Chromatography Systems Industry Revenue Share (%), by Country 2024 & 2032
- Figure 38: North America Portable Chromatography Systems Industry Volume Share (%), by Country 2024 & 2032
- Figure 39: Europe Portable Chromatography Systems Industry Revenue (Million), by Portability 2024 & 2032
- Figure 40: Europe Portable Chromatography Systems Industry Volume (K Unit), by Portability 2024 & 2032
- Figure 41: Europe Portable Chromatography Systems Industry Revenue Share (%), by Portability 2024 & 2032
- Figure 42: Europe Portable Chromatography Systems Industry Volume Share (%), by Portability 2024 & 2032
- Figure 43: Europe Portable Chromatography Systems Industry Revenue (Million), by Type 2024 & 2032
- Figure 44: Europe Portable Chromatography Systems Industry Volume (K Unit), by Type 2024 & 2032
- Figure 45: Europe Portable Chromatography Systems Industry Revenue Share (%), by Type 2024 & 2032
- Figure 46: Europe Portable Chromatography Systems Industry Volume Share (%), by Type 2024 & 2032
- Figure 47: Europe Portable Chromatography Systems Industry Revenue (Million), by End-User 2024 & 2032
- Figure 48: Europe Portable Chromatography Systems Industry Volume (K Unit), by End-User 2024 & 2032
- Figure 49: Europe Portable Chromatography Systems Industry Revenue Share (%), by End-User 2024 & 2032
- Figure 50: Europe Portable Chromatography Systems Industry Volume Share (%), by End-User 2024 & 2032
- Figure 51: Europe Portable Chromatography Systems Industry Revenue (Million), by Country 2024 & 2032
- Figure 52: Europe Portable Chromatography Systems Industry Volume (K Unit), by Country 2024 & 2032
- Figure 53: Europe Portable Chromatography Systems Industry Revenue Share (%), by Country 2024 & 2032
- Figure 54: Europe Portable Chromatography Systems Industry Volume Share (%), by Country 2024 & 2032
- Figure 55: Asia Pacific Portable Chromatography Systems Industry Revenue (Million), by Portability 2024 & 2032
- Figure 56: Asia Pacific Portable Chromatography Systems Industry Volume (K Unit), by Portability 2024 & 2032
- Figure 57: Asia Pacific Portable Chromatography Systems Industry Revenue Share (%), by Portability 2024 & 2032
- Figure 58: Asia Pacific Portable Chromatography Systems Industry Volume Share (%), by Portability 2024 & 2032
- Figure 59: Asia Pacific Portable Chromatography Systems Industry Revenue (Million), by Type 2024 & 2032
- Figure 60: Asia Pacific Portable Chromatography Systems Industry Volume (K Unit), by Type 2024 & 2032
- Figure 61: Asia Pacific Portable Chromatography Systems Industry Revenue Share (%), by Type 2024 & 2032
- Figure 62: Asia Pacific Portable Chromatography Systems Industry Volume Share (%), by Type 2024 & 2032
- Figure 63: Asia Pacific Portable Chromatography Systems Industry Revenue (Million), by End-User 2024 & 2032
- Figure 64: Asia Pacific Portable Chromatography Systems Industry Volume (K Unit), by End-User 2024 & 2032
- Figure 65: Asia Pacific Portable Chromatography Systems Industry Revenue Share (%), by End-User 2024 & 2032
- Figure 66: Asia Pacific Portable Chromatography Systems Industry Volume Share (%), by End-User 2024 & 2032
- Figure 67: Asia Pacific Portable Chromatography Systems Industry Revenue (Million), by Country 2024 & 2032
- Figure 68: Asia Pacific Portable Chromatography Systems Industry Volume (K Unit), by Country 2024 & 2032
- Figure 69: Asia Pacific Portable Chromatography Systems Industry Revenue Share (%), by Country 2024 & 2032
- Figure 70: Asia Pacific Portable Chromatography Systems Industry Volume Share (%), by Country 2024 & 2032
- Figure 71: Middle East and Africa Portable Chromatography Systems Industry Revenue (Million), by Portability 2024 & 2032
- Figure 72: Middle East and Africa Portable Chromatography Systems Industry Volume (K Unit), by Portability 2024 & 2032
- Figure 73: Middle East and Africa Portable Chromatography Systems Industry Revenue Share (%), by Portability 2024 & 2032
- Figure 74: Middle East and Africa Portable Chromatography Systems Industry Volume Share (%), by Portability 2024 & 2032
- Figure 75: Middle East and Africa Portable Chromatography Systems Industry Revenue (Million), by Type 2024 & 2032
- Figure 76: Middle East and Africa Portable Chromatography Systems Industry Volume (K Unit), by Type 2024 & 2032
- Figure 77: Middle East and Africa Portable Chromatography Systems Industry Revenue Share (%), by Type 2024 & 2032
- Figure 78: Middle East and Africa Portable Chromatography Systems Industry Volume Share (%), by Type 2024 & 2032
- Figure 79: Middle East and Africa Portable Chromatography Systems Industry Revenue (Million), by End-User 2024 & 2032
- Figure 80: Middle East and Africa Portable Chromatography Systems Industry Volume (K Unit), by End-User 2024 & 2032
- Figure 81: Middle East and Africa Portable Chromatography Systems Industry Revenue Share (%), by End-User 2024 & 2032
- Figure 82: Middle East and Africa Portable Chromatography Systems Industry Volume Share (%), by End-User 2024 & 2032
- Figure 83: Middle East and Africa Portable Chromatography Systems Industry Revenue (Million), by Country 2024 & 2032
- Figure 84: Middle East and Africa Portable Chromatography Systems Industry Volume (K Unit), by Country 2024 & 2032
- Figure 85: Middle East and Africa Portable Chromatography Systems Industry Revenue Share (%), by Country 2024 & 2032
- Figure 86: Middle East and Africa Portable Chromatography Systems Industry Volume Share (%), by Country 2024 & 2032
- Figure 87: South America Portable Chromatography Systems Industry Revenue (Million), by Portability 2024 & 2032
- Figure 88: South America Portable Chromatography Systems Industry Volume (K Unit), by Portability 2024 & 2032
- Figure 89: South America Portable Chromatography Systems Industry Revenue Share (%), by Portability 2024 & 2032
- Figure 90: South America Portable Chromatography Systems Industry Volume Share (%), by Portability 2024 & 2032
- Figure 91: South America Portable Chromatography Systems Industry Revenue (Million), by Type 2024 & 2032
- Figure 92: South America Portable Chromatography Systems Industry Volume (K Unit), by Type 2024 & 2032
- Figure 93: South America Portable Chromatography Systems Industry Revenue Share (%), by Type 2024 & 2032
- Figure 94: South America Portable Chromatography Systems Industry Volume Share (%), by Type 2024 & 2032
- Figure 95: South America Portable Chromatography Systems Industry Revenue (Million), by End-User 2024 & 2032
- Figure 96: South America Portable Chromatography Systems Industry Volume (K Unit), by End-User 2024 & 2032
- Figure 97: South America Portable Chromatography Systems Industry Revenue Share (%), by End-User 2024 & 2032
- Figure 98: South America Portable Chromatography Systems Industry Volume Share (%), by End-User 2024 & 2032
- Figure 99: South America Portable Chromatography Systems Industry Revenue (Million), by Country 2024 & 2032
- Figure 100: South America Portable Chromatography Systems Industry Volume (K Unit), by Country 2024 & 2032
- Figure 101: South America Portable Chromatography Systems Industry Revenue Share (%), by Country 2024 & 2032
- Figure 102: South America Portable Chromatography Systems Industry Volume Share (%), by Country 2024 & 2032
List of Tables
- Table 1: Global Portable Chromatography Systems Industry Revenue Million Forecast, by Region 2019 & 2032
- Table 2: Global Portable Chromatography Systems Industry Volume K Unit Forecast, by Region 2019 & 2032
- Table 3: Global Portable Chromatography Systems Industry Revenue Million Forecast, by Portability 2019 & 2032
- Table 4: Global Portable Chromatography Systems Industry Volume K Unit Forecast, by Portability 2019 & 2032
- Table 5: Global Portable Chromatography Systems Industry Revenue Million Forecast, by Type 2019 & 2032
- Table 6: Global Portable Chromatography Systems Industry Volume K Unit Forecast, by Type 2019 & 2032
- Table 7: Global Portable Chromatography Systems Industry Revenue Million Forecast, by End-User 2019 & 2032
- Table 8: Global Portable Chromatography Systems Industry Volume K Unit Forecast, by End-User 2019 & 2032
- Table 9: Global Portable Chromatography Systems Industry Revenue Million Forecast, by Region 2019 & 2032
- Table 10: Global Portable Chromatography Systems Industry Volume K Unit Forecast, by Region 2019 & 2032
- Table 11: Global Portable Chromatography Systems Industry Revenue Million Forecast, by Country 2019 & 2032
- Table 12: Global Portable Chromatography Systems Industry Volume K Unit Forecast, by Country 2019 & 2032
- Table 13: United States Portable Chromatography Systems Industry Revenue (Million) Forecast, by Application 2019 & 2032
- Table 14: United States Portable Chromatography Systems Industry Volume (K Unit) Forecast, by Application 2019 & 2032
- Table 15: Canada Portable Chromatography Systems Industry Revenue (Million) Forecast, by Application 2019 & 2032
- Table 16: Canada Portable Chromatography Systems Industry Volume (K Unit) Forecast, by Application 2019 & 2032
- Table 17: Mexico Portable Chromatography Systems Industry Revenue (Million) Forecast, by Application 2019 & 2032
- Table 18: Mexico Portable Chromatography Systems Industry Volume (K Unit) Forecast, by Application 2019 & 2032
- Table 19: Global Portable Chromatography Systems Industry Revenue Million Forecast, by Country 2019 & 2032
- Table 20: Global Portable Chromatography Systems Industry Volume K Unit Forecast, by Country 2019 & 2032
- Table 21: Germany Portable Chromatography Systems Industry Revenue (Million) Forecast, by Application 2019 & 2032
- Table 22: Germany Portable Chromatography Systems Industry Volume (K Unit) Forecast, by Application 2019 & 2032
- Table 23: United Kingdom Portable Chromatography Systems Industry Revenue (Million) Forecast, by Application 2019 & 2032
- Table 24: United Kingdom Portable Chromatography Systems Industry Volume (K Unit) Forecast, by Application 2019 & 2032
- Table 25: France Portable Chromatography Systems Industry Revenue (Million) Forecast, by Application 2019 & 2032
- Table 26: France Portable Chromatography Systems Industry Volume (K Unit) Forecast, by Application 2019 & 2032
- Table 27: Italy Portable Chromatography Systems Industry Revenue (Million) Forecast, by Application 2019 & 2032
- Table 28: Italy Portable Chromatography Systems Industry Volume (K Unit) Forecast, by Application 2019 & 2032
- Table 29: Spain Portable Chromatography Systems Industry Revenue (Million) Forecast, by Application 2019 & 2032
- Table 30: Spain Portable Chromatography Systems Industry Volume (K Unit) Forecast, by Application 2019 & 2032
- Table 31: Rest of Europe Portable Chromatography Systems Industry Revenue (Million) Forecast, by Application 2019 & 2032
- Table 32: Rest of Europe Portable Chromatography Systems Industry Volume (K Unit) Forecast, by Application 2019 & 2032
- Table 33: Global Portable Chromatography Systems Industry Revenue Million Forecast, by Country 2019 & 2032
- Table 34: Global Portable Chromatography Systems Industry Volume K Unit Forecast, by Country 2019 & 2032
- Table 35: China Portable Chromatography Systems Industry Revenue (Million) Forecast, by Application 2019 & 2032
- Table 36: China Portable Chromatography Systems Industry Volume (K Unit) Forecast, by Application 2019 & 2032
- Table 37: Japan Portable Chromatography Systems Industry Revenue (Million) Forecast, by Application 2019 & 2032
- Table 38: Japan Portable Chromatography Systems Industry Volume (K Unit) Forecast, by Application 2019 & 2032
- Table 39: India Portable Chromatography Systems Industry Revenue (Million) Forecast, by Application 2019 & 2032
- Table 40: India Portable Chromatography Systems Industry Volume (K Unit) Forecast, by Application 2019 & 2032
- Table 41: Australia Portable Chromatography Systems Industry Revenue (Million) Forecast, by Application 2019 & 2032
- Table 42: Australia Portable Chromatography Systems Industry Volume (K Unit) Forecast, by Application 2019 & 2032
- Table 43: South Korea Portable Chromatography Systems Industry Revenue (Million) Forecast, by Application 2019 & 2032
- Table 44: South Korea Portable Chromatography Systems Industry Volume (K Unit) Forecast, by Application 2019 & 2032
- Table 45: Rest of Asia Pacific Portable Chromatography Systems Industry Revenue (Million) Forecast, by Application 2019 & 2032
- Table 46: Rest of Asia Pacific Portable Chromatography Systems Industry Volume (K Unit) Forecast, by Application 2019 & 2032
- Table 47: Global Portable Chromatography Systems Industry Revenue Million Forecast, by Country 2019 & 2032
- Table 48: Global Portable Chromatography Systems Industry Volume K Unit Forecast, by Country 2019 & 2032
- Table 49: GCC Portable Chromatography Systems Industry Revenue (Million) Forecast, by Application 2019 & 2032
- Table 50: GCC Portable Chromatography Systems Industry Volume (K Unit) Forecast, by Application 2019 & 2032
- Table 51: South Africa Portable Chromatography Systems Industry Revenue (Million) Forecast, by Application 2019 & 2032
- Table 52: South Africa Portable Chromatography Systems Industry Volume (K Unit) Forecast, by Application 2019 & 2032
- Table 53: Rest of Middle East and Africa Portable Chromatography Systems Industry Revenue (Million) Forecast, by Application 2019 & 2032
- Table 54: Rest of Middle East and Africa Portable Chromatography Systems Industry Volume (K Unit) Forecast, by Application 2019 & 2032
- Table 55: Global Portable Chromatography Systems Industry Revenue Million Forecast, by Country 2019 & 2032
- Table 56: Global Portable Chromatography Systems Industry Volume K Unit Forecast, by Country 2019 & 2032
- Table 57: Brazil Portable Chromatography Systems Industry Revenue (Million) Forecast, by Application 2019 & 2032
- Table 58: Brazil Portable Chromatography Systems Industry Volume (K Unit) Forecast, by Application 2019 & 2032
- Table 59: Argentina Portable Chromatography Systems Industry Revenue (Million) Forecast, by Application 2019 & 2032
- Table 60: Argentina Portable Chromatography Systems Industry Volume (K Unit) Forecast, by Application 2019 & 2032
- Table 61: Rest of South America Portable Chromatography Systems Industry Revenue (Million) Forecast, by Application 2019 & 2032
- Table 62: Rest of South America Portable Chromatography Systems Industry Volume (K Unit) Forecast, by Application 2019 & 2032
- Table 63: Global Portable Chromatography Systems Industry Revenue Million Forecast, by Portability 2019 & 2032
- Table 64: Global Portable Chromatography Systems Industry Volume K Unit Forecast, by Portability 2019 & 2032
- Table 65: Global Portable Chromatography Systems Industry Revenue Million Forecast, by Type 2019 & 2032
- Table 66: Global Portable Chromatography Systems Industry Volume K Unit Forecast, by Type 2019 & 2032
- Table 67: Global Portable Chromatography Systems Industry Revenue Million Forecast, by End-User 2019 & 2032
- Table 68: Global Portable Chromatography Systems Industry Volume K Unit Forecast, by End-User 2019 & 2032
- Table 69: Global Portable Chromatography Systems Industry Revenue Million Forecast, by Country 2019 & 2032
- Table 70: Global Portable Chromatography Systems Industry Volume K Unit Forecast, by Country 2019 & 2032
- Table 71: United States Portable Chromatography Systems Industry Revenue (Million) Forecast, by Application 2019 & 2032
- Table 72: United States Portable Chromatography Systems Industry Volume (K Unit) Forecast, by Application 2019 & 2032
- Table 73: Canada Portable Chromatography Systems Industry Revenue (Million) Forecast, by Application 2019 & 2032
- Table 74: Canada Portable Chromatography Systems Industry Volume (K Unit) Forecast, by Application 2019 & 2032
- Table 75: Mexico Portable Chromatography Systems Industry Revenue (Million) Forecast, by Application 2019 & 2032
- Table 76: Mexico Portable Chromatography Systems Industry Volume (K Unit) Forecast, by Application 2019 & 2032
- Table 77: Global Portable Chromatography Systems Industry Revenue Million Forecast, by Portability 2019 & 2032
- Table 78: Global Portable Chromatography Systems Industry Volume K Unit Forecast, by Portability 2019 & 2032
- Table 79: Global Portable Chromatography Systems Industry Revenue Million Forecast, by Type 2019 & 2032
- Table 80: Global Portable Chromatography Systems Industry Volume K Unit Forecast, by Type 2019 & 2032
- Table 81: Global Portable Chromatography Systems Industry Revenue Million Forecast, by End-User 2019 & 2032
- Table 82: Global Portable Chromatography Systems Industry Volume K Unit Forecast, by End-User 2019 & 2032
- Table 83: Global Portable Chromatography Systems Industry Revenue Million Forecast, by Country 2019 & 2032
- Table 84: Global Portable Chromatography Systems Industry Volume K Unit Forecast, by Country 2019 & 2032
- Table 85: Germany Portable Chromatography Systems Industry Revenue (Million) Forecast, by Application 2019 & 2032
- Table 86: Germany Portable Chromatography Systems Industry Volume (K Unit) Forecast, by Application 2019 & 2032
- Table 87: United Kingdom Portable Chromatography Systems Industry Revenue (Million) Forecast, by Application 2019 & 2032
- Table 88: United Kingdom Portable Chromatography Systems Industry Volume (K Unit) Forecast, by Application 2019 & 2032
- Table 89: France Portable Chromatography Systems Industry Revenue (Million) Forecast, by Application 2019 & 2032
- Table 90: France Portable Chromatography Systems Industry Volume (K Unit) Forecast, by Application 2019 & 2032
- Table 91: Italy Portable Chromatography Systems Industry Revenue (Million) Forecast, by Application 2019 & 2032
- Table 92: Italy Portable Chromatography Systems Industry Volume (K Unit) Forecast, by Application 2019 & 2032
- Table 93: Spain Portable Chromatography Systems Industry Revenue (Million) Forecast, by Application 2019 & 2032
- Table 94: Spain Portable Chromatography Systems Industry Volume (K Unit) Forecast, by Application 2019 & 2032
- Table 95: Rest of Europe Portable Chromatography Systems Industry Revenue (Million) Forecast, by Application 2019 & 2032
- Table 96: Rest of Europe Portable Chromatography Systems Industry Volume (K Unit) Forecast, by Application 2019 & 2032
- Table 97: Global Portable Chromatography Systems Industry Revenue Million Forecast, by Portability 2019 & 2032
- Table 98: Global Portable Chromatography Systems Industry Volume K Unit Forecast, by Portability 2019 & 2032
- Table 99: Global Portable Chromatography Systems Industry Revenue Million Forecast, by Type 2019 & 2032
- Table 100: Global Portable Chromatography Systems Industry Volume K Unit Forecast, by Type 2019 & 2032
- Table 101: Global Portable Chromatography Systems Industry Revenue Million Forecast, by End-User 2019 & 2032
- Table 102: Global Portable Chromatography Systems Industry Volume K Unit Forecast, by End-User 2019 & 2032
- Table 103: Global Portable Chromatography Systems Industry Revenue Million Forecast, by Country 2019 & 2032
- Table 104: Global Portable Chromatography Systems Industry Volume K Unit Forecast, by Country 2019 & 2032
- Table 105: China Portable Chromatography Systems Industry Revenue (Million) Forecast, by Application 2019 & 2032
- Table 106: China Portable Chromatography Systems Industry Volume (K Unit) Forecast, by Application 2019 & 2032
- Table 107: Japan Portable Chromatography Systems Industry Revenue (Million) Forecast, by Application 2019 & 2032
- Table 108: Japan Portable Chromatography Systems Industry Volume (K Unit) Forecast, by Application 2019 & 2032
- Table 109: India Portable Chromatography Systems Industry Revenue (Million) Forecast, by Application 2019 & 2032
- Table 110: India Portable Chromatography Systems Industry Volume (K Unit) Forecast, by Application 2019 & 2032
- Table 111: Australia Portable Chromatography Systems Industry Revenue (Million) Forecast, by Application 2019 & 2032
- Table 112: Australia Portable Chromatography Systems Industry Volume (K Unit) Forecast, by Application 2019 & 2032
- Table 113: South Korea Portable Chromatography Systems Industry Revenue (Million) Forecast, by Application 2019 & 2032
- Table 114: South Korea Portable Chromatography Systems Industry Volume (K Unit) Forecast, by Application 2019 & 2032
- Table 115: Rest of Asia Pacific Portable Chromatography Systems Industry Revenue (Million) Forecast, by Application 2019 & 2032
- Table 116: Rest of Asia Pacific Portable Chromatography Systems Industry Volume (K Unit) Forecast, by Application 2019 & 2032
- Table 117: Global Portable Chromatography Systems Industry Revenue Million Forecast, by Portability 2019 & 2032
- Table 118: Global Portable Chromatography Systems Industry Volume K Unit Forecast, by Portability 2019 & 2032
- Table 119: Global Portable Chromatography Systems Industry Revenue Million Forecast, by Type 2019 & 2032
- Table 120: Global Portable Chromatography Systems Industry Volume K Unit Forecast, by Type 2019 & 2032
- Table 121: Global Portable Chromatography Systems Industry Revenue Million Forecast, by End-User 2019 & 2032
- Table 122: Global Portable Chromatography Systems Industry Volume K Unit Forecast, by End-User 2019 & 2032
- Table 123: Global Portable Chromatography Systems Industry Revenue Million Forecast, by Country 2019 & 2032
- Table 124: Global Portable Chromatography Systems Industry Volume K Unit Forecast, by Country 2019 & 2032
- Table 125: GCC Portable Chromatography Systems Industry Revenue (Million) Forecast, by Application 2019 & 2032
- Table 126: GCC Portable Chromatography Systems Industry Volume (K Unit) Forecast, by Application 2019 & 2032
- Table 127: South Africa Portable Chromatography Systems Industry Revenue (Million) Forecast, by Application 2019 & 2032
- Table 128: South Africa Portable Chromatography Systems Industry Volume (K Unit) Forecast, by Application 2019 & 2032
- Table 129: Rest of Middle East and Africa Portable Chromatography Systems Industry Revenue (Million) Forecast, by Application 2019 & 2032
- Table 130: Rest of Middle East and Africa Portable Chromatography Systems Industry Volume (K Unit) Forecast, by Application 2019 & 2032
- Table 131: Global Portable Chromatography Systems Industry Revenue Million Forecast, by Portability 2019 & 2032
- Table 132: Global Portable Chromatography Systems Industry Volume K Unit Forecast, by Portability 2019 & 2032
- Table 133: Global Portable Chromatography Systems Industry Revenue Million Forecast, by Type 2019 & 2032
- Table 134: Global Portable Chromatography Systems Industry Volume K Unit Forecast, by Type 2019 & 2032
- Table 135: Global Portable Chromatography Systems Industry Revenue Million Forecast, by End-User 2019 & 2032
- Table 136: Global Portable Chromatography Systems Industry Volume K Unit Forecast, by End-User 2019 & 2032
- Table 137: Global Portable Chromatography Systems Industry Revenue Million Forecast, by Country 2019 & 2032
- Table 138: Global Portable Chromatography Systems Industry Volume K Unit Forecast, by Country 2019 & 2032
- Table 139: Brazil Portable Chromatography Systems Industry Revenue (Million) Forecast, by Application 2019 & 2032
- Table 140: Brazil Portable Chromatography Systems Industry Volume (K Unit) Forecast, by Application 2019 & 2032
- Table 141: Argentina Portable Chromatography Systems Industry Revenue (Million) Forecast, by Application 2019 & 2032
- Table 142: Argentina Portable Chromatography Systems Industry Volume (K Unit) Forecast, by Application 2019 & 2032
- Table 143: Rest of South America Portable Chromatography Systems Industry Revenue (Million) Forecast, by Application 2019 & 2032
- Table 144: Rest of South America Portable Chromatography Systems Industry Volume (K Unit) Forecast, by Application 2019 & 2032
Frequently Asked Questions
1. What is the projected Compound Annual Growth Rate (CAGR) of the Portable Chromatography Systems Industry?
The projected CAGR is approximately 5.23%.
2. Which companies are prominent players in the Portable Chromatography Systems Industry?
Key companies in the market include Tekmeasure Technologies Pvt Ltd , Sigma Instrument Private Limited, Analytical Technologies Limited, Icon Scientific Inc, Agilent Technologies Inc, PerkinElmer Inc, INFICON, Axcend, FLIR Systems Inc.
3. What are the main segments of the Portable Chromatography Systems Industry?
The market segments include Portability, Type, End-User.
4. Can you provide details about the market size?
The market size is estimated to be USD 563.52 Million as of 2022.
5. What are some drivers contributing to market growth?
; Advancements in Device Technologies; Growing Applications of Portable Chromatography Systems.
6. What are the notable trends driving market growth?
Transportable Chromatography Systems to Grow at a Significant Rate.
7. Are there any restraints impacting market growth?
; High Cost of Portable Chromatography Techniques.
8. Can you provide examples of recent developments in the market?
N/A
9. What pricing options are available for accessing the report?
Pricing options include single-user, multi-user, and enterprise licenses priced at USD 4750, USD 5250, and USD 8750 respectively.
10. Is the market size provided in terms of value or volume?
The market size is provided in terms of value, measured in Million and volume, measured in K Unit.
11. Are there any specific market keywords associated with the report?
Yes, the market keyword associated with the report is "Portable Chromatography Systems Industry," which aids in identifying and referencing the specific market segment covered.
12. How do I determine which pricing option suits my needs best?
The pricing options vary based on user requirements and access needs. Individual users may opt for single-user licenses, while businesses requiring broader access may choose multi-user or enterprise licenses for cost-effective access to the report.
13. Are there any additional resources or data provided in the Portable Chromatography Systems Industry report?
While the report offers comprehensive insights, it's advisable to review the specific contents or supplementary materials provided to ascertain if additional resources or data are available.
14. How can I stay updated on further developments or reports in the Portable Chromatography Systems Industry?
To stay informed about further developments, trends, and reports in the Portable Chromatography Systems Industry, consider subscribing to industry newsletters, following relevant companies and organizations, or regularly checking reputable industry news sources and publications.
Methodology
Step 1 - Identification of Relevant Samples Size from Population Database


Step 2 - Approaches for Defining Global Market Size (Value, Volume* & Price*)

Note*: In applicable scenarios
Step 3 - Data Sources
Primary Research
- Web Analytics
- Survey Reports
- Research Institute
- Latest Research Reports
- Opinion Leaders
Secondary Research
- Annual Reports
- White Paper
- Latest Press Release
- Industry Association
- Paid Database
- Investor Presentations

Step 4 - Data Triangulation
Involves using different sources of information in order to increase the validity of a study
These sources are likely to be stakeholders in a program - participants, other researchers, program staff, other community members, and so on.
Then we put all data in single framework & apply various statistical tools to find out the dynamic on the market.
During the analysis stage, feedback from the stakeholder groups would be compared to determine areas of agreement as well as areas of divergence
